In addition to their benchmarking efforts, our Applications Performance Group works with some of our largest E-Business Suite customers in the world. These customers have thousands of concurrent end-users, sprawling multi-terabyte databases, enormous clusters of application-tier servers, and massive RAC architectures. The Applications Performance Group is called in whenever a customer experiences severe performance issues. Every year, our performance architects take all of their hard-won experience with these customers and distill it into a single OpenWorld presentation. Wondering how many JVMs to use per CPU? Curious about tuning the garbage collection parameters on your app tier? Want some tips for optimizing your Concurrent manager setup? Isam Alyousfi and Lester Gutierrez cover these topics, and much, much more, in their densely-packed presentation:
It’s difficult to convey the depth and range of the performance-tuning tips that they capture, but here’s an outline of the topics that they cover:
Tuning the applications tier
Pointers to resources and performance-related patches
Tips for tuning and debugging Forms
OC4J and JVM sizing guidelines (e.g. number of JVMs per CPU, number of users per JVM)
Tools for tuning the application tier
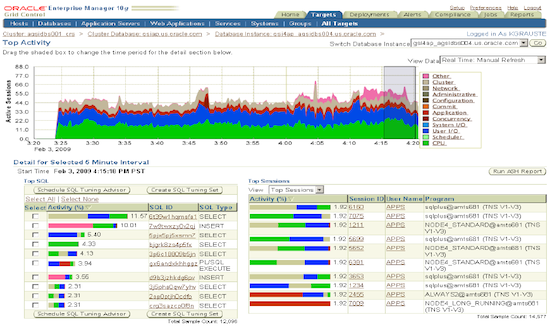
Diagnostic framework for investigating response time / CPU issues
Garbage collection (GC) tuning tips
Common causes of OutOfMemoryError conditions
Symptoms of memory leaks
Using JDBC connection identification to map JDBC sessions to a JVM process
Performance implications of end-user training on web application resource consumption
Using the Pool Monitor to check Framework applications and JVM utilization
Using EM Monitoring and Application Diagnostics for Java (AD4J) to monitor JVMs on different hosts
Using JConsole to analyze heap dump issues
Performance-related patches to consider
Tuning the Concurrent Manager
General tips for maximizing job throughput
Tips for workload management, including the number of target processes per CPU
Tips for Transaction Managers (TMs)
Tips for tracing and speeding up Concurrent Reports
Using Parallel Concurrent Processing (PCP) in RAC deployments
Tuning the client tier and network
Pointers to a new whitepaper, and tips for optimizing desktop client configurations
Tips for reducing browser memory footprints
Guidance on network latency and co-locating database and application tier servers
Network profiling and packet analysis techniques
Use of caching tools to reduce network traffic between client and middle-tiers
Tuning the database tier
init.ora recommended settings
Consequences of undersized buffer caches or shared pools
I/O optimization techniques
Recommended performance features
Using Automatic Workload Repository (AWR) data and baselines
Linking AWR with ASH data
Tips for using DB Console
Techniques for gathering statistics
Recommendations for OATM Tablespace Model conversions
SQL issue triage notes, and common problems
Benefits of upgrading to 11g Database
Notable performance-related features in the 11g Database
Advanced Compression performance benchmarks
11g Automatic SQL monitoring and tuning
SQL tracing enhancements in 11g DB
11g Optimizer improvements
Tuning the applications
Pointers to application module tuning resources
Recommended performance-related patches and configuration guidance for specific products: Create Accounting XLA, Accounts Receivables AR, Accounts Payables AP, iPayment IBY, Incentive Compensation CN, Time & Labor, Workflow, Order Management OM, Payroll
Logging, purging, and archiving
Accessing the Purge Portal
Upgrade performance tips
This presentation is chock full of tips, pointers, and hard-won knowledge. It represents the distillation of countless performance-related Service Requests and customer escalations. If you’re grappling with performance issues in your environment, or simply trying to squeeze more performance out of existing hardware, I’d strongly recommend downloading this presentation. Listening to the Session If you registered for OpenWorld, here’s a link to the OpenWorld On Demand page where you can download the presentation or listen to the live recording of this session. Related Articles
Steven Chan was a Senior Director in the Oracle Applications Technology Group. He managed EBS technology stack certifications, ATG product management, ATG documentation and curriculum, and ATG Quality Assurance in the E-Business Suite Development division.
Steven joined Oracle in 1998. Steven retired from Oracle in 2019. Prior to joining Oracle, he held positions with IBM, Deloitte & Touche Consulting, and other software companies.
Steven is an Oracle ACE and a three-time recipient of the Oracle Applications User Group 'Ambassador of the Year' Award (2007, 2009, 2010). Steven received the Oracle Applications User Group Lifetime Service Award in 2011.