Whenever you are planning to upgrade components in your E-biz 11i environment, you shouldn’t forget to review the Technology Stack components as well as the Applications 11i code.
There are some compelling technology benefits justifying the upgrade of your Apps Middle Tiers to JDK version 1.5, but the best reason for me is the JConsole GUI monitoring tool, which I think is really cool
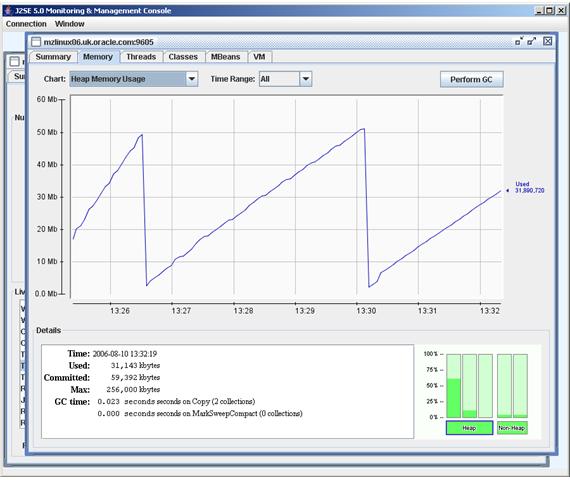
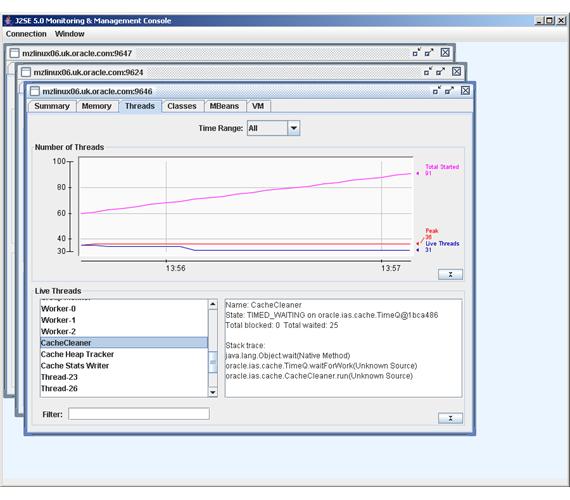
For a better description of JConsole and its capabilities you can review this Sun article, but in summary provides a lightweight, always-on monitoring capability for your JVMs. Using JConsole, you can view graphically the Heap usage, Threads, classes and other statistics in real time, which gives you a great idea of activity inside the JVM process, delivered in an easily digestible form. I can happily sit and watch my JVMs chug away for hours using JConsole, and is more fun than watching TV!
JConsole with Apps Release 11i
You can run JConsole either locally (from the server that you are monitoring) or remotely via a network connection. With Apps 11i, the safest and easier option is to run locally.
Whether running local or remote, you need to add the following lines to your jserv.properties file. You should make this change following “Customizing an AutoConfig Environment” (Metalink note 270519.1) to ensure AutoConfig does not drop these custom settings.
wrapper.bin.parameters=-Dcom.sun.management.jmxremote
wrapper.bin.parameters=-Dcom.sun.management.jmxremote.ssl=false
** NOTE – you may wish to use SSL for better security
(I have raised enhancement request 5459173 to provide these parameters out of the box for the Apps 11i AutoConfig templates)
Connecting Locally
Once you have started your JVMs using the new parameters described above, you simply launch JConsole as the same operating system user, which presents you with a list of all the JVM Processes for you to connect to and monitor.
Connecting Remotely
Running JConsole remotely is a little more complex and certainly not so secure… meaning it may introduce unacceptable risk for a production environment. Firstly, authentication is enabled by default so you will either need to configure your username/passwords or could choose to defeat authentication entirely by using the jserv.properties value below. The following change allows ANYONE to attach to your JVM processes so should not be used lightly !
wrapper.bin.parameters=-Dcom.sun.management.jmxremote.authenticate=false
The second issue to overcome is that each JVM needs its own TCP port to accept connections. One possible approach is to customize the $IAS_ORACLE_HOME/Apache/Apache/bin/java.sh JVM startup script and provide a port number range from which you allocate a tcp port number. The sample script modification below is not perfect (as it doesn’t resolve port number clashes) but may give you some ideas as to how you could overcome this issue in your own environment.
Add this modification just before the existing line
exec $JSERVJAVA $JAVA_ADDITIONAL_ARGS $ARGV 1>> $STDOUTLOG 2>> $STDERRLOG
#### start of modification for JConsole remote monitoring
#### Not supported or recommended by Oracle Corporation
####
#### If there is a clash of port numbers calculated, then
#### the JVM will not startup. Script therefore needs to be
#### improved to check port not already in use
####
#### Use port number range 9600 – 9650 as an illustration
if [ “$JDK_VERSION” = “1.5” ] ; then
mJMXPORTMIN=9600
mJXMPORTMAX=9650
mNUMPORTS=`expr ${mJXMPORTMAX} – ${mJMXPORTMIN}`
mRANDOM=$(((($RANDOM*${mNUMPORTS})/32767)+1))
mJMXPORT=`expr ${mRANDOM} + ${mJMXPORTMIN}`
JAVA_ADDITIONAL_ARGS=” -DCLIENT_PROCESSID=$$ -Dcom.sun.management.jmxremote.port=${mJMXPORT}”
fi
#### end of modification
After starting your JVMs you then need to identify the TCP port they are listening on. You can do this using the following command:
netstat -a | grep tcp | grep 96
You can then startup JConsole from your PC (or any other machine) and using the “Remote” tab you enter the machine name and port you wish to connect to and also the username/password if appropriate. You then get the same monitoring capabilities as if you had connected locally.
Conclusion
The real time graphical monitoring provided by JConsole, along with its ease of implementation and use, provides a useful tool to help you understand the way your JVMs are being utilised. This knowledge can then be used to tune and troubleshoot your Apps 11i environments.