[Editor’s Note: This is the first of a series of four articles on new AutoConfig features. These articles are written by members of our AutoConfig Development team. This is your chance to get the inside track on these
advanced features and provide your feedback directly to our developers.]
Ever wonder what’s taking up the time during a given AutoConfig run in your E-Business Suite environment? Want to optimize the performance of your techstack configuration customizations? The AutoConfig Performance Profiler gathers
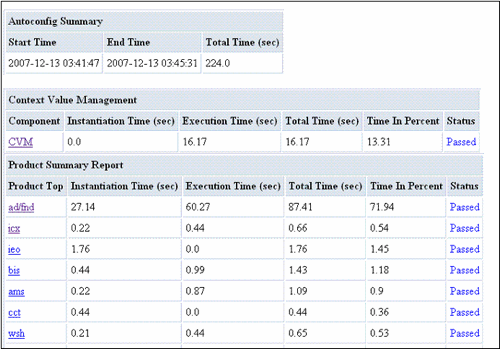
data about an AutoConfig run and generates a consolidated AutoConfig profile report in HTML format. The report lists all product tops processed by AutoConfig along with the total instantiation and execution time of the templates within them. A beta customer of
this feature helped us fix an indexing issue to allow AutoConfig to run in one third of the time.
The generated performance report allows you to drill down on each product top and view the following:
Source and target location of individual templates
Time consumed to instantiate or execute each template
Execution report for each template
Here’s a screenshot of the first few lines of the report:
A complete sample performance profiler report can be found here.
Identitying AutoConfig Performance Bottlenecks
This report is useful in analyzing the source of AutoConfig performance bottlenecks. It also helps administrators optimize template customizations (if any). For example, if you have performed customizations to the context variable values or to any of the
product templates and you find that AutoConfig is taking more time after the customization, you can use this feature and generate the profiler report to see where exactly the delay is occurring. The profiler report allows you to determine which phase or
product took more time to execute.
Then by further clicking on the link for that phase or product, you can see more details at the template level. Going through these details, you can determine which templates are taking an unreasonable amount of time for instantiation or execution. You can
use this to verify and optimize your customizations to the templates.
Generating AutoConfig Performance Profiler Reports
To generate the AutoConfig Performance Profiler report, you can run AutoConfig in ‘profile mode’ by issuing the following command:
Application Tier
perl $AD_TOP/bin/adconfig.pl contextfile=<CtxFile> [product=<product_top>] –profileDatabase Tier
perl $ORACLE_HOME/appsutil/bin/adconfig.pl contextfile=<CtxFile> –profilewhere
<CtxFile> is the absolute path to the context file
<product_top> is the Product short name
Note that the -profile option can be used alongside other AutoConfig command line parameters.
Downloading the Latest AutoConfig Engine
Customers on Oracle E-Business Suite Release 12 can obtain this new feature by installing:
Customers on 11i can get this new AutoConfig feature by installing:
Your Thoughts?
We would appreciate if you could share with us your experience on using this new feature. Please post your comments here or email your profiling results to Ivo Dumovic at:
![]()
We’re eager to hear about your thoughts about how we can improve this
feature.
References
- Using AutoConfig to Manage System Configurations with Oracle Applications 11i (Metalink Note 165195.1)
- Using AutoConfig to Manage System Configurations in Oracle E-Business Suite Release 12 (Metalink Note 387859.1)
Related Articles

