 As of version 23ai, Oracle GoldenGate exclusively supports a microservices architecture with a more elegant browser interface and REST services for configuration, operation and script automation. However, operating GoldenGate in a typical runtime environment for microservice architectures is not only a good fit thematically.
So why is GoldenGate so useful as a container running on kubernetes?
- A large number of GoldenGate installations that exchange data logs with each other can quickly arise: one installation per database type such as Postgres, Oracle, MySQL, SQL Server, DB2, BigData-type systems such as MongoDB, Kafka etc. is necessary due to the different drivers and extraction/application logic contained in each case. Perhaps you would also like to separate test environments from production environments? A much-promoted GoldenGate “Mesh” is not only useful across data center boundaries.
- The GoldenGate 23ai “free” edition comes with a very appealing wizard that performs all the necessary checks and settings for Oracle databases, such as database parameters, users and authorizations, checkpoint and heartbeat tables, etc. The “free” edition could be used in addition to “full use” installations for the initial setup of various Oracle databases.
- A recommended best practice “advanced” installation of GoldenGate is already prepared in each container and can be integrated into your own infrastructure. All GoldenGate microservices are grouped together in the container behind an nginx reverse proxy and SSL certificates are generated and set up in advance – with the option of easily replacing them with your own under Kubernetes. When the container is started, GoldenGate’s own “deployment” is set up automatically, i.e. the software installation is configured with default values and you can start setting up the data syncs straight away. All that remains is to enter the deployment name and an admin user with the desired password.
- From version 23ai onwards, it is technically much easier to run GoldenGate under Kubernetes. Older versions required the presence of swap memory and could not be started (completely) without it. Only newer Kubernetes versions (>=1.26) offer swap storage for the entrusted containers, but only as an experimental feature for the time being. The new GoldenGate 23ai version recognizes at startup if no swap is available and does not use it.
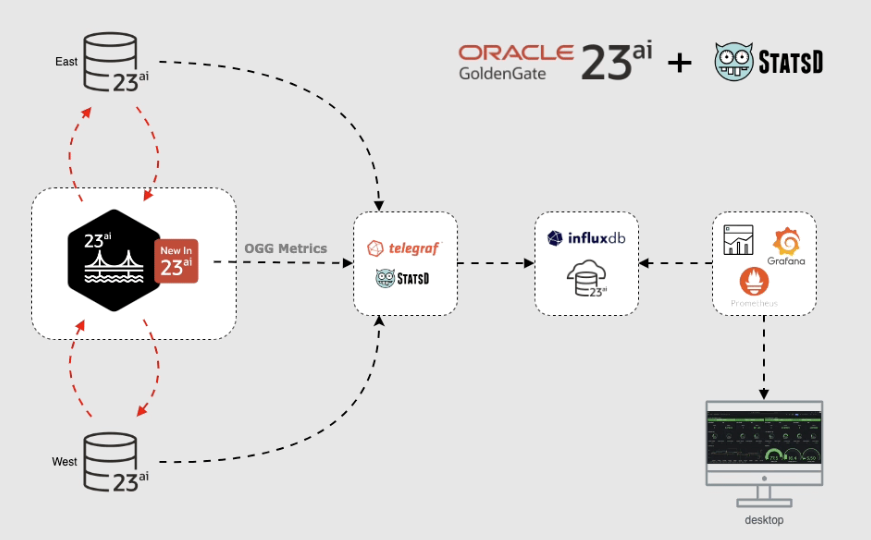
- Your Kubernetes cluster certainly uses a typical environment for monitoring containers operated in it. Usually based on Prometheus and Grafana or influxdb and Grafana. GoldenGate 23ai offers the option of exporting the metrics it already measures and thus merging them from an existing “mesh” into a more centralized monitoring system.
What do I need to do to run GoldenGate 23ai under Kubernetes?
An explanation with several examples:
- Create a container image with an “advanced” installation in it
- Define a Kubernetes deployment with persistent storage and network access
- Connect to a monitoring system, activate the metrics export
Create a container image with an “advanced” installation in it
Alternative 1: Oracle offers the GoldenGate “free” edition as a ready-to-use container image for download from the official Oracle Container Registry.
Please have a look at the corresponding website: https://container-registry.oracle.com/ords/ocr/ba/goldengate/goldengate-free
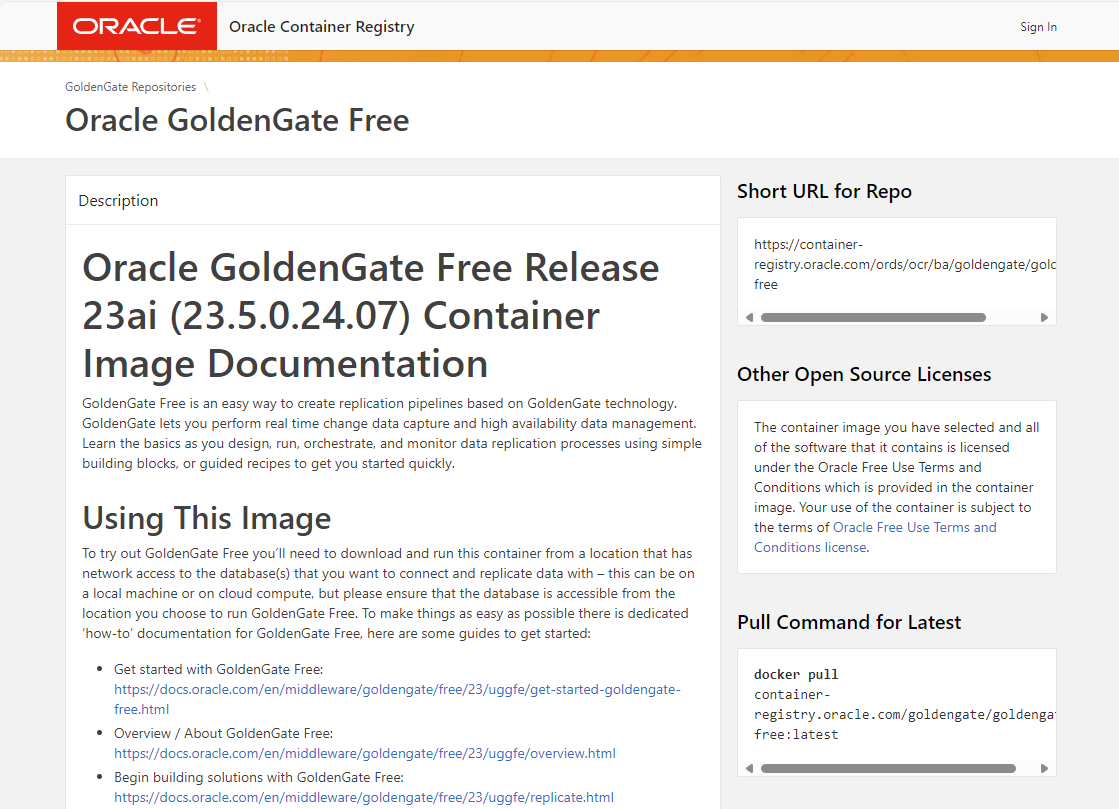
You can obtain the image directly from Oracle using the docker or podman “pull” command, or you can transfer this image to your own repository after the download.
You do not necessarily have to execute the following commands, as Kubernetes takes care of the “pull” for you. However, please make a note of the URLs for later.
# herunterladen
podman pull container-registry.oracle.com/goldengate/goldengate-free:latest
# umbenennen bzw. einen zusätzlichen tag anhängen
podman tag container-registry.oracle.com/goldengate/goldengate-free:latest my-internal-registry.fancy.name/goldengate/goldengate-free:latest
# hochladen
podman push my-internal-registry.fancy.name/goldengate/goldengate-free:latest
The “free use” license for GoldenGate free means that it can also be used productively free of charge, but only for Oracle databases that are no larger than 20 GB in total size, including all pluggable databases and the container database. But there is also the convenient wizard for setting up Oracle databases for GoldenGate! The wizard is described in more detail in this blog post.
Alternative 2:
Oracle offers official scripts to create your own docker images for GoldenGate. This can also be used to generate images for non-Oracle database accesses such as Postgres, DB2 etc.
First download the container build scripts for all possible Oracle products to a Linux system of your choice:
git clone https://github.com/oracle/docker-images
cd docker-images/OracleGoldenGate/23
In the current subdirectory “docker-images/OracleGoldenGate/23” you will find a README.md file with further instructions for creating the image and putting it into operation as a container. Without Kubernetes. But we’ll take care of that in a moment.
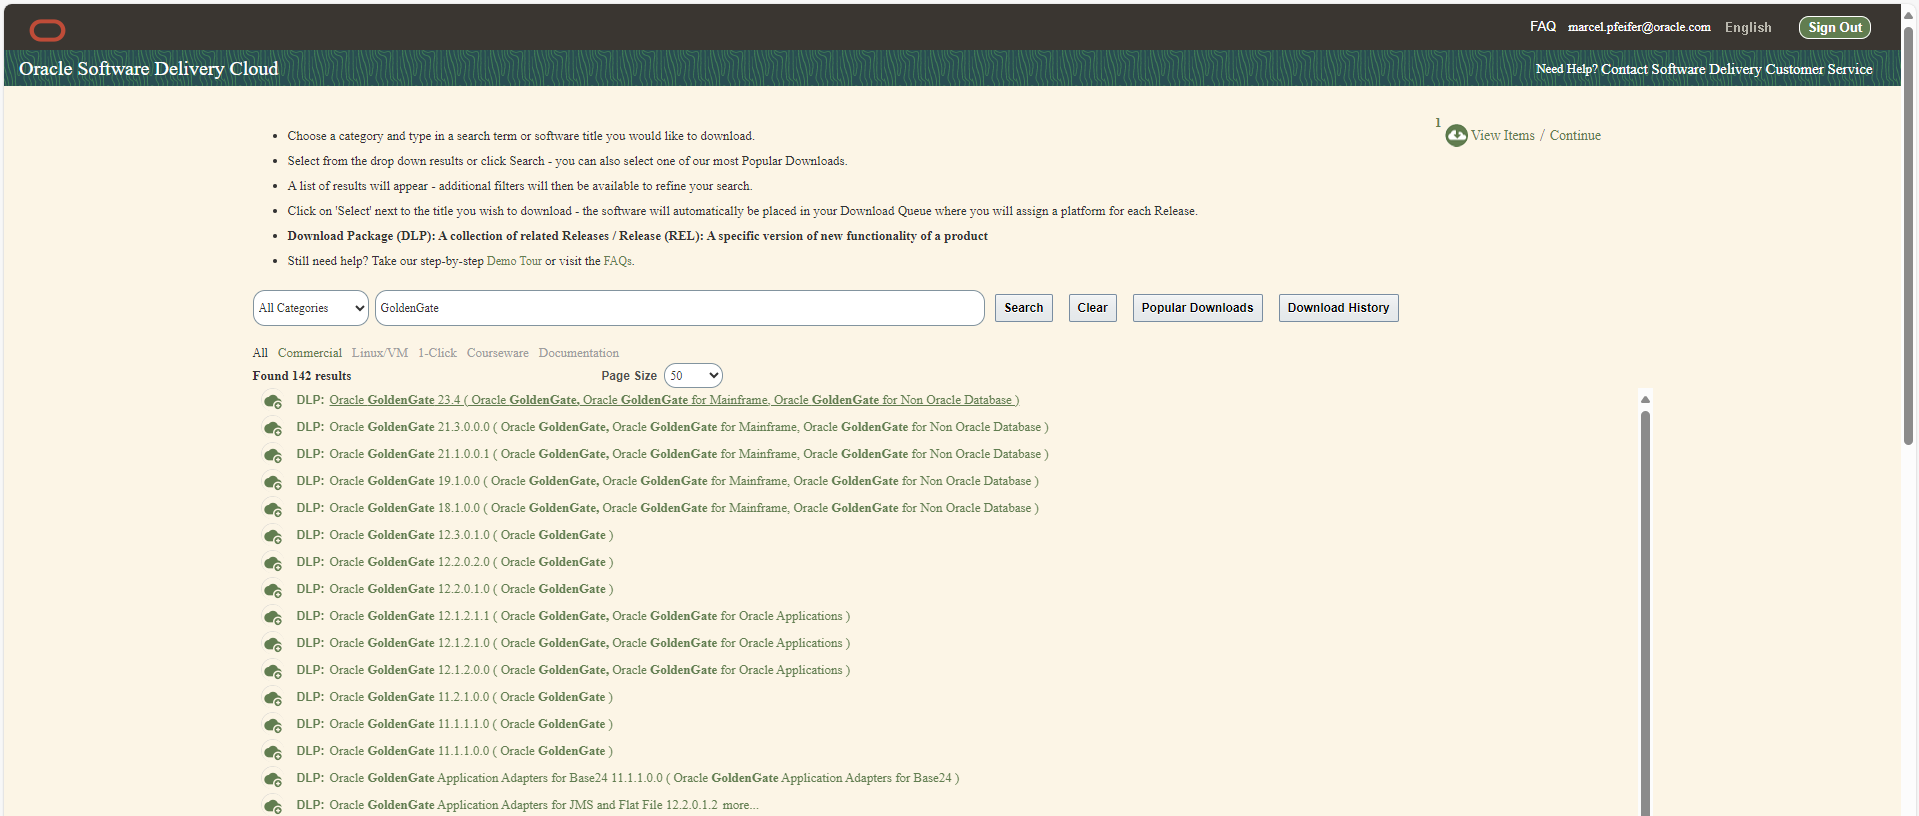
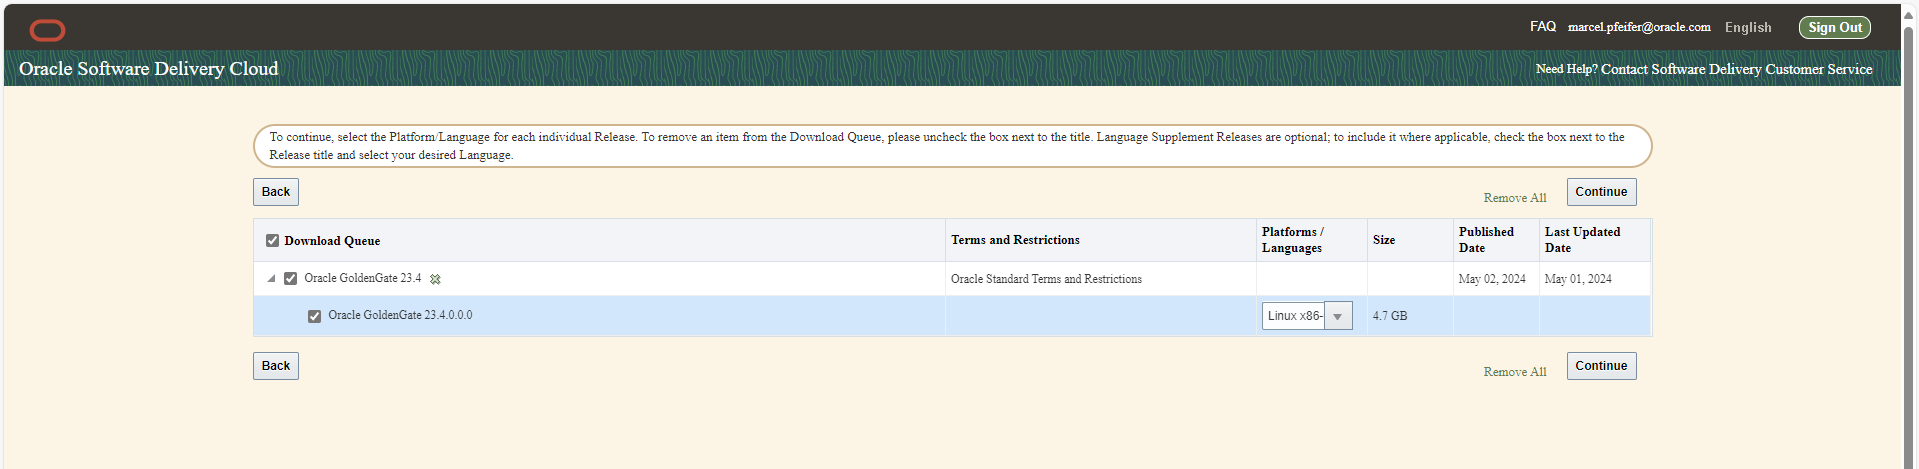
First download the desired GoldenGate software for Linux 64bit as a .zip file from edelivery.oracle.com – depending on whether you want a variant for Oracle, Postgres, DB2 etc.. Search for “GoldenGate” and then select version 23.4 , Linux 64bit, and your respective database system. GoldenGate for BigData(Kafka,MongoDB,Snowflake,…) already has version number 24.2.1 instead of 23 and is now called “GoldenGate for Distributed Applications and Analytics” ! Another article will follow about the new transaction manager microTX or otmm, which is also included.
The downloaded files have names such as V1041909-01.zip (=GG4Postgres) , V1042871-01.zip (=GG4Oracle) , V1043063-01.zip (=GG4MySQL) and so on.
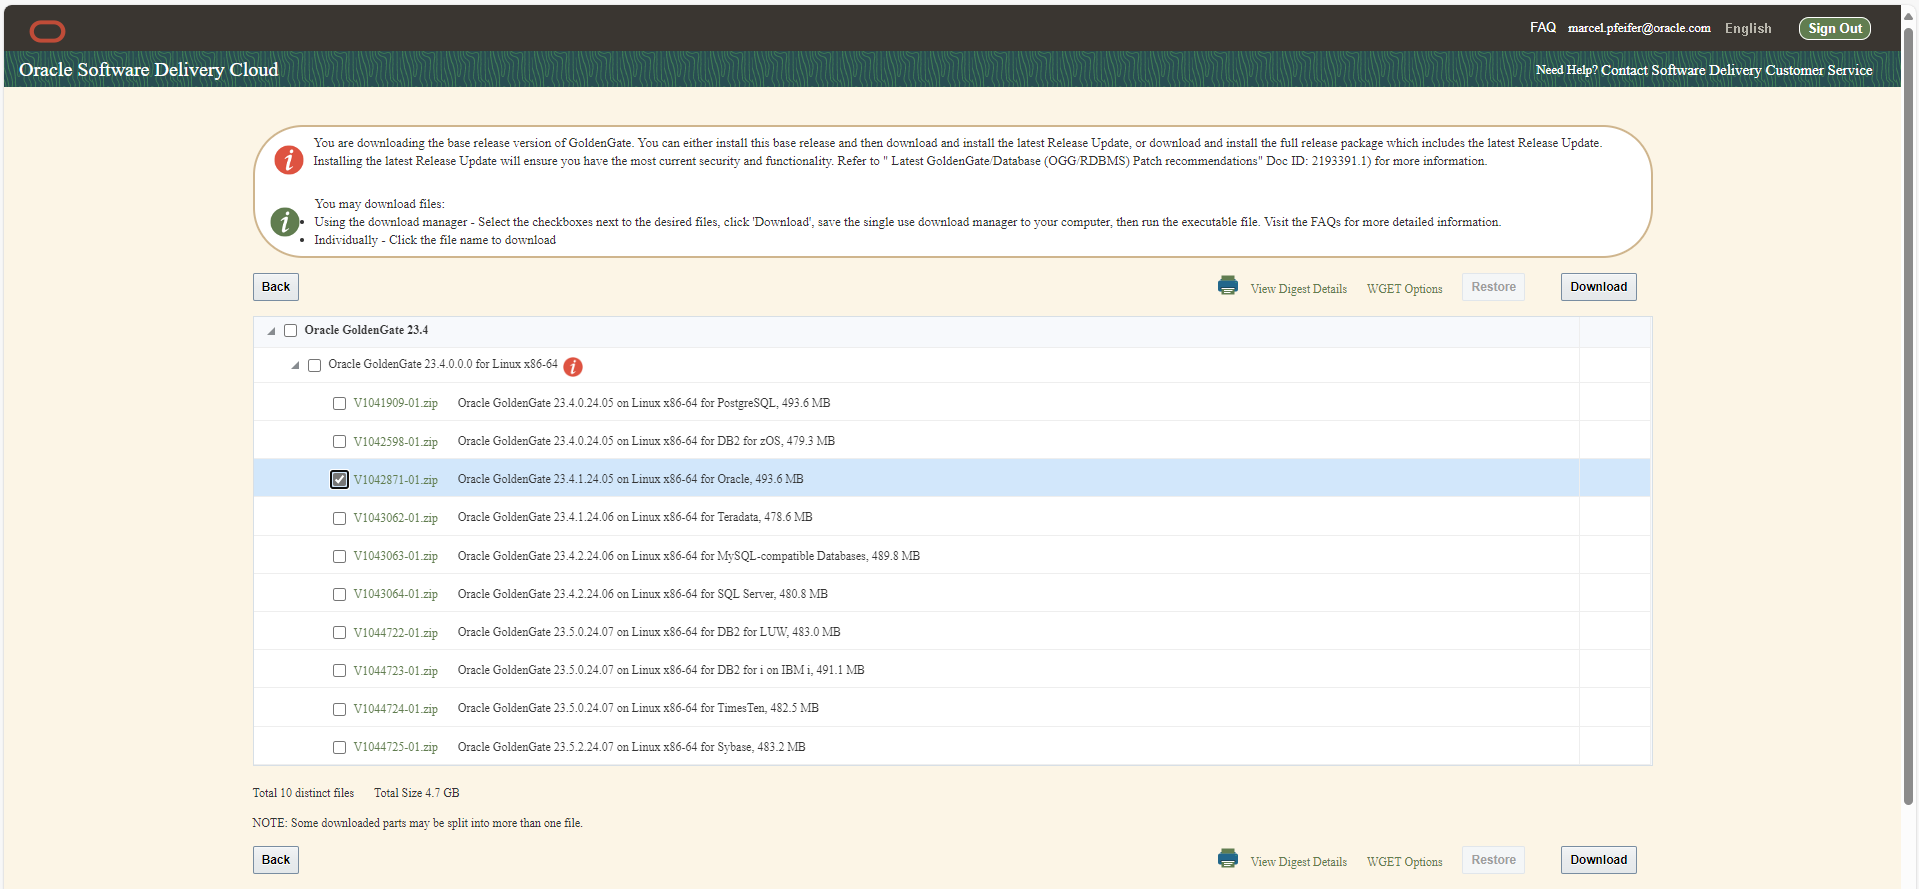
Leave the files as they are without unpacking them. Please make sure that your desired file is in the same directory as your working directory, which should be “docker-images/OracleGoldenGate/23”.
Now create the container image by specifying your downloaded desired zip as a parameter. Our example uses GoldenGate 23ai on Linux 64Bit for Oracle databases, i.e. V1042871-01.zip:
podman build --tag=oracle/goldengate_oracle:23.4 --build-arg INSTALLER=V1042871-01.zip .
And after a few minutes of software installation or image creation, upload it to your own repository, e.g. as follows:
podman tag oracle/goldengate_oracle:23.4 my-internal-registry.fancy.name/goldengate/goldengate_oracle:23.4
podman push my-internal-registry.fancy.name/goldengate/goldengate_oracle:23.4
Please take a look at the Dockerbuild file and the attached scripts. The GoldenGate software is executed within the container as the newly created user “ogg”, but the start scripts themselves are executed as root users to trigger additional processes such as nginx.
Done! You can now start one of the GoldenGate container images locally by using environment variables and volume mounts to configure a fully-fledged “advanced” installation. How to do this is described in the README.md in your working directory. But let’s go straight to a “real” runtime environment such as Kubernetes and try our hand there.
Define a Kubernetes deployment with persistent storage and network access
Information about the storage, environment variables and network is provided in YAML files, which you transfer to your Kubernetes cluster using “kubectl apply -f <filename>”.
Suggestion number one would be a deployment of the GoldenGate container and not just a single POD, e.g. to enable a rolling replacement of a running container with a newer version. The YAML file (e.g. “gg-deploy.yaml”) would look like this:
dsfsdfapiVersion: apps/v1
kind: Deployment
metadata:
  labels:
    app: goldengate_eastcoast
    instance: goldengate_oracle_23.4.0
  name: goldengate-oracle-eastcoast
  namespace: goldengate
spec:
  replicas: 1
  selector:
    matchLabels:
      app: goldengate_eastcoast
      instance: goldengate_oracle_23.4.0
  template:
    metadata:
      labels:
        app: goldengate_eastcoast
        instance: goldengate_oracle_23.4.0
    spec:
      containers:
      - env:
        - name: OGG_DEPLOYMENT
          value: EastCoastDeployment
        - name: OGG_ADMIN
          valueFrom:
            secretKeyRef:
              key: oggadmin
              name: ogg-admin-secret
        - name: OGG_ADMIN_PWD
          valueFrom:
            secretKeyRef:
              key: oggadminpwd
              name: ogg-admin-secret
        image: container-registry.oracle.com/goldengate/goldengate-free:latest
        imagePullPolicy: IfNotPresent
        name: app
        ports:
        - containerPort: 443
          name: ggate
          protocol: TCP
        volumeMounts:
        - mountPath: /u01/ogg/scripts
          name: u01
        - mountPath: /u02
          name: u02
        - mountPath: /u03
          name: u03
      volumes:
      - name: u01
        persistentVolumeClaim:
          claimName: ogg-oracle-eastcoast-u01-pvc
      - name: u02
        persistentVolumeClaim:
          claimName: ogg-oracle-eastcoast-u02-pvc
      - name: u03
        persistentVolumeClaim:
          claimName: ogg-oracle-eastcoast-u03-pvc
Explained in short, this means:
- The deployment takes place in the namespace “goldengate”. This means that it should be created first before this deployment is initiated.
- The official “free” image from container-registry.oracle.com is used as the container image.
- The desired name of the GoldenGate deployment is “EastCoastDeployment” and is transferred to the container via an environment variable.
- The desired user and their desired password are not specified directly, but come from a Kubernetes “Secret”.
- Kubernetes opens the SSL port 443 to the container, where the nginx reverse proxy is listening. This forwards internally to the running GoldenGate processes and sets HTTP headers as required. nginx terminates the SSL traffic, i.e. there are no certificates to be managed in and by GoldenGate. This is done by nginx and kubernetes.
- The directories /u01 , /u02 and /u03 are mounted as a volume. The configuration, log files, tnsnames.ora and sqlnet.ora are stored there on initial startup if required, and later the trail files for the database sync. Another volume can be included under /etc/nginx/cert, which refers to certificates stored and updated in Kubernetes. At the moment, however, we are working with self-signed certificates generated on-the-fly.
If we now issue the necessary commands to create the namespace and start the deployment…
kubectl create namespace goldengate
kubectl apply -f gg-deploy.yaml
// und prüfen, ob sich etwas tut
kubectl get pods -n goldengate
…then we realize that nothing seems to be happening, at least there is no running pod. Kubernetes is waiting for further information, because the password to be included via secret and the requested storage are still missing. You can see the corresponding messages in the event log: kubectl get events -n goldengate.
The Kubernetes Secret with desired password and desired user (let’s agree on the file name ogg-secret.yaml) could look like this. Kubernetes Secrets may also refer to external Key Vault solutions such as the Vault Service in the Oracle Cloud, Hashicorp Vault or others:
apiVersion: v1
kind: Secret
type: Opaque
metadata:
  name: ogg-admin-secret
  namespace: goldengate
stringData:
  oggadmin: oggadmin
  oggadminpwd: OGGadmin123!
Then we get three persistent volume claims so that Kubernetes creates the volumes, makes them available and attaches them to the deployment. The file name for this could be ogg-pvc.yaml:
apiVersion: v1
kind: PersistentVolumeClaim
metadata:
  name: ogg-oracle-eastcoast-u01-pvc
  namespace: goldengate
spec:
  accessModes:
  - ReadWriteOnce
  resources:
    requests:
      storage: 1Gi
  storageClassName: rook-ceph-block
---
apiVersion: v1
kind: PersistentVolumeClaim
metadata:
  name: ogg-oracle-eastcoast-u03-pvc
  namespace: goldengate
spec:
  accessModes:
  - ReadWriteOnce
  resources:
    requests:
      storage: 10Gi
  storageClassName: rook-ceph-block
---
apiVersion: v1
kind: PersistentVolumeClaim
metadata:
  name: ogg-oracle-eastcoast-u03-pvc
  namespace: goldengate
spec:
  accessModes:
  - ReadWriteOnce
  resources:
    requests:
      storage: 50Gi
  storageClassName: rook-ceph-block
The storage classes and sizes used here are open to discussion. If you omit the storage class specification, a default storage class is used if one is available. In my environment, there is a “rook-ceph-block” storage class, which refers to a fairly typical storage solution for OnPrem Kubernetes. In the Oracle Cloud, this would rather be “oracle-bv” (Oracle Block Volume) or there are several storage classes to choose from in your cluster, e.g. for slow and cheap or fast and expensive.
The size specifications should be sufficient. Above all, there must be enough space for the logs and, more importantly, the data sync trail files. A productive database often generates several gigabytes of sync data per hour, which must be multiplied by the desired storage time of the trail files (retention time, usually several days).
If you have not already done so, now is the time to send the two files and let Kubernetes do its work:
kubectl apply -f ogg-secret.yaml
kubectl apply -f ogg-pvc.yaml

kubectl get pvc -n goldengate
NAME                           STATUS   VOLUME                                     CAPACITY   ACCESS MODES   STORAGECLASS      AGE
ogg-oracle-eastcoast-u01-pvc   Bound    pvc-0cb3936a-b782-45a8-8487-728a91b71b4d   10Gi       RWO            rook-ceph-block   7d1h
ogg-oracle-eastcoast-u02-pvc   Bound    pvc-1c714fad-b6e1-49a0-9d52-3240a22a741a   10Gi       RWO            rook-ceph-block   7d1h
ogg-oracle-eastcoast-u03-pvc   Bound    pvc-9315996b-2ab3-4002-baf0-a61d3cb9d059   10Gi       RWO            rook-ceph-block   7d1h

kubectl get secret -n goldengate
NAME               TYPE     DATA   AGE
ogg-admin-secret   Opaque   2      7d1h

kubectl get deployment -n goldengate
NAME                          READY   UP-TO-DATE   AVAILABLE   AGE
goldengate-oracle-eastcoast   1/1     1            1           7d1h

# Problem-Suche z.B. mit
# kubectl get events -n goldengate
# falls der Download nicht klappt oder die Volumes nicht angelegt werden
So far, so good. The only thing missing is network access, because how do you access the GoldenGate REST services or the user interface with the browser?
Example method 1:
The seemingly brutal method is to request the current name of the running POD and tunnel port 443 to the local computer using “kubectl port-forward”. Good for a quick test, but usually nothing more:
> kubectl get pod -n goldengate
NAME                                           READY   STATUS      RESTARTS   AGE
goldengate-oracle-eastcoast-5f9ffcd5dd-5qtds   1/1     Running     0          31h

> kubectl port-forward goldengate-oracle-eastcoast-5f9ffcd5dd-5qtds -n goldengate 8443:443 &
Forwarding from 127.0.0.1:8443 -> 443
Forwarding from [::1]:8443 -> 443

> curl https://127.0.0.1:8443 --insecure
Handling connection for 8443
<html>
<head><title>302 Found</title></head>
<body>
<center><h1>302 Found</h1></center>
<hr><center>nginx/1.22.1</center>
</body>
</html>
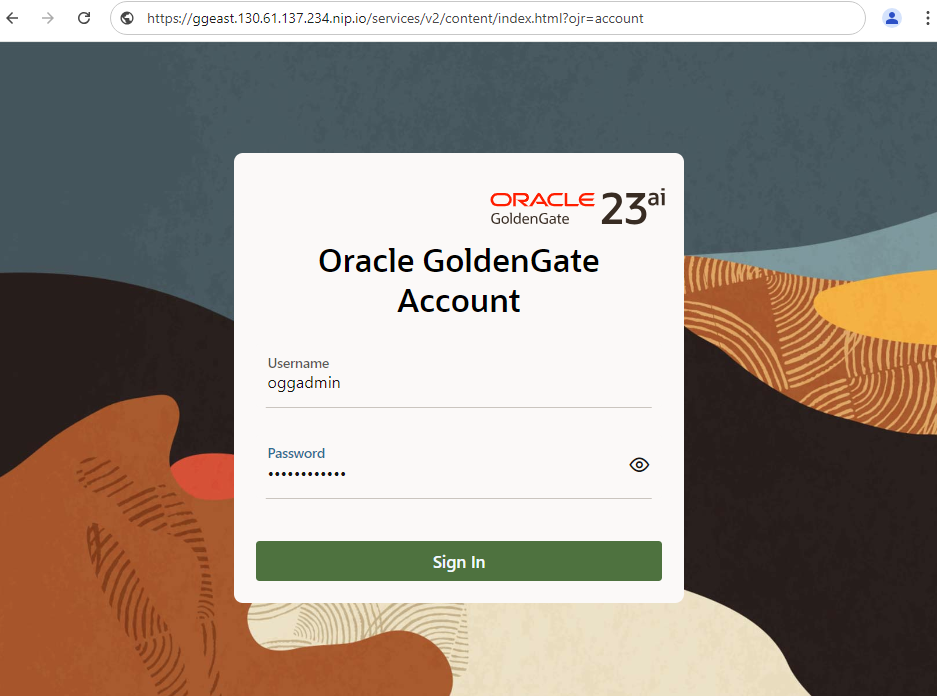
If this type of output appears, i.e. a forward generated by nginx within the GoldenGate container, then the access works in principle and you can access the same localhost URL with a local browser. You will then be redirected to the GoldenGate login page.
Example method 2:
There are several ways to make the GoldenGate UI permanently accessible via a browser. The basis is always a Kubernetes “Service” resource, which is responsible for port forwarding to the container and for name resolution in the Kubernetes internal network. If this service is of the “LoadBalancer” type, it receives a cluster-external IP address and can be addressed directly by a browser. This is what a corresponding service definition would look like:
apiVersion: v1
kind: Service
metadata:
  name: goldengate-oracle-eastcoast
  namespace: goldengate
spec:
  ports:
  - port: 8888
    protocol: TCP
    targetPort: 443
  selector:
    app: goldengate_eastcoast
    instance: goldengate_oracle_23.4.0
  type: LoadBalancer
The service opens port 8888 and forwards within the container to port 443, i.e. SSL encrypted. The certificates managed by nginx and generated by script are used (located under /etc/nginx/cert in the container). Port 80 would also be possible at the “targetPort” position, pure HTTP without encryption. The service defined here binds to all containers whose metadata corresponds to the information in the “selector” field (regardless of the host, internal IP address and number of replicas). With a “kubectl get service” command you receive the assigned internal and external IP addresses and can access them directly with your browser. It may take some time for an official IP address to be assigned. Until then, the external IP remains in PENDING status.
> kubectl get service goldengate-oracle-eastcoast -n goldengate
NAME                          TYPE         CLUSTER-IP      EXTERNAL-IP     PORT(S)    AGE
goldengate-oracle-eastcoast   LoadBalancer 10.104.101.13   130.61.137.234  8888/TCP   9d
Instead of pure IP addresses, resolvable name addresses of the .nip.io service are often used for text purposes. The external IP address 130.61.137.234 then becomes a not entirely arbitrary but more meaningful name such as ggeast.130.61.137.234.nip.io.
Example method 3:
However, a routing service is usually placed in front of the service for several good reasons. A gateway that only occupies a few IP addresses on the outside and forwards them to Kubernetes based on IP names and / or URIs to the respective containers, encrypts internal network traffic, terminates SSL, checks logins and inserts identities, enables network monitoring and much more. Network resources such as istio, nginx or others that act as providers for Kubernetes Ingress resources or offer their own routing implementations should be installed in your cluster in advance. Here is an example of a ClusterIP service that can be discussed but is not necessarily executable, which is forwarded to via an istio gateway. The routing configuration is done by creating an istio VirtualService.
apiVersion: v1
kind: Service
metadata:
  name: goldengate-oracle-eastcoast
  namespace: goldengate
spec:
  ports:
  - port: 8888
    protocol: TCP
    targetPort: 80
  selector:
    app: goldengate_eastcoast
    instance: goldengate_oracle_23.4.0
  type: ClusterIP
---
apiVersion: networking.istio.io/v1beta1
kind: VirtualService
metadata:
  name: goldengate-oracle-eastcoast
  namespace: goldengate
spec:
  gateways:
  - istio-system/http-istio-gateway
  hosts:
  - ggeast.141.147.33.99.nip.io
  http:
  - match:
    - uri:
        prefix: /
    route:
    - destination:
        host: goldengate-oracle-eastcoast
        port:
          number: 8888
In this example, the VirtualService relies on the fact that the istio gateway has received the external IP address 141.147.33.99 and uses this address for routing: all requests to the host name ggeast.141.147.33.99.nip.io are forwarded to the GoldenGate service, which has been entered here by name: goldengate-oracle-eastcoast.You are welcome to enter the external IP address of your istio ingress gateway in your environment. To find this out, simply call kubectl get service:
> kubectl get service -n istio-system
NAME                   TYPE           CLUSTER-IP       EXTERNAL-IP   PORT(S)                                                                      AGE
istio-egressgateway    ClusterIP      10.96.229.150    <none>        80/TCP,443/TCP,15443/TCP                                                     188d
istio-ingressgateway   LoadBalancer   10.105.6.214     141.147.33.99 15021:31062/TCP,80:31127/TCP,443:32163/TCP,15012:30128/TCP,15443:30106/TCP   188d
istiod                 ClusterIP      10.101.106.218   <none>        15010/TCP,15012/TCP,443/TCP,15014/TCP                                        188d
The istio gateway itself could take over SSL encryption and termination and forward all network traffic to the unencrypted port 80 in the GoldenGate container. In addition, istio enables transparent on-the-fly encryption of internal network traffic so that the individual containers do not have to take care of encryption themselves (called istio auto-injection). The example configuration of an istio gateway with SSL termination could look as follows:
kind: Gateway
  name: http-istio-gateway
  namespace: istio-system
spec:
  selector:
    istio: ingressgateway
  servers:
  - hosts:
    - '*'
    port:
      name: http
      number: 443
      protocol: HTTPS
    tls:
      credentialName: istio-tls
      mode: SIMPLE
Briefly explained, the istio gateway would respond to all requests on port 443 and communicate to the outside via HTTPS. The SSL certificates come from a Kubernetes “secret” called istio-tls and could be generated and updated by a kubernetes service such as cert-manager. Without further configuration such as suitable DestinationRules, this gateway would talk to unencrypted or on-the-fly encrypted containers.
Example method 4:
Newer Kubernetes versions offer their own ingress resource, which works in a similar way to an istio VirtualService in example method 3, except that you can also choose who implements the ingress – istio , nginx or another service. Here too is an example configuration that can be discussed and does not necessarily run in your environment. The same service is used as the basis as in example method 3, which also assumes an installation of the istio package. Instead of a VirtualService, an IngressClass and a state-of-the-art Kubernetes Ingress are defined here:
apiVersion: networking.k8s.io/v1
kind: IngressClass
metadata:
  name: istio
spec:
  controller: istio.io/ingress-controller
---
apiVersion: networking.k8s.io/v1
kind: Ingress
metadata:
  name: ingress
  namespace: goldengate
spec:
  ingressClassName: istio
  rules:
  - host: ggeast.141.147.33.99.nip.io
    http:
      paths:
      - path: /
        pathType: Prefix
        backend:
          service:
            name: goldengate-oracle-eastcoast
            port:
              number: 8888
---
apiVersion: v1
kind: Service
metadata:
  name: goldengate-oracle-eastcoast
  namespace: goldengate
spec:
  ports:
  - port: 8888
    protocol: TCP
    targetPort: 80
  selector:
    app: goldengate_eastcoast
    instance: goldengate_oracle_23.4.0
  type: ClusterIP
So much for the deployment and thus the connection of network and storage. If you wish, this is already the end of the article, because GoldenGate should now be running and accessible. The integration of GoldenGate with an identity management system such as the Oracle Identity Cloud (or conceivably also with keycloak) is a separate, more detailed topic and is described as an example in a blog by our GoldenGate P\product management. A GoldenGate Mesh installation and how GoldenGate containers connect to each other to exchange sync data is also part of another blog entry. But what still needs to be highlighted in any case: how can GoldenGate be integrated into a monitoring system typical for Kubernetes with Grafana, Prometheus and Co.
Connect GoldenGate to a (Kubernetes) monitoring system
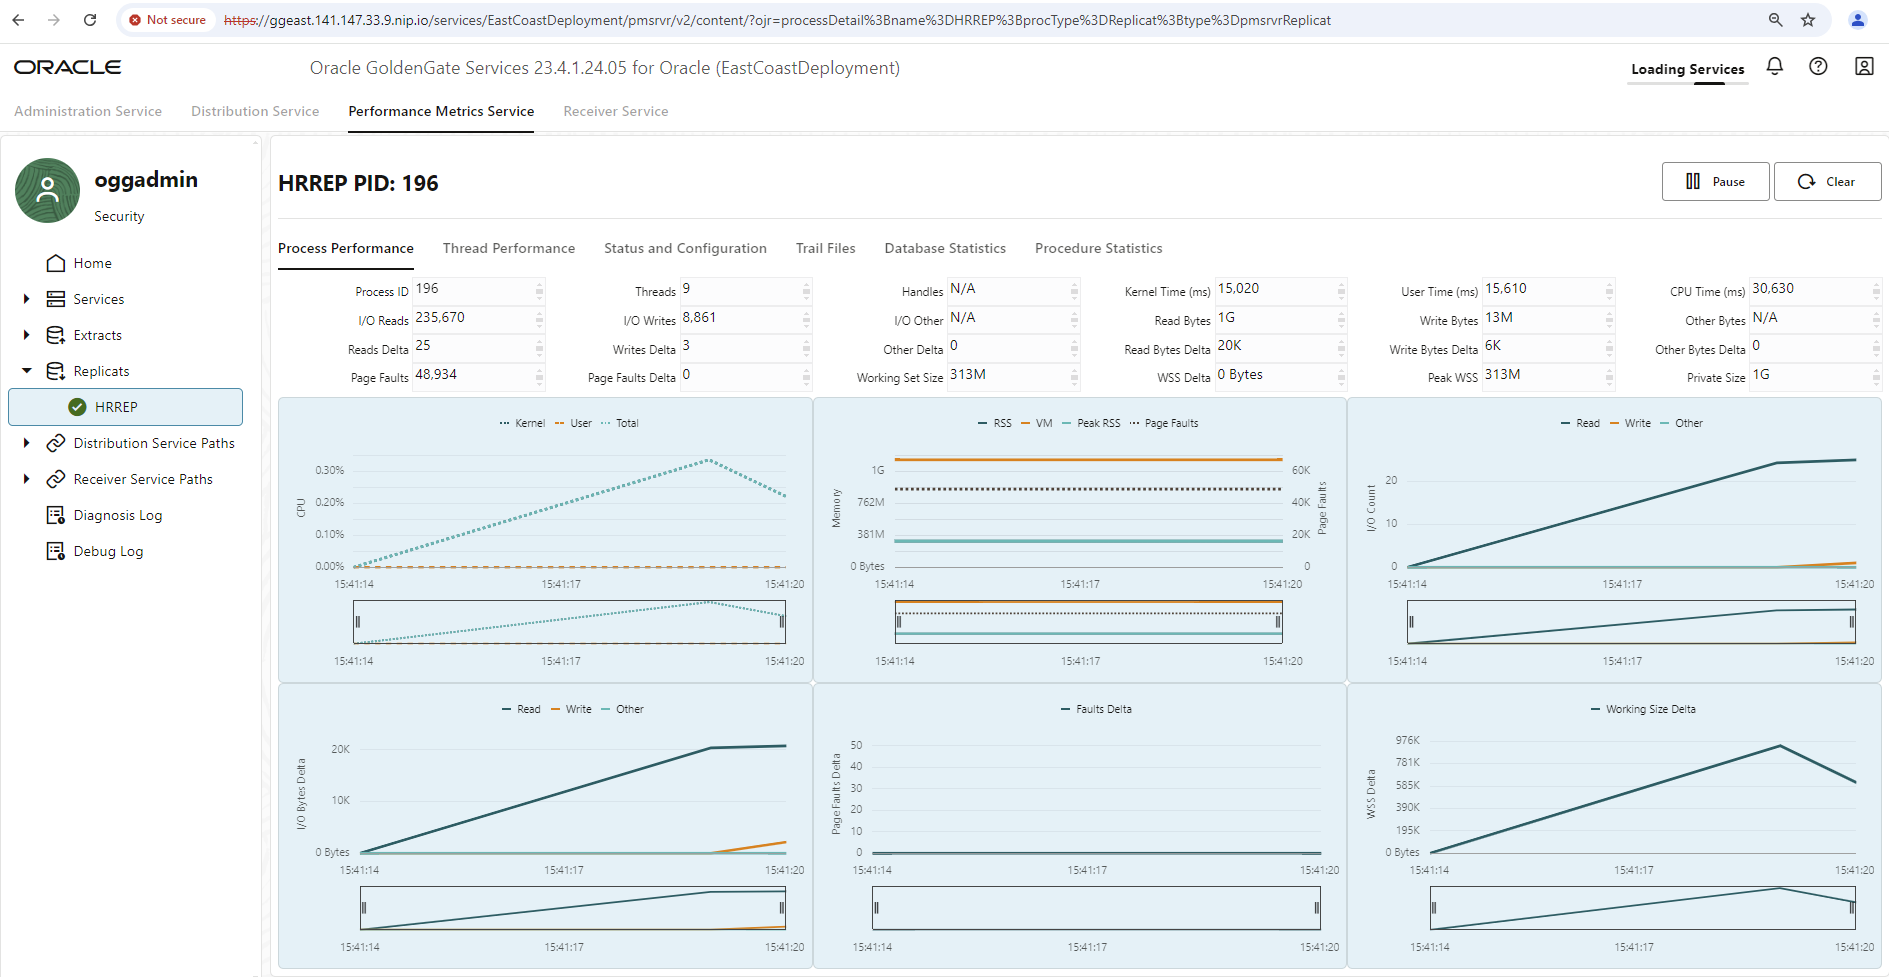
Every GoldenGate installation offers a performance metrics service embedded in the GoldenGate user interface. This shows comprehensive metrics on disk I/O, memory usage, network I/O, affected tables, data operations, lag of the data sync and much more. However, only current values or values since the user interface was called up can be viewed there – and only until the main memory of your JavaScript-enabled browser runs out or the HTTP session expires, whichever happens first.
To summarize all GoldenGate installations in a monitoring environment and to view historical data of the last few days, the integration of a monitoring environment is necessary and is of course supported by GoldenGate. To transfer all its metrics to an external monitoring system, only a small additional configuration entry is required.
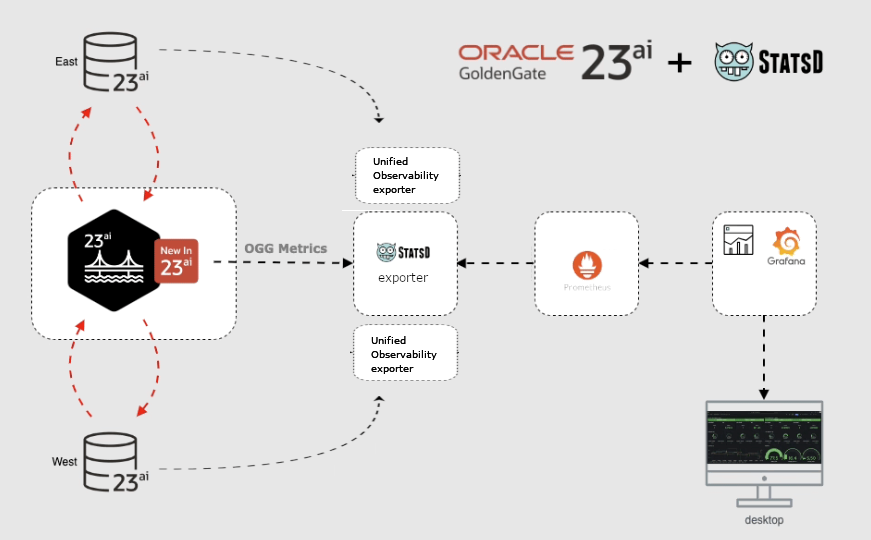
The metrics format here is “statsd”, the metrics are sent via UDP protocol to a named container that can handle the format. For example, “influxDB” is a database engine with a plugin for statsd data (telegraf) and an interface to the Grafana analysis tool. This way is explained in a blog entry of our GoldenGate Product Management. Our following example follows a very similar path, but via the more classic variant with a Prometheus database, Grafana and an automatic converter from statsd format to Prometheus format (statsd-exporter, part of the Prometheus project).
In principle, a GoldenGate configuration with its artifacts such as extracts, replicats, connections, distribution paths, etc. can be automated and scripted via REST service calls. Such a REST service call is also necessary to subsequently activate the metrics export. First, we read out the existing configuration including metrics handling. Depending on the selected network connection, please adjust the URL used accordingly. The call path remains the same, including the deployment name. The user name and password should also differ from your selected environment:
> curl https://ggeast.141.147.33.99.nip.io/services/v2/deployments/EastCoastDeployment --insecure --user "oggadmin:OGGadmin123!"|jq
...
... jede Menge Output, aber auch Angaben zu Metriken wie:
    "metrics": {
      "servers": [
        {
          "protocol": "uds",
          "socket": "PMSERVER.s",
          "type": "pmsrvr"
        }
      ],
      "enabled": true
    },
...
...
Copy the metrics part of the JSON document and create a new document in which you enter the name of a metrics service to be installed (statsd-exporter-service) and change the curl call to a PATCH statement to reconfigure the GoldenGate server. The REST service call to be sent now looks something like this:
curl -X PATCH \
       https://ggeast.141.147.33.99.nip.io/services/v2/deployments/EastCoastDeployment \
       --user oggadmin:OGGadmin123!   \
       --insecure \
       -H 'Cache-Control: no-cache' \
       -d '{
    "metrics": {
      "servers": [
        {
          "protocol": "uds",
          "socket": "PMSERVER.s",
          "type": "pmsrvr"
        },
        {
           "type":"statsd",
           "host":"statsd-exporter-service"
        }
      ],
      "enabled": true
    }
   }'
Now restart the GoldenGate container by deleting the POD. Kubernetes will automatically restart a new POD.
> kubectl get pods -n goldengate
NAME                                           READY   STATUS      RESTARTS   AGE
goldengate-oracle-eastcoast-5f9ffcd5dd-5qtds   1/1     Running     1          4d6h

> kubectl delete pod goldengate-oracle-eastcoast-5f9ffcd5dd-5qtds -n goldengate
> kubectl get pods -n goldengate
NAME                                           READY   STATUS      RESTARTS   AGE
goldengate-oracle-eastcoast-5f9ffcd5dd-54f7t   1/1     Running     0          6s
Without any further information, GoldenGate now sends its metrics to the Kubernetes service statsd-exporter-service via UDP protocol on port 8125. The fact that no container is listening at this address does not matter and does not generate any errors – this type of tolerance is typical for the UDP protocol. Now let’s make sure that the statsd-exporter is installed and that it receives the metrics.
A separate Kubernetes deployment is conceivable for tests. Later it makes more sense if the statsd-exporter is set up as a so-called sidecar and thus becomes part of the GoldenGate POD.
The following deployment and associated service are conceivable:
apiVersion: apps/v1
kind: Deployment
metadata:
  labels:
    app.kubernetes.io/instance: statsd-exporter
    app.kubernetes.io/name: statsd-exporter-prometheus
  name: statsd-exporter-prometheus
  namespace: goldengate
spec:
  replicas: 1
  selector:
    matchLabels:
      app.kubernetes.io/instance: statsd-exporter
      app.kubernetes.io/name: statsd-exporter-prometheus
  template:
    metadata:
      labels:
        app.kubernetes.io/instance: statsd-exporter
        app.kubernetes.io/name: statsd-exporter-prometheus
    spec:
      containers:
      - image: docker.io/prom/statsd-exporter:latest
        imagePullPolicy: Always
        args: ["--statsd.mapping-config", "/config/statsd-mapping.yaml", "--log.level", "debug"]
        name: app
        ports:
        - containerPort: 9102
          name: http
          protocol: TCP
        - containerPort: 9125
          name: push
          protocol: UDP
        volumeMounts:
        - mountPath: /config
          name: config
      volumes:
      - name: config
        configMap:
          defaultMode: 420
          name: statsd-mapping-config
---
apiVersion: v1
kind: Service
metadata:
  labels:
    app.kubernetes.io/instance: statsd-exporter
    app.kubernetes.io/name: statsd-exporter-prometheus-service
    app: gg23ai-east
  name: statsd-exporter-service
  namespace: goldengate
spec:
  ports:
  - port: 8125
    protocol: UDP
    targetPort: 9125
    name: push
  - port: 9102
    protocol: TCP
    targetPort: 9102
    name: http
  selector:
    app.kubernetes.io/instance: statsd-exporter
    app.kubernetes.io/name: statsd-exporter-prometheus
  type: ClusterIP
The standard statsd-exporter container listens (internally) on UDP port 9125, GoldenGate sends its metrics to port 8125 by default. The service definition links the two ports together. The specified debug log level parameter can be removed later. First, however, it is important to see whether metrics from GoldenGate arrive in the container at all.
Another file is missing (in a so-called ConfigMap with the name statsd-mapping-config) with normally unnecessary information for renaming or mapping the metric data into your own desired format. However, the default is prometheus as the target format. Ideally, the metrics should still have the same name and function as listed in the GoldenGate documentation für statsd metrics. Nevertheless, let’s provide an admittedly quite empty configuration file with some comments as an example:
apiVersion: v1
kind: ConfigMap
metadata:
  name: statsd-mapping-config
  namespace: goldengate
data:
  statsd-mapping.yaml: |+
    mappings:
    #- match: "statistics-replicat.*"
    #  name: "gg_statistics_replicat"
    #  labels:
    #      type: "$1"
    #- match: "receiver-service-stats.*"
    #  name: "gg_statistics_recsrvc"
    #  labels:
    #      type: "$1"
If both YAML configurations (with deployment, internal service and ConfigMap) have now been transferred to your Kubernetes cluster using the “kubectl apply” call, you can check whether the container is starting and whether metrics are already arriving:
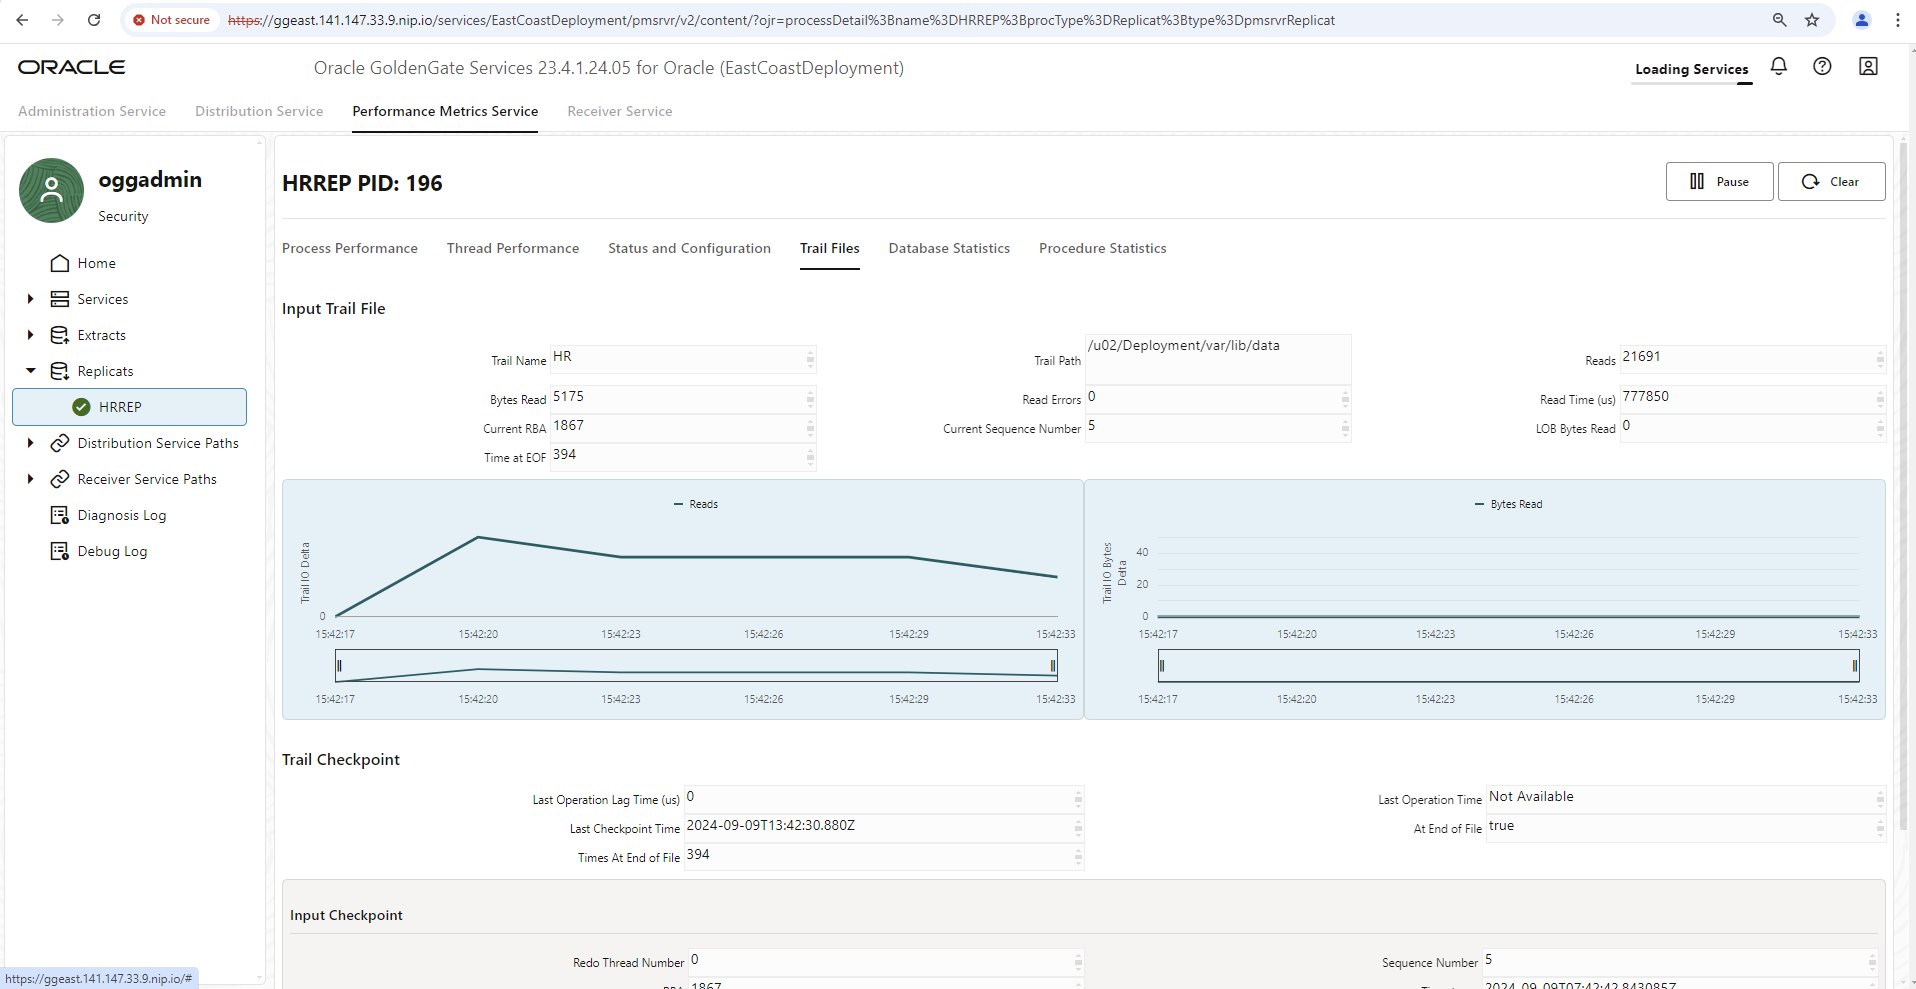
> kubectl get pods -n goldengate
NAME                                           READY   STATUS      RESTARTS   AGE
goldengate-oracle-eastcoast-5f9ffcd5dd-5qtds   1/1     Running     1          4d7h
statsd-exporter-prometheus-845d75f7df-j9hbg    1/1     Running     1          4d6h

> kubectl logs statsd-exporter-prometheus-845d75f7df-j9hbg -n goldengate
...
ts=2024-09-09T15:38:16.242Z caller=listener.go:97 level=debug msg="Incoming line" proto=udp line="trail-input.io-read-count,deploymentName=EastCoastDeployment,deploymentId=7a56bbeb-3db4-4242-9420-6968e18c55a0,processType=replicat,processName=HRREP,trail-name=HR,trail-path=/u02/Deployment/var/lib/data:28556|g"
ts=2024-09-09T15:38:16.242Z caller=listener.go:97 level=debug msg="Incoming line" proto=udp line="trail-input.io-read-bytes,deploymentName=EastCoastDeployment,deploymentId=7a56bbeb-3db4-4242-9420-6968e18c55a0,processType=replicat,processName=HRREP,trail-name=HR,trail-path=/u02/Deployment/var/lib/data:6211|g"
ts=2024-09-09T15:38:16.242Z caller=listener.go:97 level=debug msg="Incoming line" proto=udp line="trail-input.trail-read-errors,deploymentName=EastCoastDeployment,deploymentId=7a56bbeb-3db4-4242-9420-6968e18c55a0,processType=replicat,processName=HRREP,trail-name=HR,trail-path=/u02/Deployment/var/lib/data:0|g"
ts=2024-09-09T15:38:16.242Z caller=listener.go:97 level=debug msg="Incoming line" proto=udp line="trail-input.trail-times-at-eof,deploymentName=EastCoastDeployment,deploymentId=7a56bbeb-3db4-4242-9420-6968e18c55a0,processType=replicat,processName=HRREP,trail-name=HR,trail-path=/u02/Deployment/var/lib/data:28551|g"
ts=2024-09-09T15:38:16.242Z caller=listener.go:97 level=debug msg="Incoming line" proto=udp line="trail-input.trail-lob-bytes,deploymentName=EastCoastDeployment,deploymentId=7a56bbeb-3db4-4242-9420-6968e18c55a0,processType=replicat,processName=HRREP,trail-name=HR,trail-path=/u02/Deployment/var/lib/data:0|g"
...
The log entries just shown come from an already set up, running sync process HRREP with Trail HR. Your log should at least contain CPU information and values for the basic services adminsrvr, distsrvr and so on. The statsd-exporter opens port 9102 to deliver the collected metrics via HTTP call (URI path /metrics). This is exactly the interface that Prometheus needs for its scraping process. If you have set up Prometheus as a Kubernetes resource in your environment, you do not need to feed any scraping configuration files with information, but a typical ServiceMonitor resource with information on how the statsd-exporter scraping should take place is sufficient. This would look something like this:
apiVersion: monitoring.coreos.com/v1
kind: ServiceMonitor
metadata:
  labels:
    app: gg23ai-east
    release: prometheus
  name: goldengate-east-monitor
  namespace: goldengate
spec:
  endpoints:
    - bearerTokenSecret:
        key: ''
      interval: 20s
      port: http
      relabelings:
        - action: replace
          sourceLabels:
            - __meta_kubernetes_endpoints_label_app
          targetLabel: instance
  namespaceSelector: {}
  selector:
    matchLabels:
      app.kubernetes.io/instance: statsd-exporter
      app.kubernetes.io/name: statsd-exporter-prometheus-service
Some optional specifications have been made here that may differ from your environment. For example, in my chosen Prometheus installation, any ServiceMonitor must have the metadata “release: prometheus” or it will be ignored. The scraping interval, i.e. how often the metrics are queried by Prometheus, is 20 seconds and instead of entering a container name for the queried object in the Prometheus database (a label called instance), the value gg23ai-east from the metadatum app is used.
After “kubectl apply” the metrics should now also arrive in your Prometheus installation.
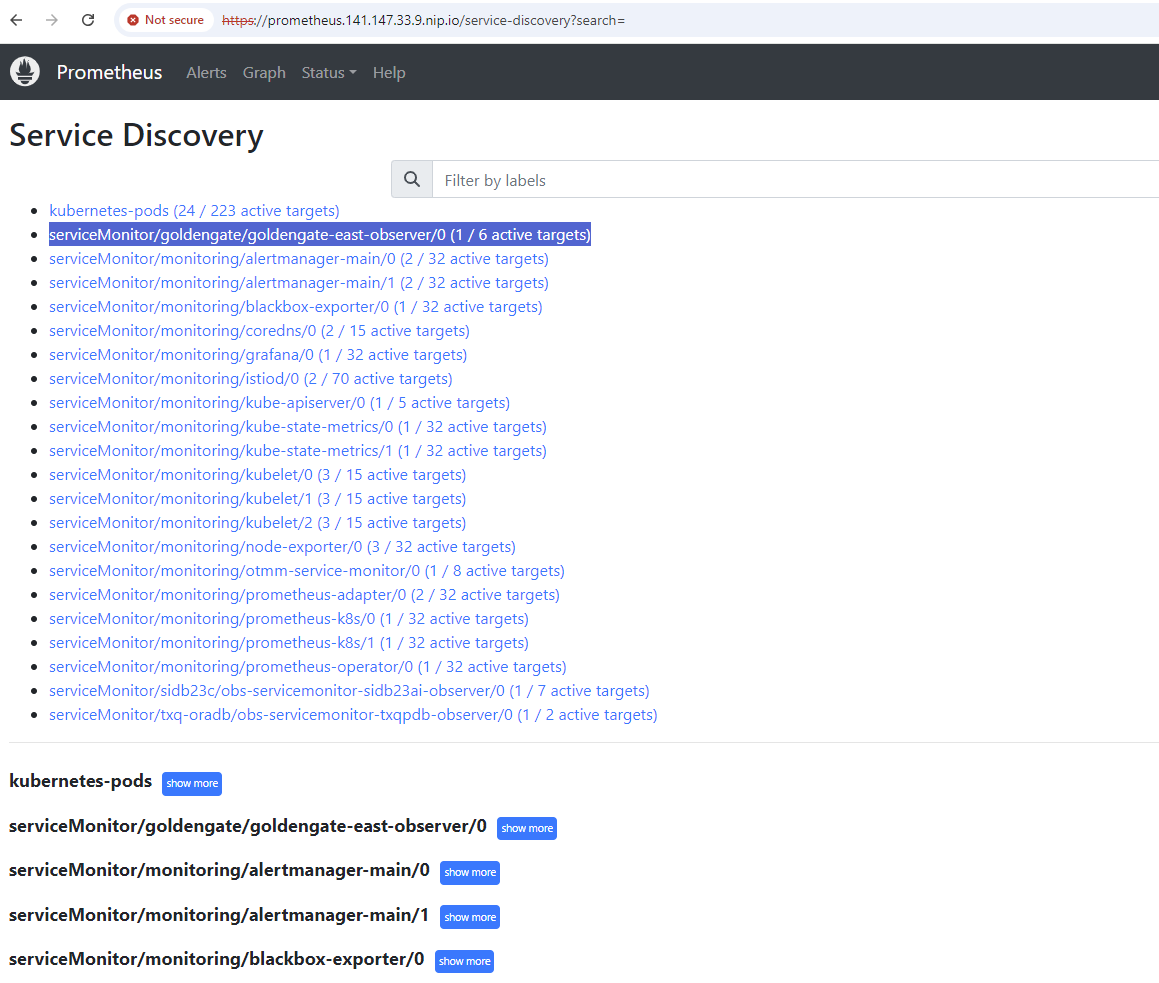
Is the ServiceMonitor integrated? A look at Your Prometheus – Status – Service Discovery will help here:
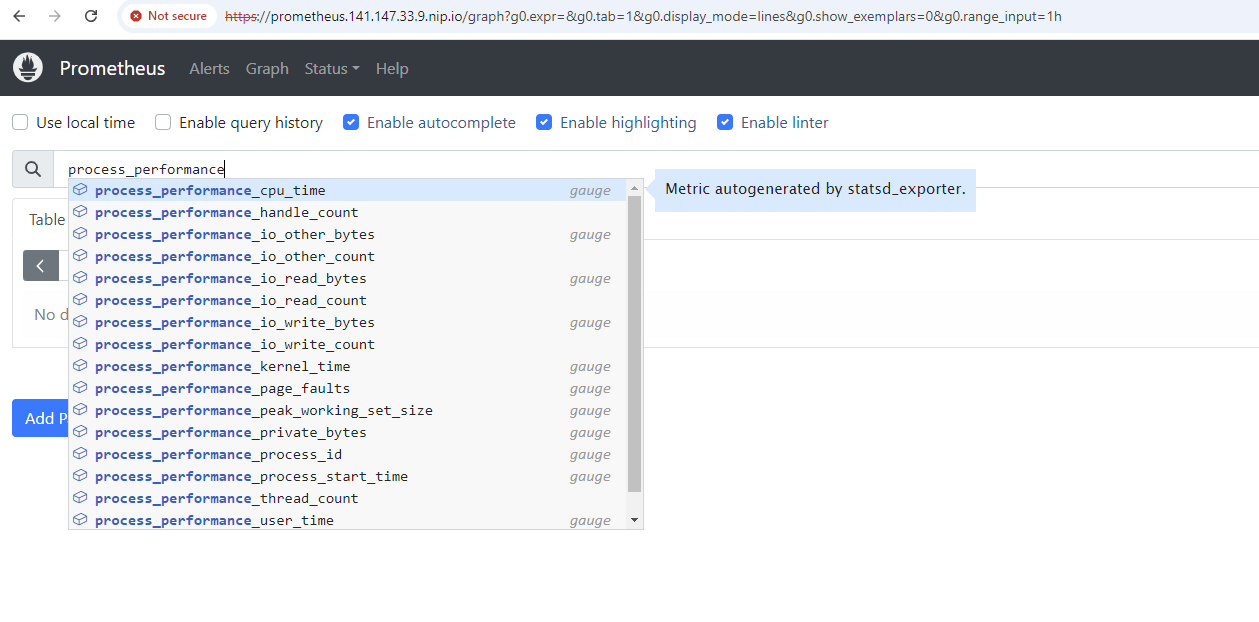
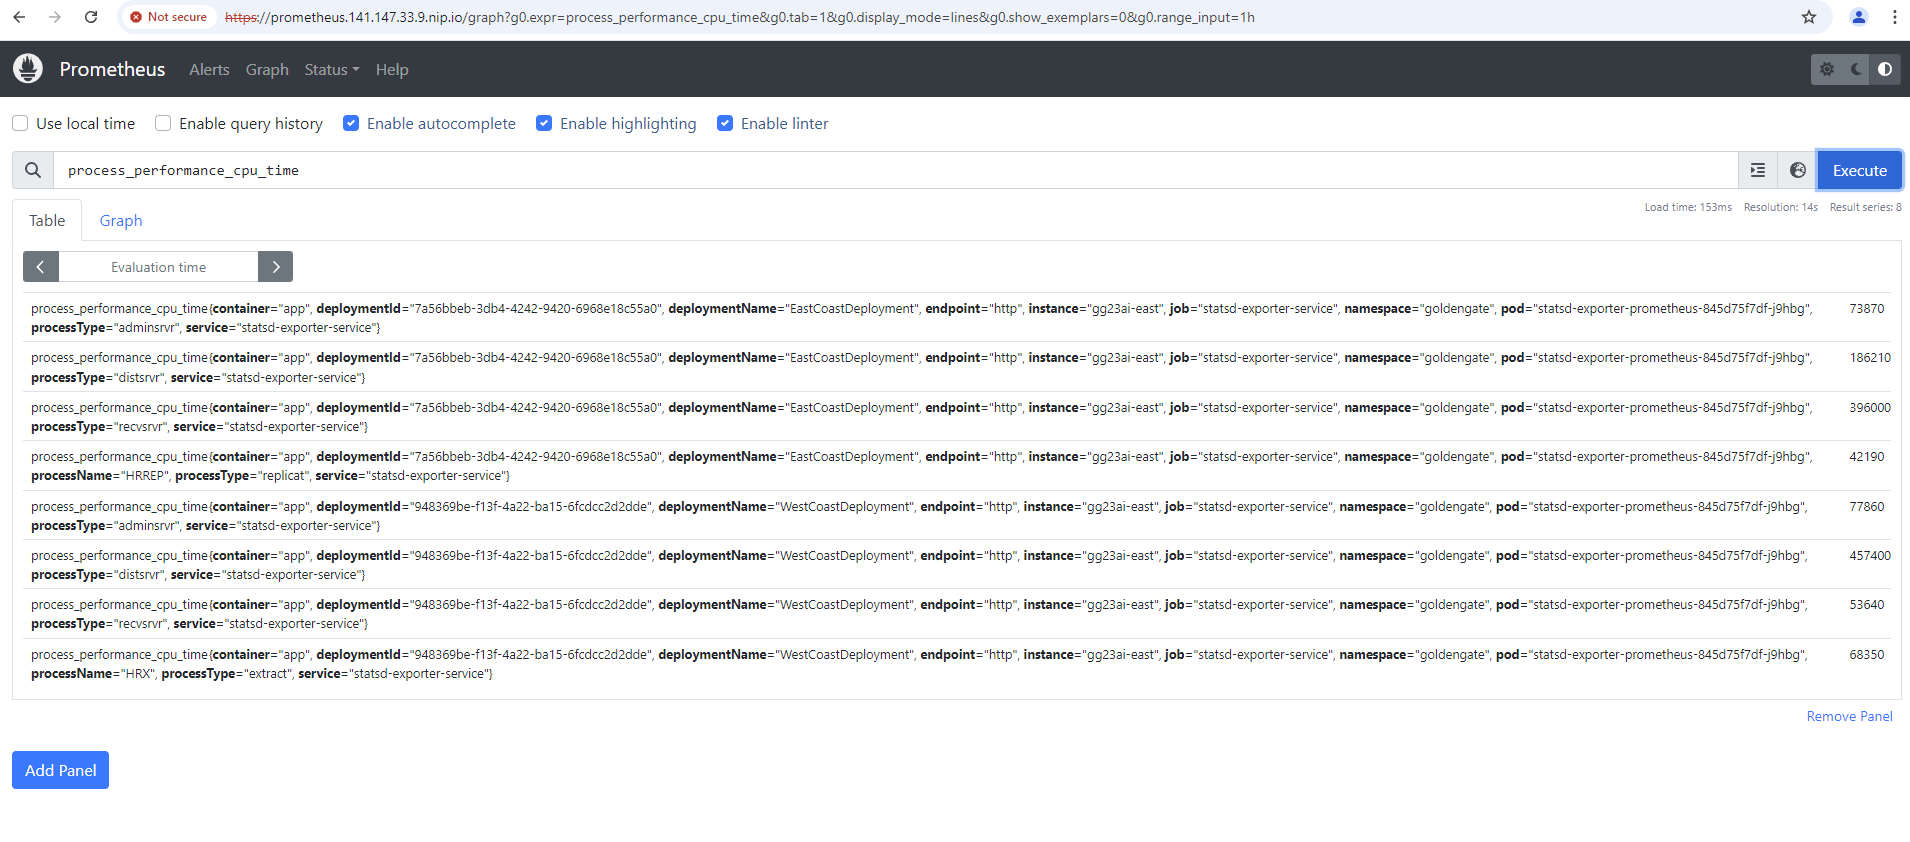
Are typical GoldenGate metrics recognizable? A quick search via the “Graph” menu should return results. For example, by searching for the metric process_performance_cpu_time:
Once this has worked, any dashboards can now be created in Grafana to view the metrics historically and group them by installation, for example. There are no official Grafana dashboards for GoldenGate available for download, but you are welcome to import a small self-created dashboard into your environment for a quick test and as an example (in Grafana: Dashboards – New Button – import – upload JSON file).
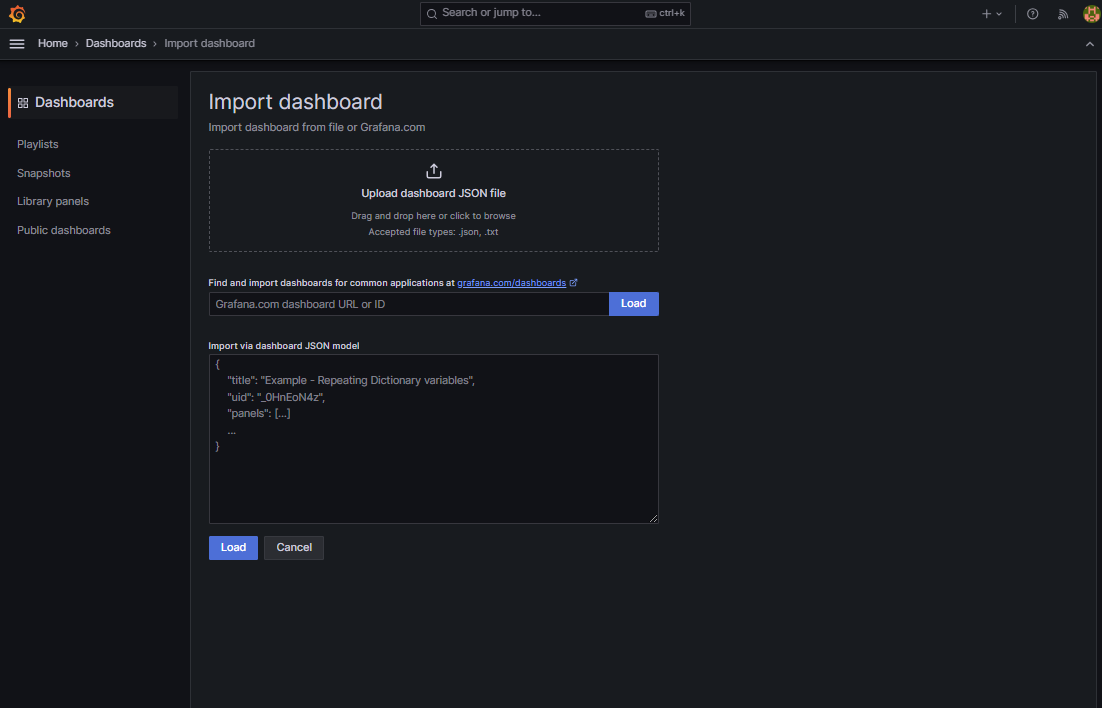
The dashboard is located in a public github repository together with many of the YAML files explained here.
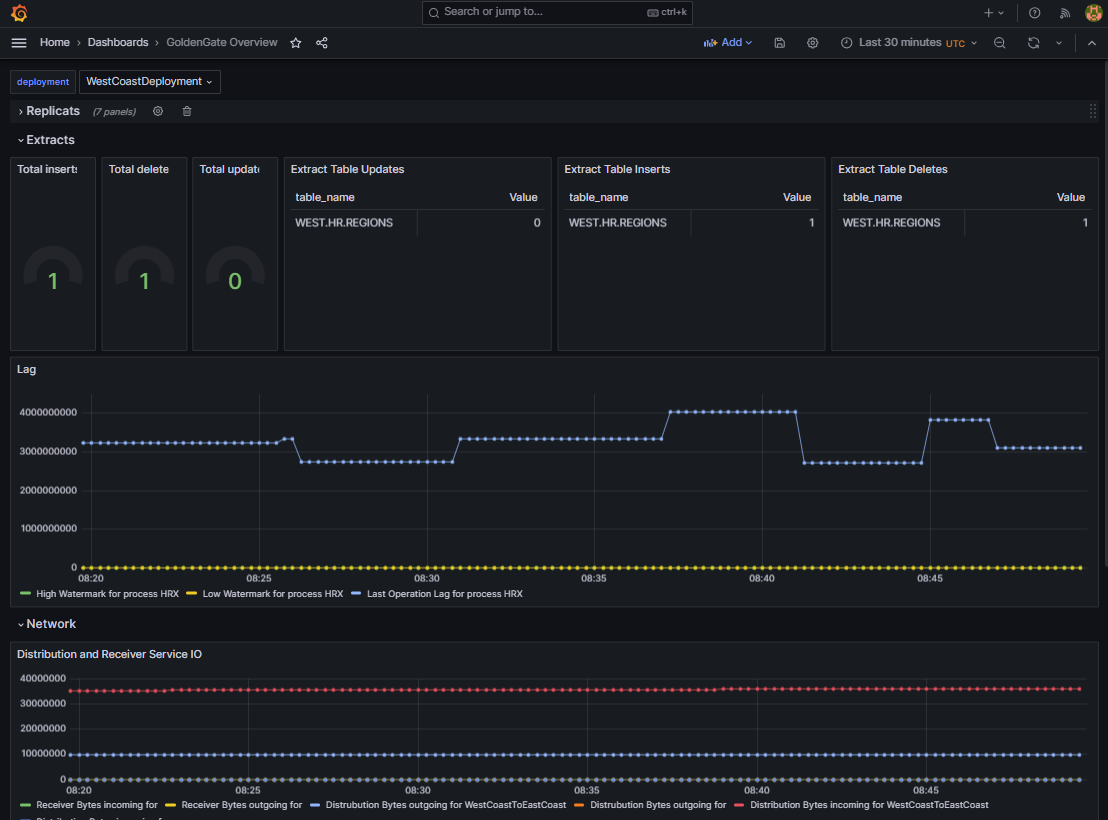
If everything has worked, you will see the following or something similar once a data sync has been set up:
Conclusion:
GoldenGate environments in Kubernetes can be set up, configured and discarded particularly quickly, and not just for testing and training. GoldenGate in the container is an “advanced” installation with nginx reverse proxy and SSL termination with the option of integrating certificates natively in Kubernetes, setting up the very important network accesses as required and combining all deployments in a native monitoring environment. Further topics remain open, such as linking the GoldenGate installations with a Single SignOn service and linking the GoldenGate installations with each other via so-called distribution paths. Nevertheless, you are welcome to view our numerous instructional videos and free courses to set up and test data syncs for numerous scenarios such as data center and cloud migrations, warehouse populations, disaster recovery and much more. We have prepared some links for you:
GoldenGate Product Management on youtube
Oracle Learning about GoldenGate on youtube – e.g. getting started
Oracle LiveLabs on GoldenGate active-active sync
GoldenGate statsd Monitoring howto (incl. Grafana Dashboard for influxdb on github)
GoldenGate nginx reverse proxy setup
Example YAMLs and Grafana dashboard of this blog post
And as always: have much fun trying and testing!