Contributors: Chris Gurley, Santiago Bravo
OCI Ops Insights (OPSI), part of the Oracle Cloud Observability and Management platform, is a solution that helps you gather, analyze, and plan for enterprise growth. It helps you perform data-driven capacity planning and performance management thereby reducing enterprise capital expenditure and improving applications throughput. As we continue to introduce more capabilities and improve the OPSI experience, this blog highlights key additions in the last few months.
New service name
Existing and new potential customers may notice a change in service name when accessing OPSI product pages. The OCI “Operations Insights” service is now called “Ops Insights”. This change was introduced to align better with the industry term IT Operations (ITOps). Ops Insights enables ITOps management professionals to optimize the performance of IT and business technologies as well as growth plans, with an ultimate goal of continuous, uninterrupted operations.
RAC-enabled private endpoint updates
When leveraging OPSI’s Private Endpoint support for Oracle Base Database and Exadata on Dedicated Infrastructure (ExaDB-D) databases, the default of a single RAC-enabled PE per tenancy, per region, has been a pain point. This constraint required limit increases which lead to delays in onboarding. As of December 15th, 2023, normal private endpoints can be used for both RAC Oracle Based Databases and ExaDB-D. This also eliminates the limit of 15 SCAN listeners per private endpoint. If you already have an existing private endpoint that was previously RAC-enabled, it will continue to work without disruption, but going forward OPSI private endpoints for the aforementioned databases should be created without designating for “RAC”. To learn more, visit Create a private endpoint.
AWR Hub Explorer of performance statistics
AWR Hub Explorer is a feature recently released within AWR Hub that allows exploration of AWR’s performance statistics. Now utilizing SQL queries to extract AWR_PDB_* views data to create intuitive visualizations. Some of the features within AWR Hub Explorer include:
- Author SQL queries against well renowned AWR’s AWR_PDB_* views to analyze database performance data
- These views are more performant and better suited for use within AWR Hub than DBA_HIST_* views
- Utilize free-text query editor to copy and paste already saved SQL queries to quickly pull and analyze data
- Use the proven dashboard framework to create necessary widgets and turn them into reusable purpose-built dashboards
To access AWR Hub Explorer, navigate to Observability and Management, Ops Insights, and then the AWR Hub page. The AWR Hub Explorer can be launched by clicking on the Launch AWR Hub Explorer button.
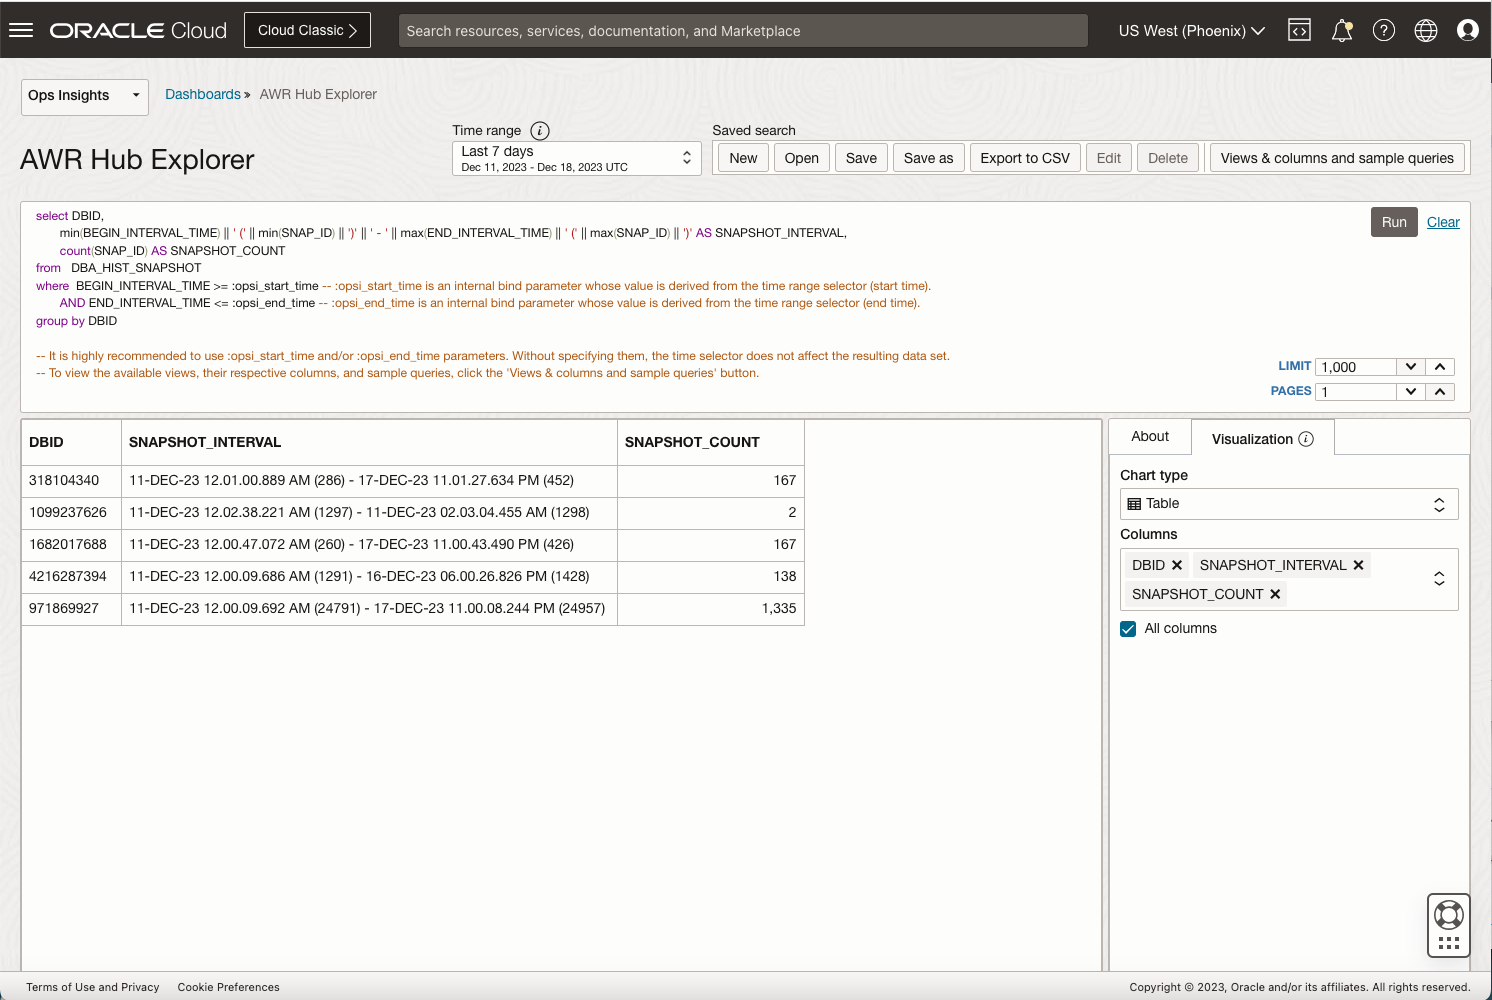
The AWR Hub Explorer allows for the utilization of the free-text query editor to author the query of choice using AWR_PDB_* views and analyze the data in the appended table. Like other Data Explorers in the OPSI service, you can also toggle between different chart types using the “Visualization” panel to the right of the query results. Two out-of-the-box time-based bind variables (:opsi_start_time and :opsi_end_time ) can be used within the query to set the necessary time range of the data being analyzed.
Lastly, click on the View & columns and sample queries button from the main AWR Hub Explorer landing page to view predefined sample queries and inspect view and column names for various DBA_HIST_REPORTS. The sample queries can be used as-is or as a baseline for any customized queries. The search field allows for a search of any specific view and column names. To learn more, visit Using AWR Hub Explorer.
Advanced querying support with next-generation data objects
Similar to the above free-text query support added for AWR Hub Explorer, the standard data object explorers are present throughout OPSI. You now have the option to write basic select statements in a more guided fashion or select advanced analytic scenarios. Choose either the “Basic” or “Advanced” modes in the top right corner page of the Data Object Explorer.
In the generic data explorer, you can choose the resource type to explore (Database, Host, or Exadata) and then your queries can span the data objects built for these resource types (for example, joins cannot be done between the Exadata Cell Disk - Hourly data object and the Database Summary - Hourly data object). The new “Views & columns" and "Sample queries” tabs provide full details of all the supported Data Objects, the columns contained within them, and the deeper details such as their units and descriptions as shown in the figure below. Filter a specific data object using the “Select a data object” dropdown and find a particular column across all data objects using the search box.
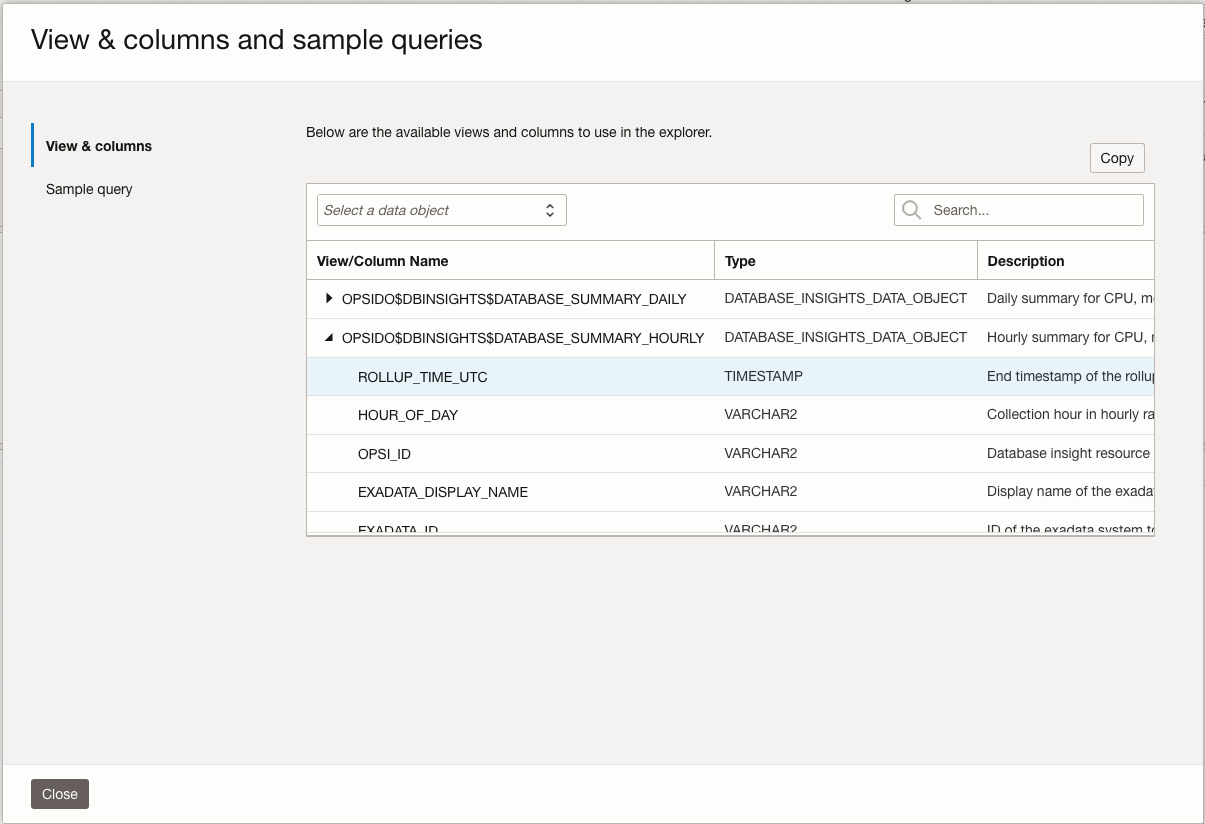
The copy button shown above the table copies the view or column name highlighted in the table to assist in query construction.
Visualize available capacity and treemap enhancement
To view unused CPU capacity within your database resources, navigate to Capacity Planning, then Databases, and select CPU. In the Database CPU screen select the Aggregate tab, under Grouping select either Exadata, VM cluster, or Host. Choosing one of these will allow the selection of the Show Unused Capacity check box as illustrated below.
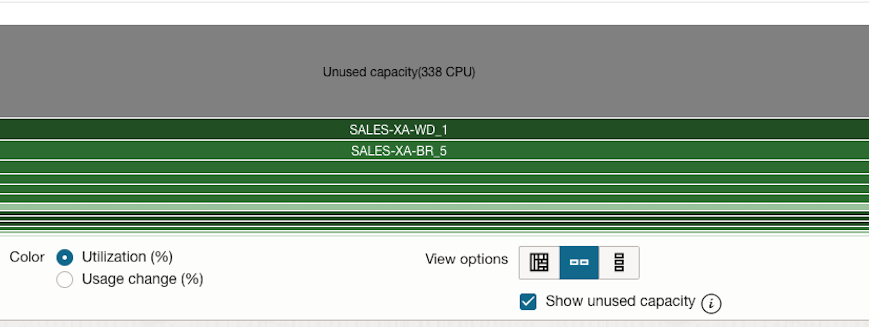
The unused space is indicated by the gray bar on the treemap. Expand the treemap for better visualization, including using the view for treemap squarified, vertical, or horizontal. Unused capacity will be grouped by vertically default.
This feature is geared to help make informed sizing and database placements easier by clearly visualizing where unused capacity exists within the various resource hierarchies of a database.
Exadata child compartment support
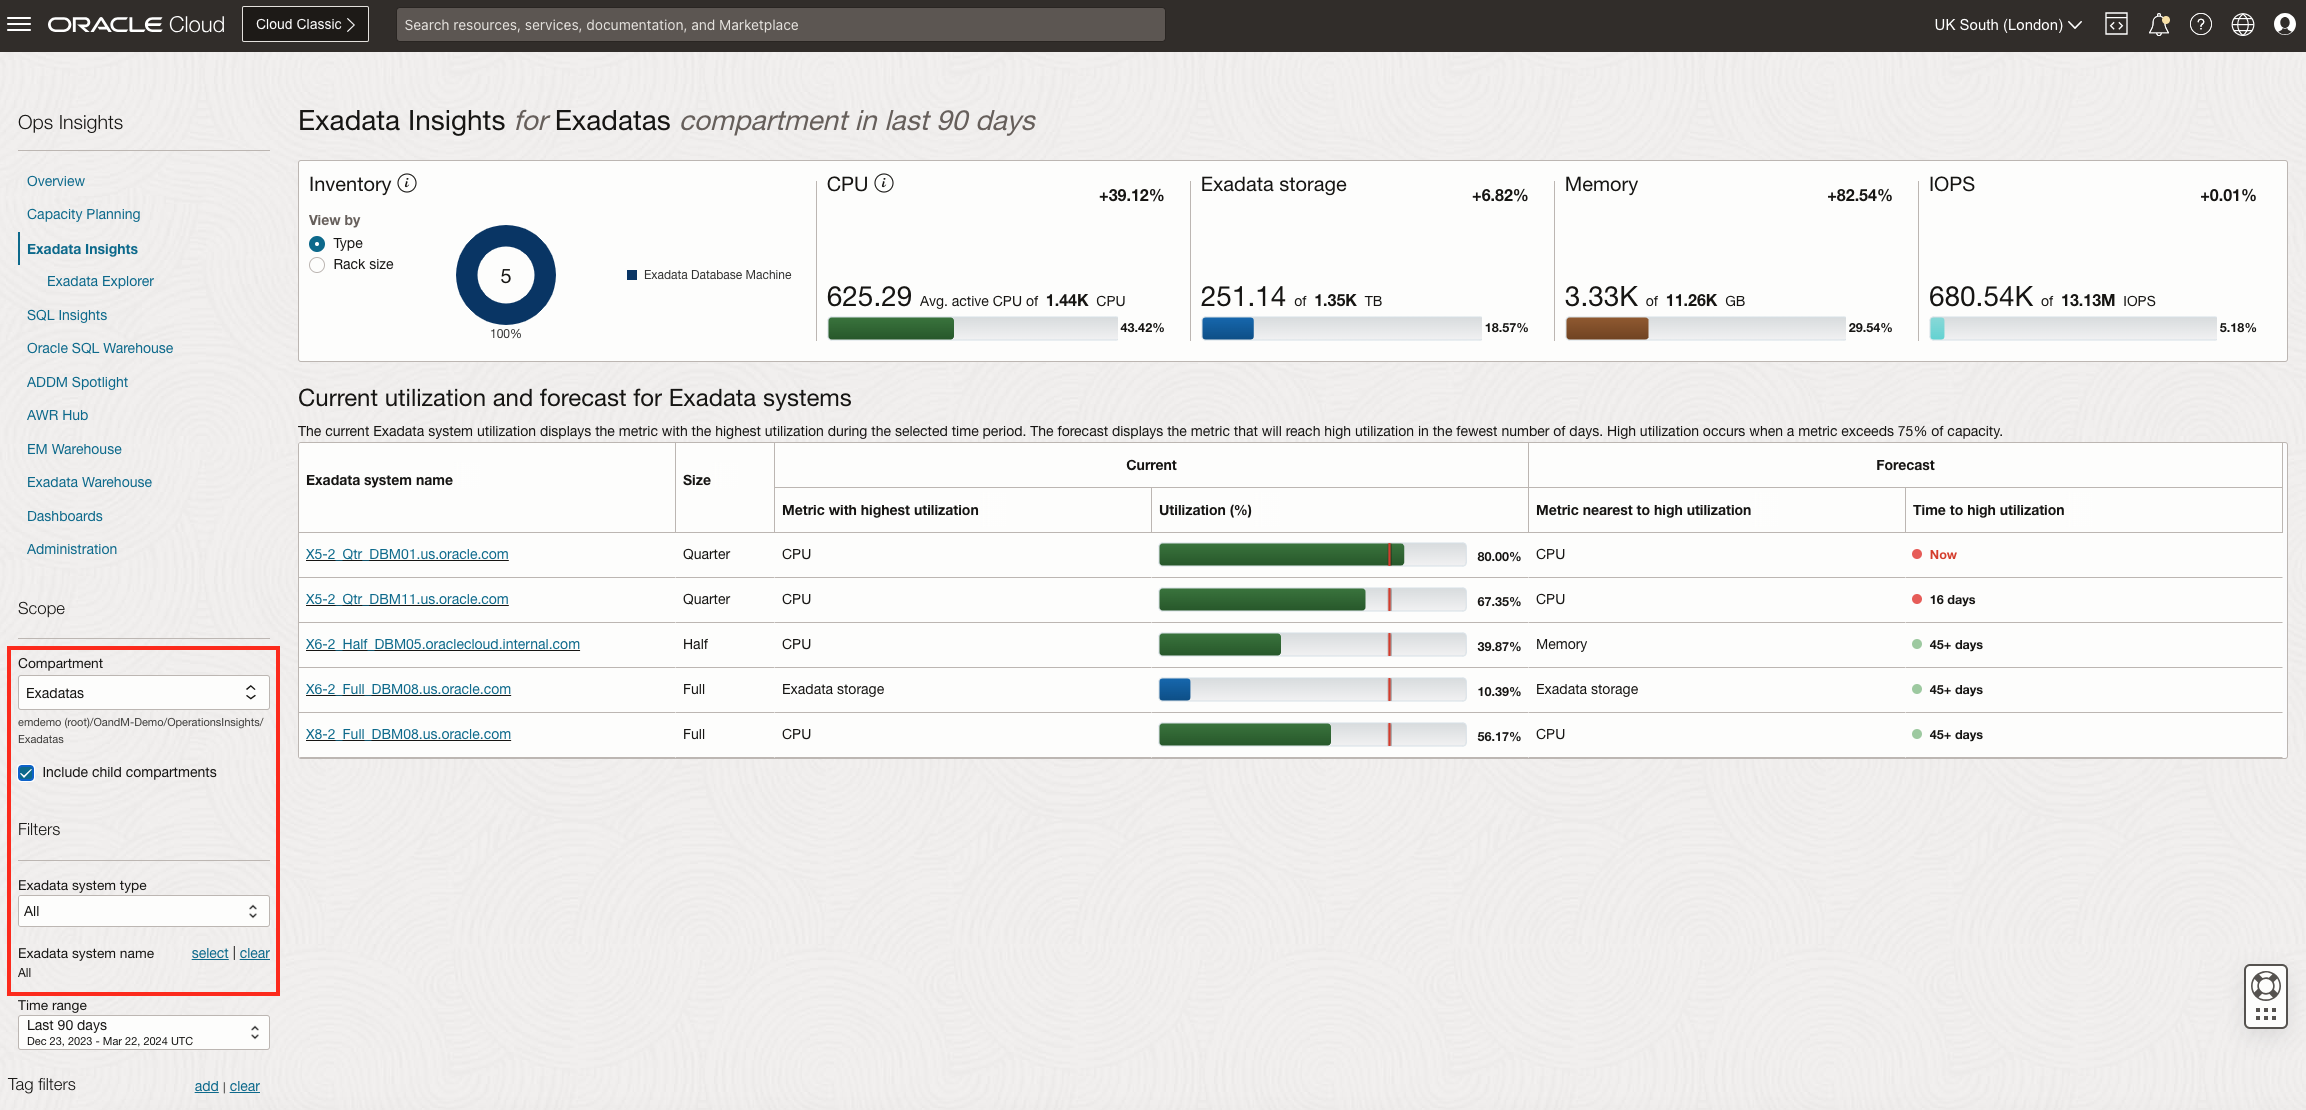
The ability to view all Exadata systems in the current compartment and all child compartments has been added within Exadata Insights as shown in Figure 5. This allows a full pane of glass view of a tenancies Exadata fleet within the selected region. The Exadata systems can now be filtered by tags.
Dashboard child compartment support
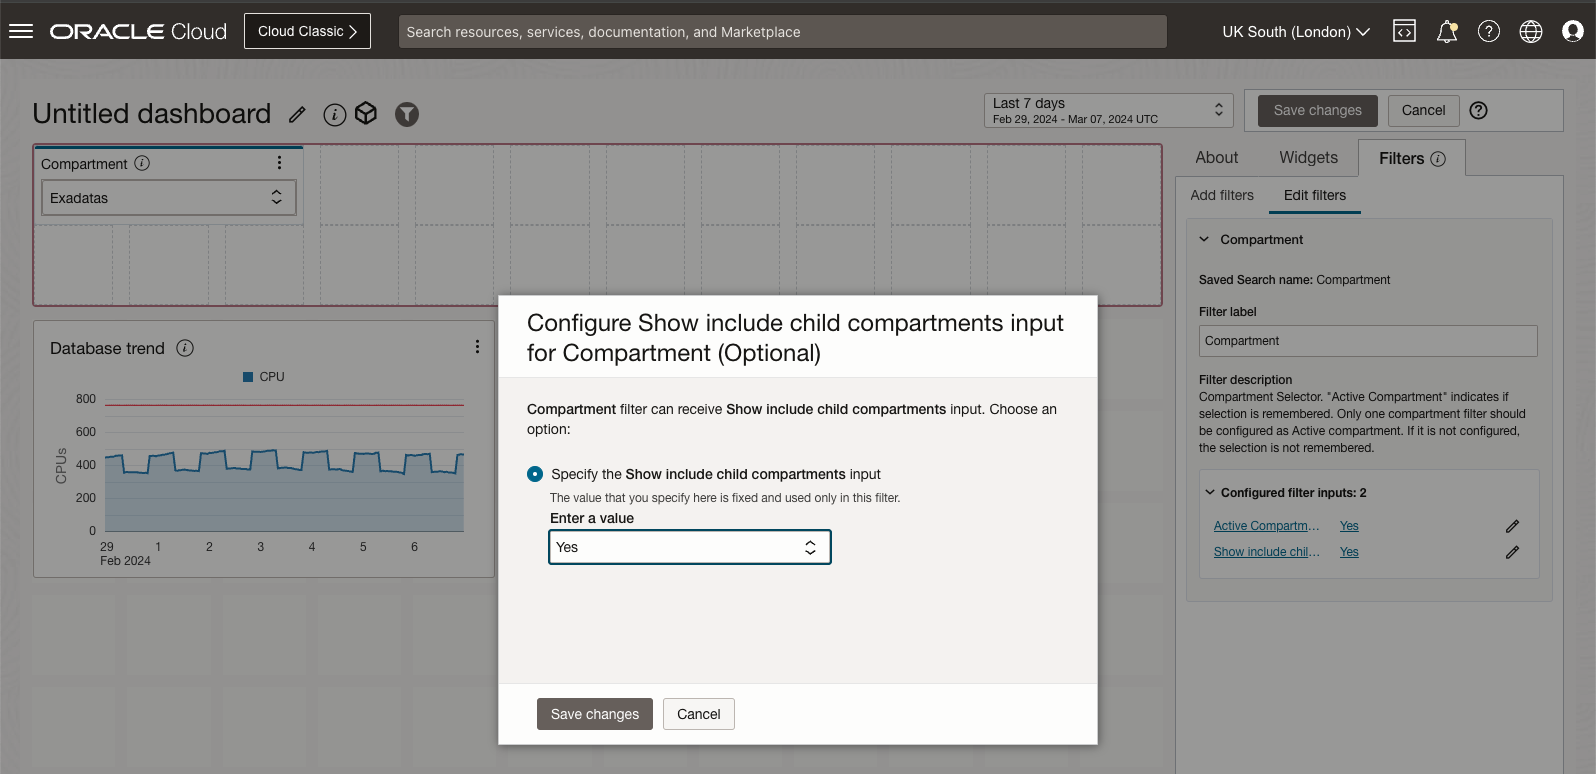
The compartment selector within OPSI dashboards can be configured to fetch data from the selected compartment and all child compartments. To configure the compartment filter, perform the following:
- When on a dashboard with a compartment selector present, choose the “Edit” option from the actions dropdown. The dialog is shown in Figure 6.
- Choose the “Filters” tab and click “Edit Filters”.
- Locate the compartment filter and click the pencil icon next to the ‘Show include child compartments’ filter input.
- Choose ‘Yes’ from the displayed dropdown and save the change.
Discovering collection issues with the EM Cloud Bridge capabilities
OPSI consumes telemetry data from several different sources including directly from the cloud (via OCI monitoring or private endpoints), OCI Management Agents, as well as Enterprise Manager via the EM Cloud Bridge capability. There are two ways to discover when data stops flowing into the service:
- Within our applications and the new collection issue dashboard (New)
- Configuring a data gap alarm
Collection issue widgets and dashboards
Within Database and Host Capacity Planning as well as Exadata Insights, the resources experiencing “collection issues” can be viewed under the inventory chart, as shown below.
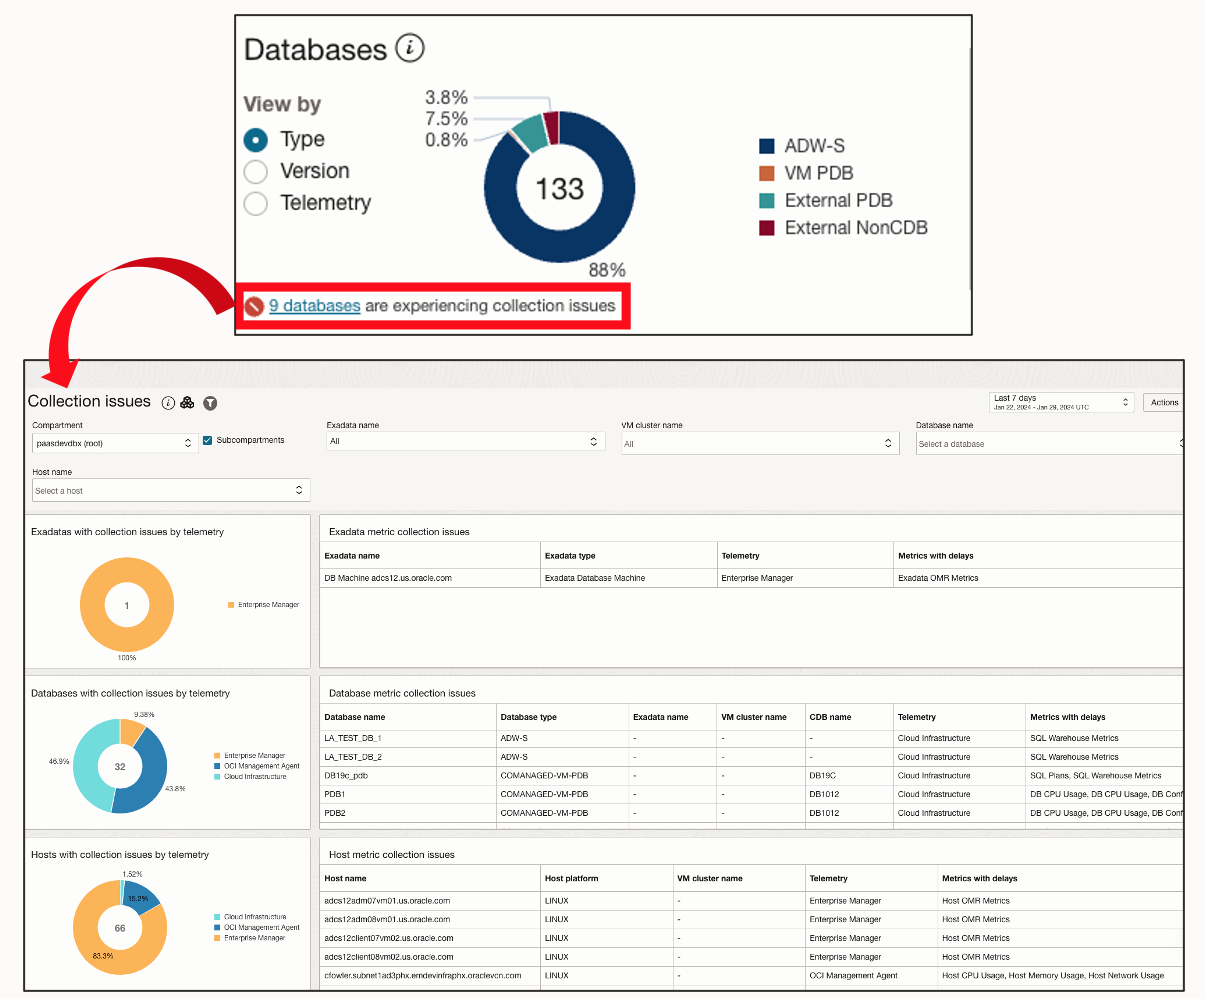
The “9 databases” shown above is a contextual link (preserving the currently applied filters) into a dashboard, showing the list of resources and the metrics detected to be missing. Typically, there is either a single metric missing indicating an issue collecting a particular metric, or all metrics missing which indicates a fundamental issue with the collection such as the Management Agent being unreachable or the database password having expired.
Under the Administration menu, a new link was also added for a more generic Collection Issues dashboard which shows issues detected across all the OPSI supported resource types as shown above.
The Collections issues dashboard is split into three main parts one for each target type: Exadata, database, and host. The dashboard features three pie charts showing the number of resources by their telemetry type, the percentage shown in the pie chart represents the percentage of that telemetry type having issues. For example: if 100 total targets (50 Enterprise Manager targets, 50 OCI Management Agents) and 2 Enterprise Manager targets have collection issues and 1 OCI Management Agent, the number of targets with issues is 3. The percentages would be 66% for Enterprise Manager and 33% for OCI Management Agents.
Each of the three sections also shows a table with specific details about the targets experiencing collection issues. These additional fields for each target type are now viewable. Review which specific metrics are experiencing issues with the Metrics with Delays field within each of the three tables.
Resources can be filtered or grouped using the various drop-down menu options located in the top part of the dashboard allowing you to filter by compartment, Exadata filter, VM cluster filter, database filter, and host filter.
Support for new platforms in Host Capacity Planning
Host Capacity Planning now supports ARM and AIX hosts that use Management Agent Telemetry. HP-UX is now supported using Enterprise Manager Telemetry.
Auto Enable for computes and external Hosts
OPSI now supports auto enable for computes and external hosts in a compartment. With this new functionality new provisioned computes or external hosts using management agents are automatically added to OPSI to start collecting data for analysis. This is particularly useful for use cases where ephemeral hosts exist i.e. host that are part of node pools that come and go based on on particular events. Hosts that are terminated are now immediately disable from OPSI to stop billing and void incurring extra charges when hosts are just terminated but not disabled in OPSI. This setting can be configured directly from the Host fleet administration for a particular component.
Burstable support for computes
OPSI now provides recommendations for burstable compute instances, instances that can burst to a higher level of CPU performance to support usage spikes. Based on the collected data, OPSI can now advise if a compute instance will benefit from being converted into a burstable instance and what baseline should be used. See Figure 9 below.
In addition, OPSI analyzes instances that are already burstable and advises if the CPU baseline needs to be updated or if the compute no longer benefits from being burstable based on workload. The recommended baseline is listed as a separate column under instance details. This feature is only available for instances of shapes that support burstable.

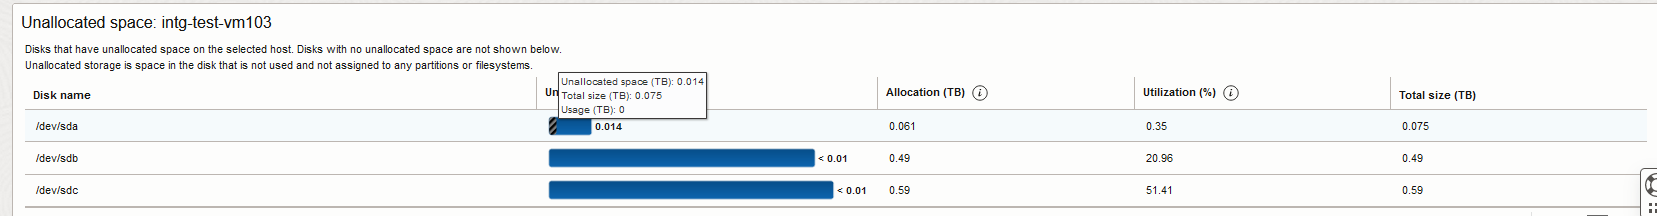
Not allocated Storage for hosts view details
OPSI now provides detailed data for hosts’ attached disks about space that is not allocated to any filesystems in the disk as shown below:
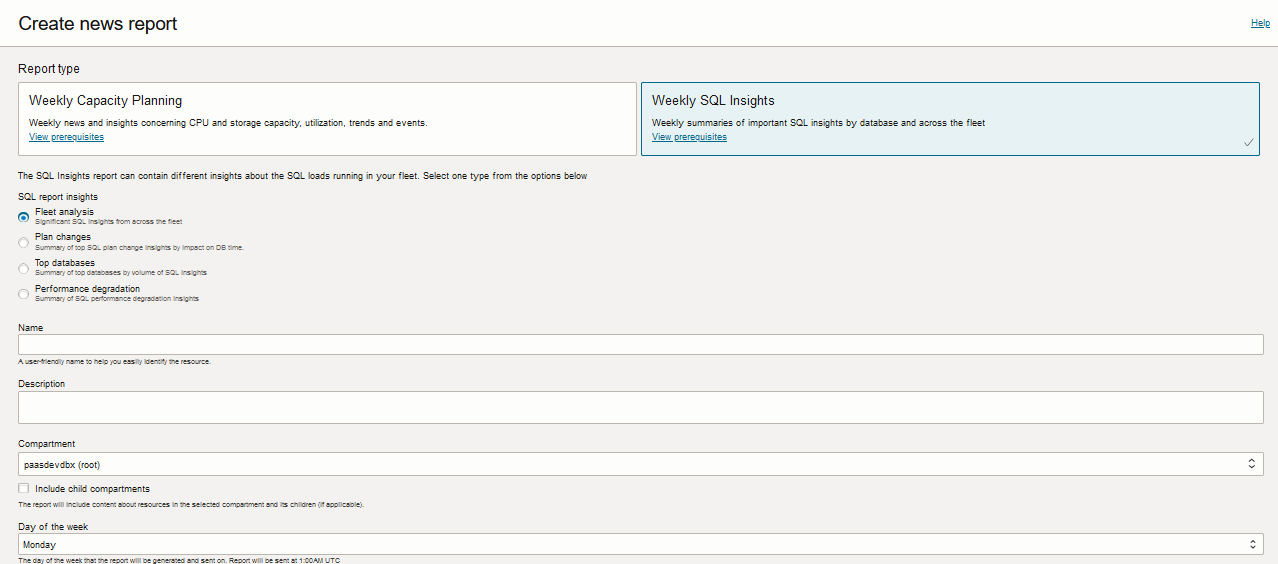
News Reports – SQL Insights
OPSI now provides News reports for SQL Insights: Fleet Analysis, Plan Changes, Top Databases, and Performance degradation as below. These reports are delivered weekly based on data analysis of the previous week. New features to select the day of the week and include resources in child compartments are now available for both Capacity Planning and SQL Insights reports.
New OCI cloud regions availability around the world
A region is a localized geographic area with one or more data centers located within a region. OCI has multiple cloud regions around the world to provide local access to cloud resources. The various OCI services are made available in various regions continuously. Ops Insights is now available in these new regions and realms:
| Realm | Region |
| OC1 | sa-valparaiso-1, us-saltlake-2, sa-bogota-1 |
| OC21 | me-dcc-doha-1 |
| OC22 | eu-dcc-rome-1 |
| OC24 | eu-dcc-zurich-1 |
| OC25 | ap-dcc-tokyo-1 |
| OC27 | us-dcc-swjordan-1 |
New organization of technical resources for OPSI
Recent changes to review: the new organization of the high-level categories and easy access to all OPSI related resources. We have also introduced a brand new series of “How-to” videos with the new playlist Discover Oracle O&M: “How-to” Series, on the Oracle Cloud Observability and Management YouTube channel. Follow along and learn how to use key OPSI components and perform typical analysis tasks, among many others.
Get started today!
Find OPSI under the Observability and Management menu in the Oracle Cloud Console. The service is accessible through the Console, CLI, and REST API and is already available in all commercial regions, with Government regions coming soon. OPSI is available to use with Autonomous Databases, external databases (Oracle Databases deployed on-premises), and Oracle Cloud Databases on bare metal, VMs, and Exadata Database Services on Dedicated Infrastructure and Exadata Cloud at Customer.
To test drive this feature and many other features in OPSI before even signing up for the service, try the demo mode or try it by signing up for Livelabs.
Not yet a customer? Sign up for an Oracle Cloud Infrastructure trial account!
To learn more about other Ops Insights capabilities, visit:
- Explore Ops Insights
- Ops Insights Technical Content
- Hands-on lab: Get Started with Oracle Cloud Infrastructure Ops Insights
- Ops Insights Videos, including “How-to” videos
- Integrating Enterprise Manager with OCI Services
- Pricing
Resources
- ADDM Spotlight provides strategic advice to optimize Oracle Database performance and how to enable full feature support for your Autonomous Databases
- Enable Cross-Service Dashboards.
- OCI Data Regions