OCI Ops Insights (OPSI) service is a cloud native solution that is part of the Oracle Cloud Observability and Management platform. OPSI helps gather and analyze telemetry data from various resources and plans for enterprise growth. It helps perform data-driven capacity planning and performance management, thereby reducing enterprise capital expenditure and improving application throughput.
OPSI Data Explorer Provides an Easy-to-Use Interface for Querying and Exploring Performance Statistics
As DBAs, DevOps engineers, or IT administrators, you can gain valuable insights which can be used as widgets to construct dashboards, providing at-a-glance visibility into performance, utilization, and configuration.
Starting with basic mode query for analysis
Imagine a scenario where your monthly bill is significantly higher than expected, and you need to understand how database resources are consumed. The first step in addressing this issue is gaining insights into the usage and identifying what’s driving the excessive resource consumption. One way to do this type of exploration is by using the OPSI’s Data Object Explorer.
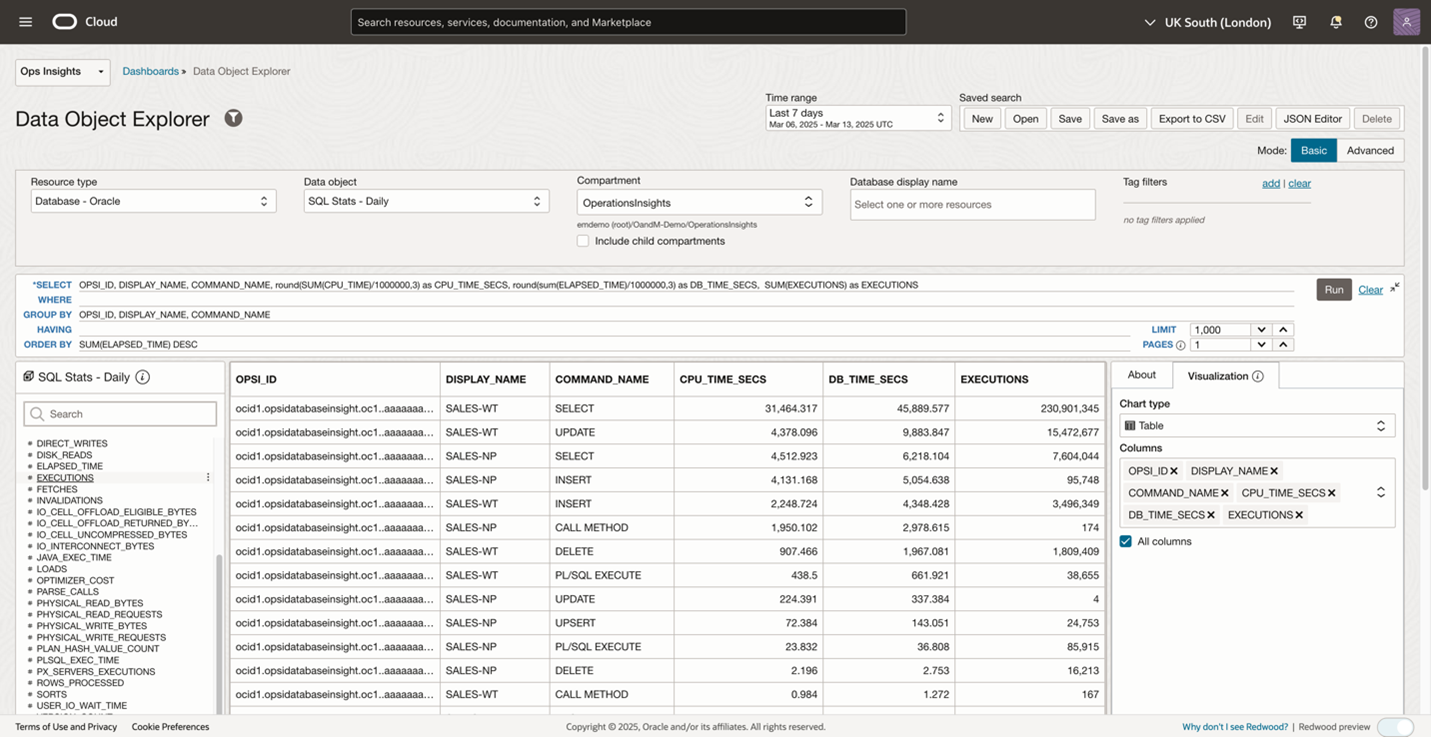
The explorer launches the basic mode by default, which provides an intuitive interface for constructing a SQL SELECT query. Before you begin typing a query, select the resource type you want to analyze, such as the database in the current use case. The available data objects of the database resource will be populated accordingly. Then, select the data object like SQL Stats – Daily from which the SQL will retrieve data. Finally, write a simple select query that shows the resource consumption across all databases within the selected compartment and time range.
Figure 1 below shows the top resource consuming databases in a table, including the CPU consumption with overall resource usage in descending order. This visibility helps quickly narrow it down to the root cause, SALES-WT database is consuming the most resources. The explorer is making the initial troubleshooting process much more efficient. Additional instructions to construct a basic query are outlined here.
Visualizing data with interactive charts
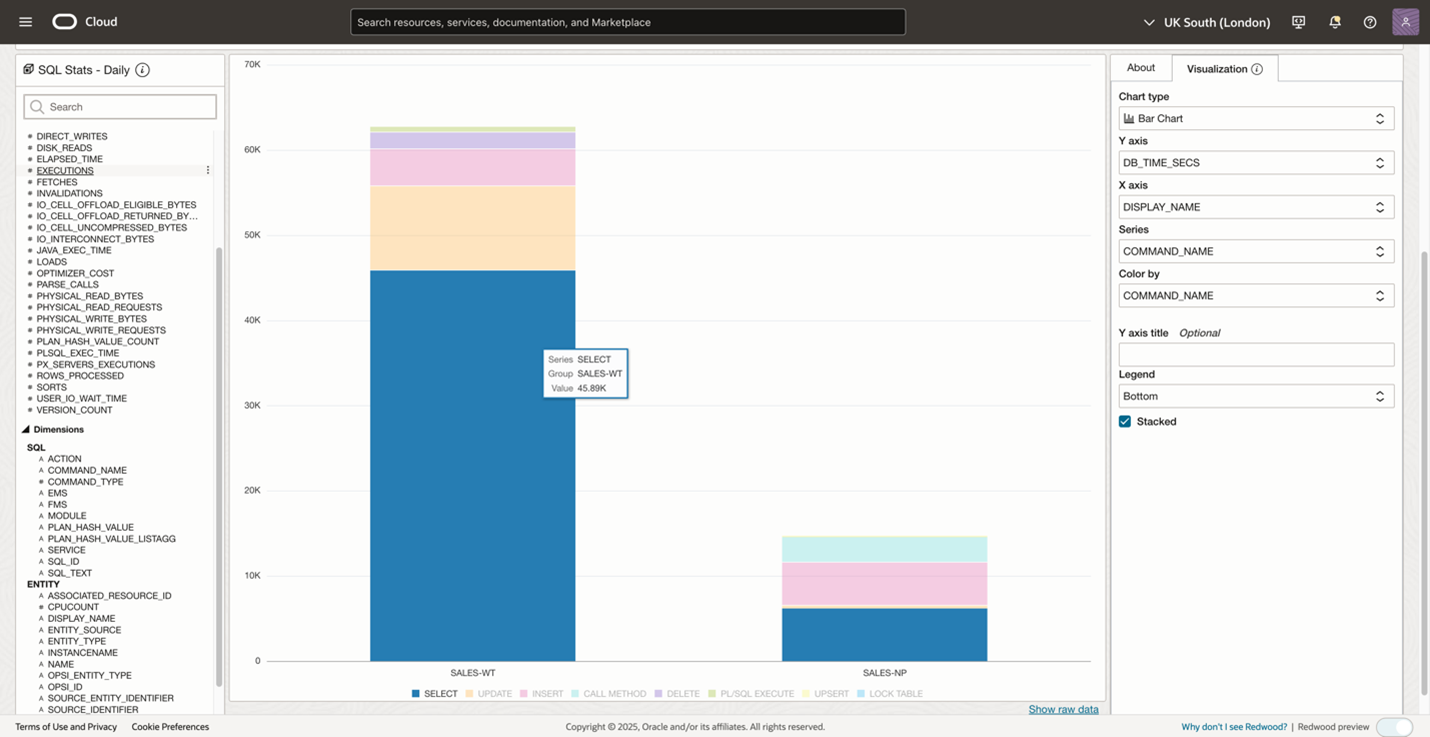
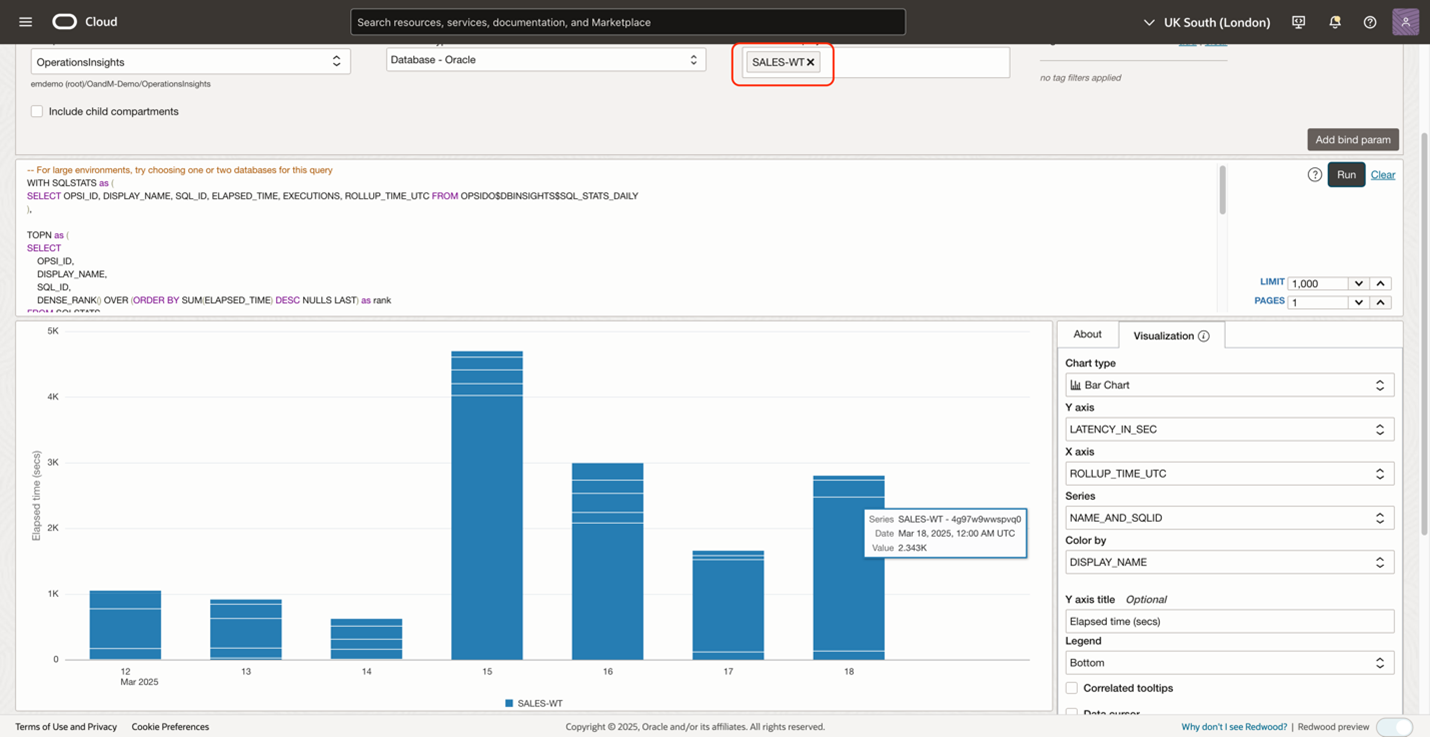
Once the top activity database query is executed, the data is shown in a table by default. To help process this data quickly and make it easier to interpret, from the Visualization panel on the right-hand side, select to view your data as a bar chart. The intuitive graphical representation highlights the top resource consuming database is SALES-WT.
The query is broken down by the command, using different colors to distinguish the command clearly. Now, hovering over the stacked bar shows that the SELECT command takes up most of the time. Write a time series query and select a line chart to compare resource utilization trends or write a query for a pie chart to show the inventory breakdown by specific dimensions, for different scenarios.
Leveraging the advanced mode for comprehensive analysis
Create a follow-up query to drill down into the specific SQL statements for the high-consuming databases and identify optimization opportunities using the Data Object Explorer’s advanced mode. The advanced mode provides a free-text editor, allowing different views in a single query for a more sophisticated analysis.
Before writing a query, the explorer provides predefined sample queries to start with. Views and column names are also available for the various types of Data Objects, which can be used as a base for your personalized queries. To open the sample queries in advanced mode, click on the ? sign next to the Run button of the query edit panel. This opens the View & Column and the sample queries pop-up screen.
In the previous example, the SQL Stats – Daily data object is used to identify the top consuming databases. In advanced mode, you can find the target data object in the views & column pop-up and see the available columns and descriptions, helping to construct the advanced query.
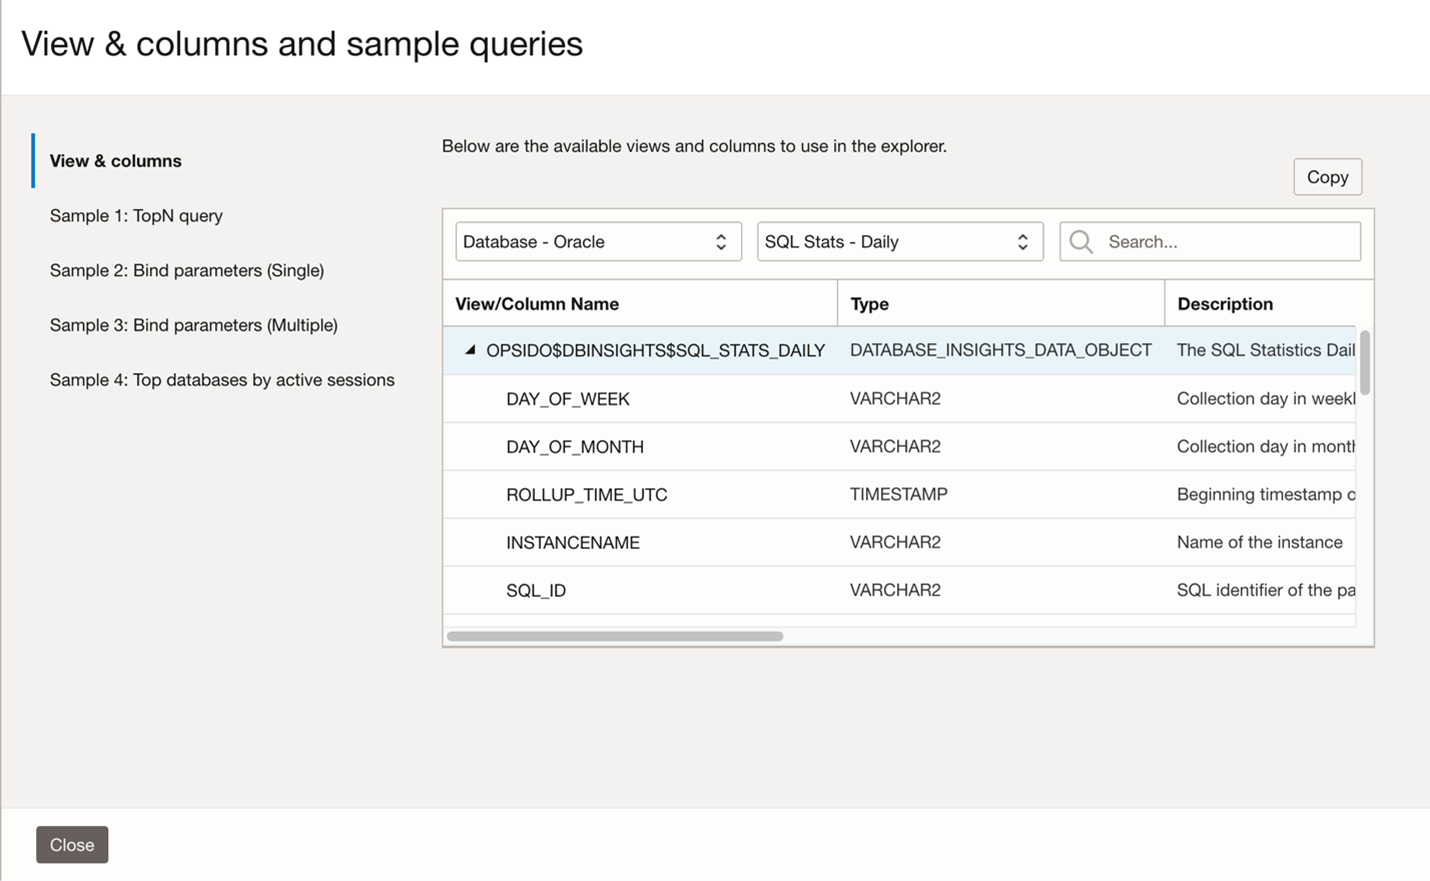
With the help of the explorer view above and some SQL knowledge, a query can be constructed to quickly highlight the databases with top activity levels, allowing a targeted investigation on the specific SQL workloads causing excessive consumption.
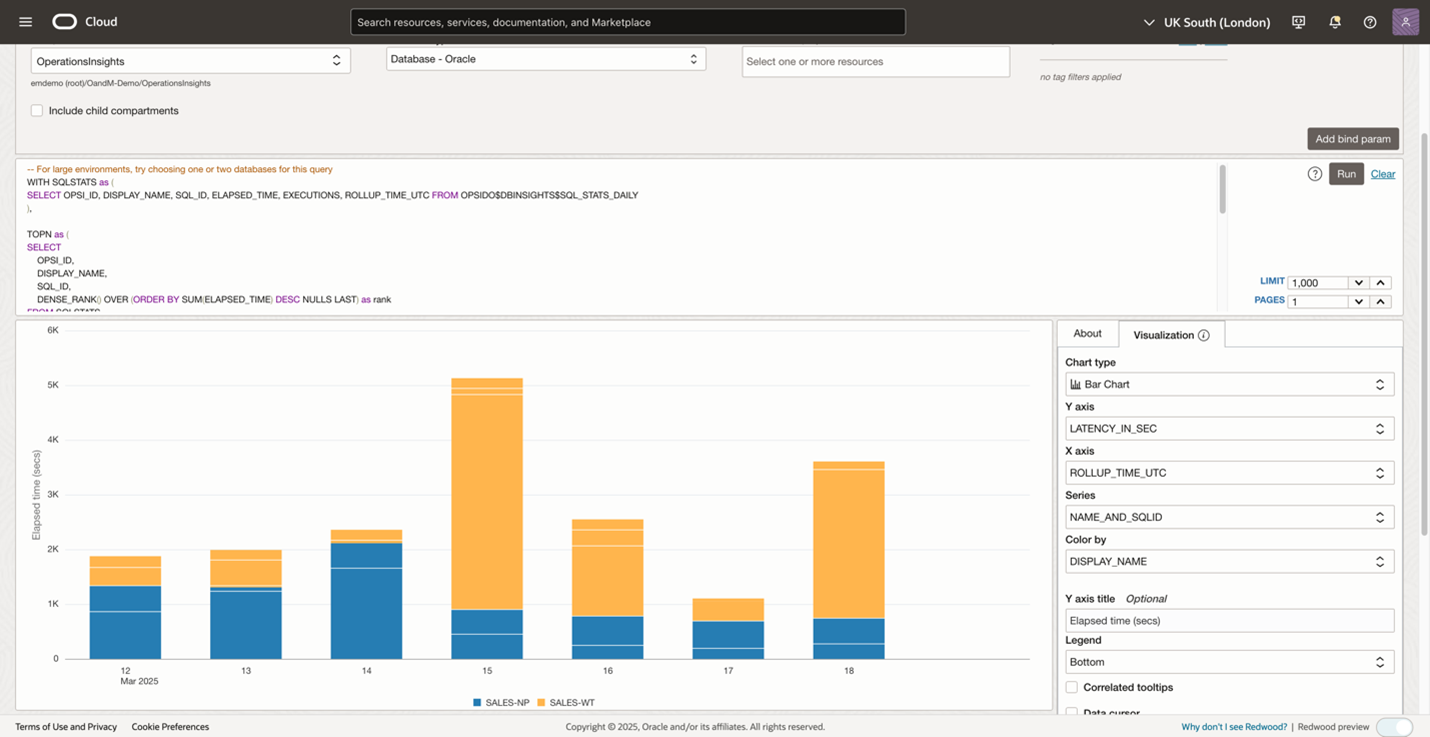
From above Figure 2, you found that SALES-WT is the top resource consuming database. Now, you can investigate the top SQL statements running on this database by using the Database resource filter at the top, as shown in Figure 5. Hovering on the stacked bar will pop up the resource details like SQL ID and elapsed time. For more information on using the advanced mode in the Data Object Explorer, see the Using The Advanced Query Creator.
Enhancing flexibility with bind parameters
Besides the default resource filter, OPSI explorer provides bind parameters in advanced mode to make queries even more powerful. This advanced feature allows users to create a single query template with parameters that can be dynamically modified at runtime. Without rewriting queries, you can quickly analyze different scenarios by using bind parameters. In the previous example, we determined that the database SALES-WT is consuming the most resources, and the SELECT command seems to take a lot of time. Now, you can add a COMMAND_NAME bind parameter to help target the top SELECT SQL statements. The detailed steps are documented in this bind parameter section.
Once the command name bind parameter is added, a selector will show up for the corresponding bind parameter. Using the COMMAND_NAME filter in the query and filtering by the “SELECT” command, you can get insights into which SELECT SQL is consuming most resources. From the bar chart, you spot the SQL with the significantly taller bar. Hovering over the bar will show the SQL details like SQL ID. The bind parameter helps you analyze the top SQL with different operation types by selecting another command name. For example, select “INSERT”, from the bind parameter selector without modifying the current query. This parameter dramatically increases the flexibility and reusability of queries while reducing the need to maintain multiple similar queries.
Advanced Customization Through JSON Editor
The JSON Editor feature serves specialized users like DBAs, IT managers or who possess a comprehensive understanding of saved search metadata. This advanced capability helps technical experts and developers manipulate the underlying configuration data that defines queries, transformations, and visualizations which would be difficult through the standard interface. In the current example, the SQL statement with the 4g97w9wwspvq0 SQL ID consumes more resources than expected and you would like to drilldown to this SQL and figure out what happened. The following GIF shows the SQL query average latency by plan bar chart with the SQL_ID bind parameter to help target the desired SQL ID.
If the current bar chart is not the best visualization, the JSON Editor gives you more direct control over the visualization properties that aren’t exposed through the standard interface. Here’s a detailed look at how to enhance visualizations by customizing the uiConfig: defining the chart type, specifying the axis, scaling the chart etc. After applying the changes, the new visualization is displayed while the standard visualization interface is no longer visible. In the example below, a scatter chart easily shows how the plan changes affect the performance. Check out the section on JSON Editor for detailed instructions.
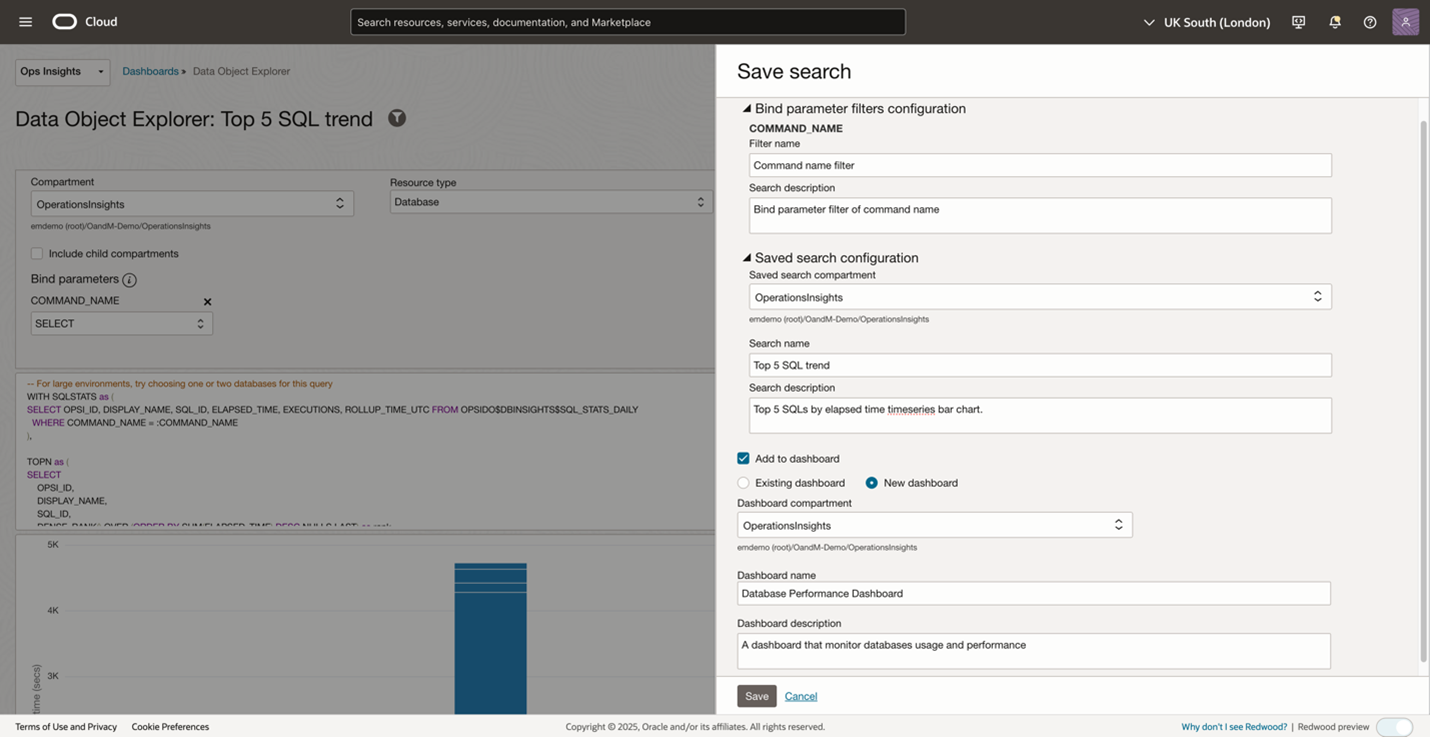
Save queries and add to a dashboard with filter
Once a compelling query is defined, save it and reload that saved search. For example, you can define a query to get the topN SQL performance data. The Save functionality preserves the complex query logic, bind parameter config, and visualization preferences, ensuring consistent analysis methods across time. The existing saved search can be reloaded in the explorer via the Open action button. You can build a library of standardized performance queries that become part of your regular monitoring processes. In addition, the saved search can be added to a new or an existing dashboard as a widget to construct your customized dashboard as shown in Figure 8. Here is the detailed information on how to manage dashboards and create OPSI widgets and filters on dashboards.
Dashboards also support filtering OPSI resources by one or multiple tags. With tag filtering, you can quickly target specific sets of resources based on Oracle standard or user-defined criteria. Multiple databases have appeared in this Database Performance Dashboard example, but let’s assume we are more interested in the SALES department. Add a tag filter and link it to the widgets. by selecting the eSales department, only the resources that have the eSales tag will be displayed in the dashboard. Tag filtering is helpful in creating and organizing a dashboard by grouping resources based on the business needs.
Get Started with OPSI Data Object Explorer today
To test drive this feature and many other features in OPSI before even signing up for the service, try the demo mode using your tenancy or try demo mode by signing up for Livelabs.
Not yet a customer? Sign up for an Oracle Cloud Infrastructure trial account!
Resources
- Explore Operations Insights
- Hands-on lab: Get Started with Oracle Cloud Infrastructure Operations Insights
- OPSI Data Object Explorer Technical Content
- OPSI SQL Explorer blog
OPSI customers can now use the newly launched OCI Generative AI powered Oracle Support Digital Assistant. The Digital Assistant eliminates the need to manually search through the O&M documentation, and provides with quick, accurate answers directly within the OCI console interface. Learn more about it here.