
In the first post in this series, we configured MySQL Telemetry to export OpenTelemetry metrics to Prometheus. Once the metrics arrive, the more important question is how a DBA should read them.
This post is not a catalogue of every metric or meter. Its purpose is to build a practical way of thinking: start with workload, capacity, and latency; then use related signals to decide whether the database is healthy, approaching a limit, or already under pressure.
Why Metrics Matter
Traditional commands such as SHOW GLOBAL STATUS and SHOW ENGINE INNODB STATUS remain valuable. They provide a point-in-time view and are often the fastest way to investigate a specific question. Telemetry metrics add the missing dimension: history. A time series shows whether a value is normal for this server, whether it changed with a deployment or traffic event, and whether several symptoms began together.
OpenTelemetry also puts database telemetry on the same path as application metrics, traces, and logs. That does not replace MySQL-specific knowledge; it makes that knowledge easier to share in a common observability platform and to correlate with what applications are doing.
This is where MySQL Telemetry differs from collecting a second, isolated set of database counters. MySQL exports its native metrics through OTLP, so the same observability platform can correlate a database change with application latency, infrastructure telemetry, and—where available—distributed traces. The DBA question remains the starting point; OpenTelemetry makes the evidence easier to carry across the stack.
From Meter Groups to DBA Questions
The first post introduced the server meter groups, their frequency, and how to configure them in performance_schema.setup_meters. We will not repeat that inventory here. Instead, use the meter group as a route to the operational question you are trying to answer.
For example, mysql.stats.connection is the natural starting point for connection activity; mysql.stats.com for command activity; mysql.inno and mysql.inno.buffer_pool for InnoDB and cache behavior; and mysql.inno.data for data and I/O-related activity. The exact meters available depend on the MySQL version and enabled components, so verify the server with:
SELECT NAME, FREQUENCY, ENABLED, DESCRIPTION
FROM performance_schema.setup_meters;
Meter names identify telemetry groups. They are not the same thing as DBA dashboard headings. Terms such as “redo-log pressure”, “contention”, and “resource saturation” are diagnostic questions answered by combining metrics with MySQL status, Performance Schema, and host-level telemetry.
Key Metrics Every DBA Should Know
Rather than trying to monitor every available metric, start with a small set that answers the most common operational questions. The table below maps typical DBA questions to representative MySQL Telemetry meter groups and telemetry metrics.
| DBA question | Meter group | Metrics to start with |
| Connection capacity | mysql.stats mysql.stats.connection | threads_connected max_used_connections errors_max_connections |
| Workload and queueing | mysql.stats mysql.stats.com | threads_running questions select, insert, update, delete |
| Buffer-pool efficiency | mysql.inno.buffer_pool | read_requests reads wait_free |
| Write-path pressure | mysql.inno | redo_log_logical_size log_waits os_log_pending_fsyncs |
| Lock contention | mysql.inno | row_lock_current_waits row_lock_waits row_lock_time |
Connections and headroom
Start with mysql.stats.threads_connected, the current number of open connections, and compare it with the max_connections system variable. mysql.stats.connection.errors_max_connections records connections refused because the limit was reached. The useful question is not only “how many connections exist?” but “how much headroom remains, and are clients already being refused?”
current connection utilization = threads_connected / max_connections
connection headroom = max_connections - threads_connected
Use the following initial operational criteria, then tune them to the service’s normal peak. Warning: utilization is at or above 80% for five minutes. Urgent: utilization is at or above 90% for five minutes. Incident: rate(errors_max_connections[5m]) is greater than zero; clients have already been refused.
mysql.stats.max_used_connections is useful for capacity planning: if its post-restart high-water mark exceeds 80% of max_connections, review pooling and expected growth. It is not the current utilization value, and it resets when the server restarts. A rise that stays below the thresholds can be normal traffic growth; a threshold breach or a refused connection is the signal to investigate.
Threads running
Threads_running represents statements currently executing in the server. Short spikes may be harmless. A sustained increase means requests are accumulating: check CPU saturation, storage latency, lock waits, and changes in workload mix before assuming that MySQL itself is at fault.
Buffer pool behavior
The buffer pool tells you whether the working set is being served from memory or forcing physical reads. Innodb_buffer_pool_reads counts reads that could not be satisfied from the buffer pool and therefore required a disk read. A useful derived measure is:
buffer pool hit ratio = 1 – (Innodb_buffer_pool_reads / Innodb_buffer_pool_read_requests)
The formula above uses the underlying MySQL status variables. In Prometheus, calculate the same relationship from the corresponding exported telemetry metrics.
In Prometheus, calculate the ratio from a time window rather than lifetime counter values. In the direct-export setup from the first post, the query pattern is:
1 – (rate(reads[5m]) / rate(read_requests[5m]))
Confirm the metric names shown by your Prometheus endpoint before copying the query. An OpenTelemetry Collector can intentionally transform names or attributes as part of the telemetry pipeline.
Do not use a single universal target. Establish a baseline for the workload. A drop from that baseline together with rising physical reads and query latency is much more meaningful than an isolated percentage.
Redo and checkpoint behavior
For write-heavy systems, observe write throughput, redo generation, checkpoint activity, and storage latency together. “Redo-log pressure” is a diagnostic pattern, not a meter-group name. Look for sustained write demand that coincides with checkpoint pressure and worsening commit or transaction latency.
Lock waits
Lock-wait counters and rates reveal contention that users often experience as intermittent slowness. Rising waits are a prompt to inspect transactions, isolation behavior, and the statements involved. Use Performance Schema to move from the aggregate symptom to the sessions and objects responsible.
Commands per second
Counter metrics become useful as rates. In Prometheus, use a time window such as rate (questions[5m]) to see the rate of client statements. Compare workload rate with latency, errors, connections, and resource consumption. More commands per second is healthy when latency stays stable; it is a warning when queues and latency rise at the same time.
Using Metrics Together
A single metric tells you that something changed. A group of metrics helps you explain why. These patterns are a good starting point:
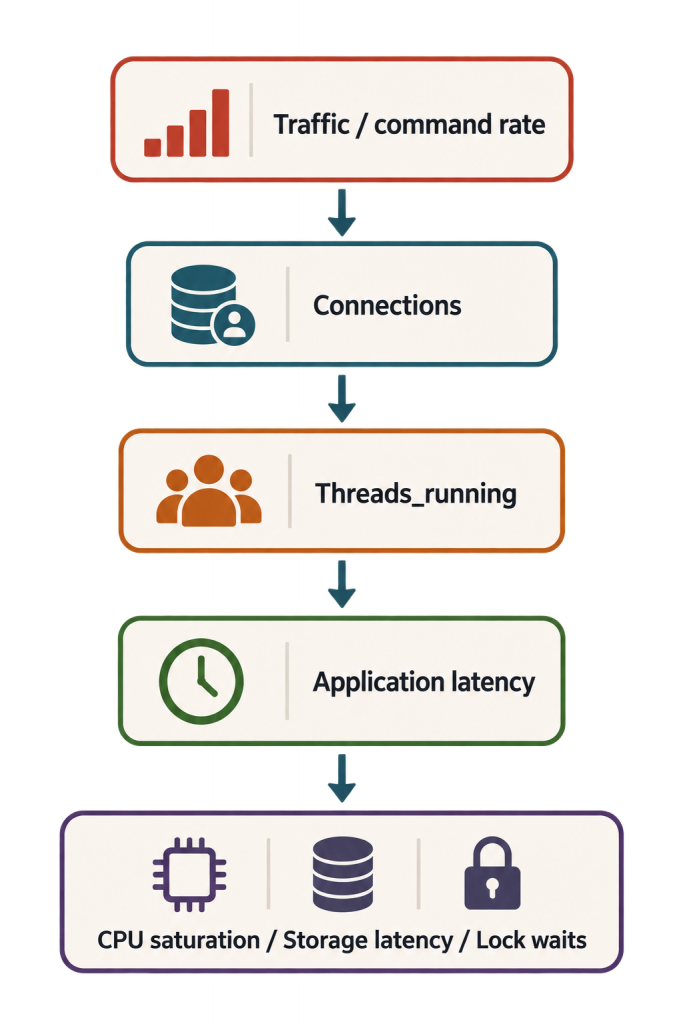
This is a diagnostic flow, not proof of a single cause. OpenTelemetry lets DBAs examine MySQL alongside application and infrastructure telemetry in the same time range.
More traffic, still healthy: connection and command rates increase, while Threads_running, latency, and resource use stay near their normal range.
Queueing: Threads_running remains elevated and latency rises. Correlate with CPU, storage latency, lock waits, and the active statement mix.
The working set no longer fits: physical reads rise, the buffer-pool hit ratio falls from its baseline, and read latency worsens. Check data growth, memory sizing, and workload changes.
Write-path pressure: write rate, redo generation, checkpoint activity, and commit latency increase together. Validate the storage subsystem and the write pattern before changing configuration.
This approach avoids reacting to normal peaks or tuning the wrong subsystem.
A Practical First Dashboard
For a first operational dashboard, keep the view small enough to support a decision:
Connections: connected clients, connection errors, and remaining headroom.
Workload: command rate, plus Threads_running.
Cache: logical versus physical buffer-pool reads and the derived hit ratio.
Write path: write and redo activity, plus commit latency.
Contention: lock-wait rate and transaction context.
System context: CPU, memory, storage latency, and network traffic.
The goal is not a wall of gauges. It is a compact screen that answers: Is demand increasing? Is MySQL keeping up? If not, is the pressure in concurrency, memory, storage, or contention?
These six panels are enough to make a first operational decision in most production environments.
Because they are built from native OpenTelemetry metrics exported by MySQL, they can naturally be combined with application metrics, traces, and infrastructure telemetry while keeping DBA questions at the center.
Next, I will try to use these DBA questions and Prometheus queries to build a practical Grafana dashboard.