In modern application development, observability is no longer optional. It is a core requirement for stable operations, faster troubleshooting, and better understanding of system behavior.
Databases are especially important because they often sit at the center of application performance. When a database becomes slow, overloaded, or unavailable, the impact is usually felt across the entire application stack. For that reason, having accurate and timely visibility into MySQL metrics is essential for DBAs, SREs, and application teams.
With MySQL Telemetry, MySQL server metrics can be exported using the OpenTelemetry Protocol (OTLP). This makes it possible to send MySQL metrics to an OpenTelemetry-compatible backend such as Prometheus.
What We Are Building
In this example, MySQL exports OpenTelemetry metrics directly to Prometheus.
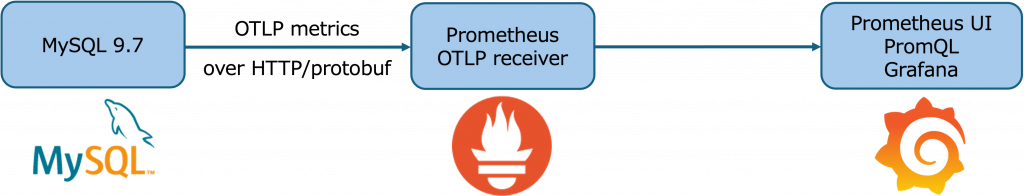
Prometheus supports OTLP ingestion over HTTP. The Prometheus OTLP receiver is disabled by default and must be enabled with the –web.enable-otlp-receiver flag. When enabled, Prometheus receives OTLP metrics on the /api/v1/otlp/v1/metricsendpoint.
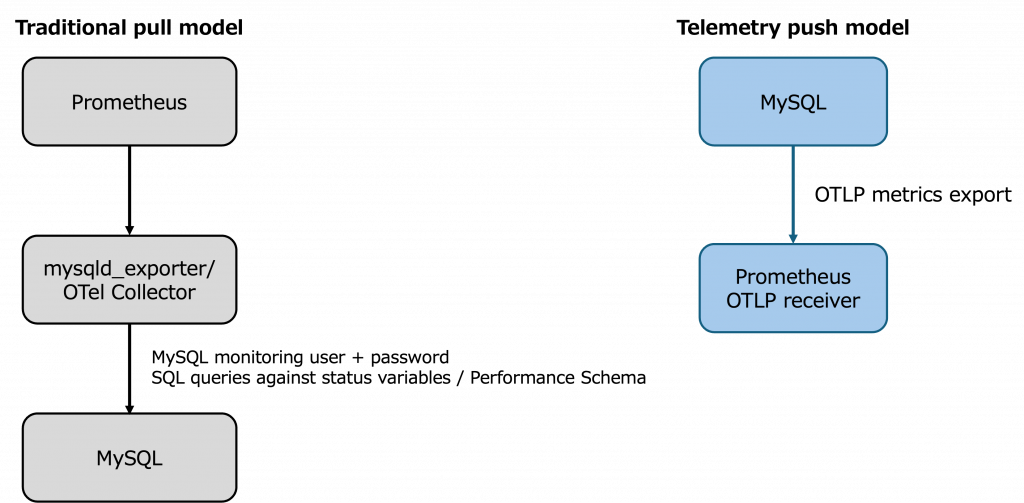
Two Architecture Options for MySQL OpenTelemetry Metrics with Prometheus
There are two common ways to use MySQL OpenTelemetry metrics with Prometheus.
Option 1: Direct Export to Prometheus
The simplest architecture is to send OTLP metrics directly from MySQL to the Prometheus OTLP receiver.
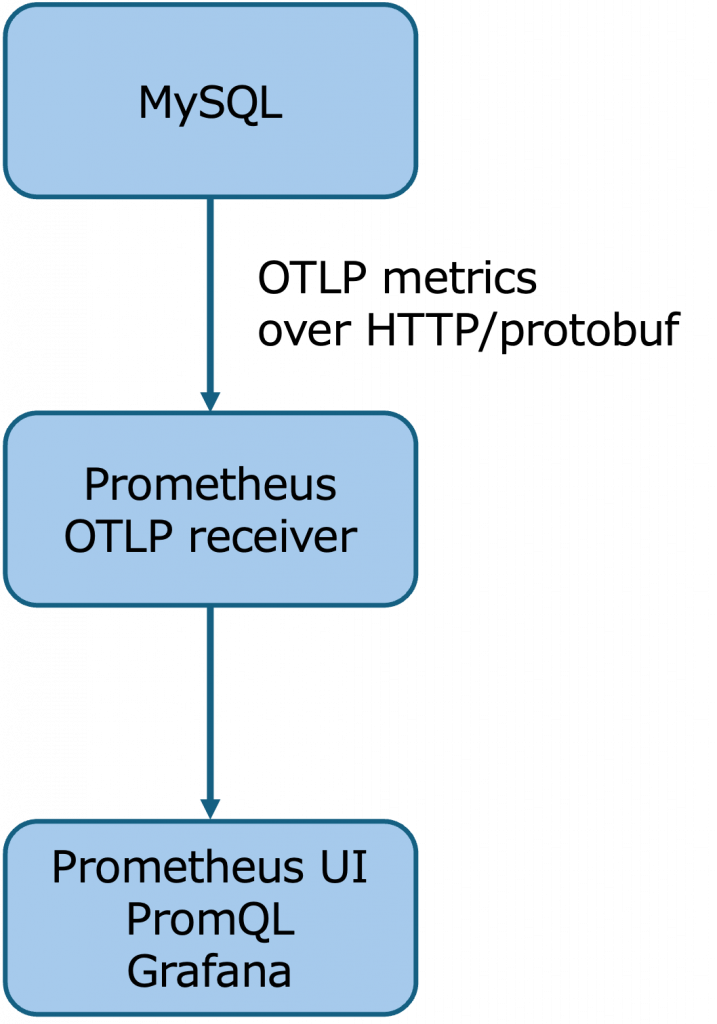
This is the approach used in this article. It has fewer moving parts and is a good way to quickly get started with MySQL Telemetry and Prometheus.
In this model, MySQL exports metrics directly to the Prometheus endpoint. Prometheus receives the metrics through its OTLP receiver and makes them available for PromQL queries, dashboards, and alerting.
Option 2: Export Through the OpenTelemetry Collector
A second option is to place the OpenTelemetry Collector between MySQL and Prometheus.
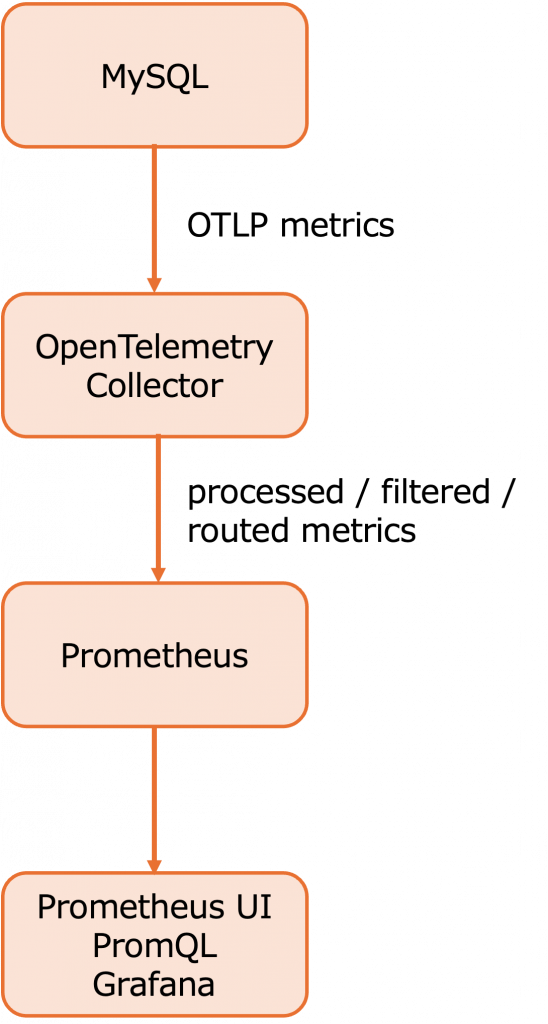
This architecture is slightly more complex, but it provides additional flexibility. The OpenTelemetry Collector provides a vendor-agnostic way to receive, process, and export telemetry data. It can be used to customize telemetry pipelines before data reaches the final backend.
Using the collector allows teams to customize the telemetry flow. For example, they can filter metrics, enrich attributes, batch data, transform metric names or labels, route telemetry to multiple backends, or centralize telemetry processing across many systems.
For this article, we focus on the direct MySQL-to-Prometheus approach (option 1) because it is the easiest way to demonstrate the basic integration. In production environments, the OpenTelemetry Collector may be preferred when additional customization, routing, or centralized telemetry management is required.
1. Configure MySQL Telemetry
MySQL telemetry configuration has two layers:
1. Exporter settings
– Enable metrics
– Set the OTLP protocol
– Set the OTLP endpoint
– Configure TLS, headers, compression, or timeout if needed
2. Meter settings
– Enable or disable meter groups
– Set the meter frequency
– Define how often MySQL evaluates and exports each group
The exporter settings define where and how metrics are sent. The meter settings define which groups of metrics are enabled and how frequently they are evaluated.
Enable Metrics and Configure the OTLP Endpoint
MySQL telemetry settings are server system variables. The telemetry metrics variables are global and non-dynamic, so a practical approach is to persist the settings with SET PERSIST_ONLY, then restart MySQL so the values are applied at startup. MySQL documents that SET PERSIST_ONLY writes a variable setting to mysqld-auto.cnf without changing the current runtime value, which makes it suitable for variables that must be applied at server startup.
Run the following from a MySQL session using an account with privileges to persist global system variables:
SET PERSIST_ONLY telemetry.metrics_enabled = ON;
SET PERSIST_ONLY telemetry.otel_exporter_otlp_metrics_protocol = 'http/protobuf';
SET PERSIST_ONLY telemetry.otel_exporter_otlp_metrics_endpoint =
'<PROMETHEUS_HOST>:9090/api/v1/otlp/v1/metrics';
SET PERSIST_ONLY telemetry.metrics_reader_frequency_1 = 10;
SET PERSIST_ONLY telemetry.metrics_reader_frequency_2 = 60;
SET PERSIST_ONLY telemetry.metrics_reader_frequency_3 = 300;Replace <PROMETHEUS_HOST> with the hostname or IP address of the Prometheus server.
The telemetry.metrics_enabled variable controls whether telemetry metrics are collected, and its default value is OFF. MySQL supports http/protobuf and http/json for the OTLP metrics protocol, with http/protobuf as the default. The MySQL documentation also notes that gRPC is not supported for this metrics export setting.
Note: In this configuration example, do not include http:// in the endpoint value. Including the protocol prefix may result in an invalid endpoint such as:
http://http://...
After persisting the settings, restart MySQL:
sudo systemctl restart mysqldThen verify the active telemetry configuration:
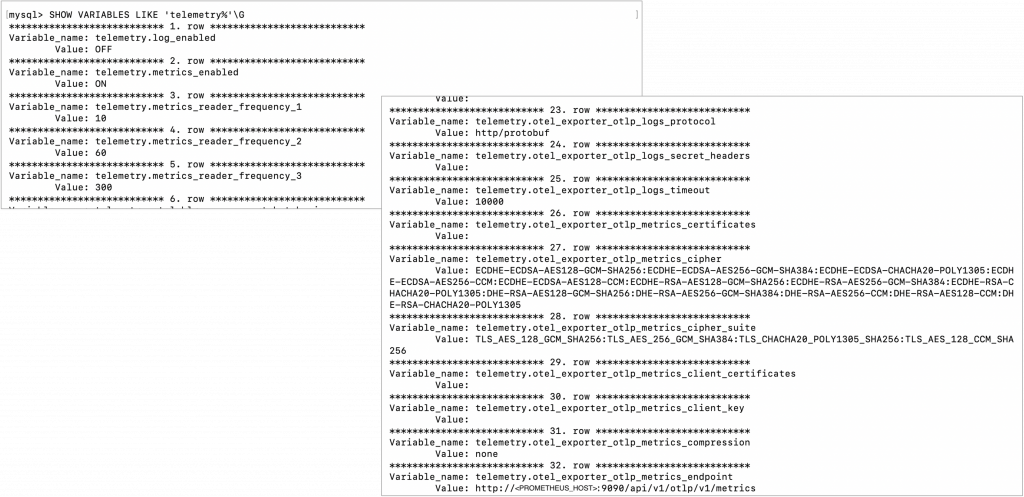
SHOW VARIABLES LIKE 'telemetry%';You can also narrow the output to the metrics-related settings:
SHOW VARIABLES LIKE 'telemetry.metrics%';

SHOW VARIABLES LIKE 'telemetry.otel_exporter_otlp_metrics%';
Expected values should include entries similar to:
telemetry.metrics_enabled                         ON
telemetry.metrics_reader_frequency_1              10
telemetry.metrics_reader_frequency_2              60
telemetry.metrics_reader_frequency_3              300
telemetry.otel_exporter_otlp_metrics_protocol     http/protobuf
telemetry.otel_exporter_otlp_metrics_endpoint     <PROMETHEUS_HOST>:9090/api/v1/otlp/v1/metrics
When you execute the SHOW VARIABLE, you will see the following results:
Understand MySQL Meter Groups
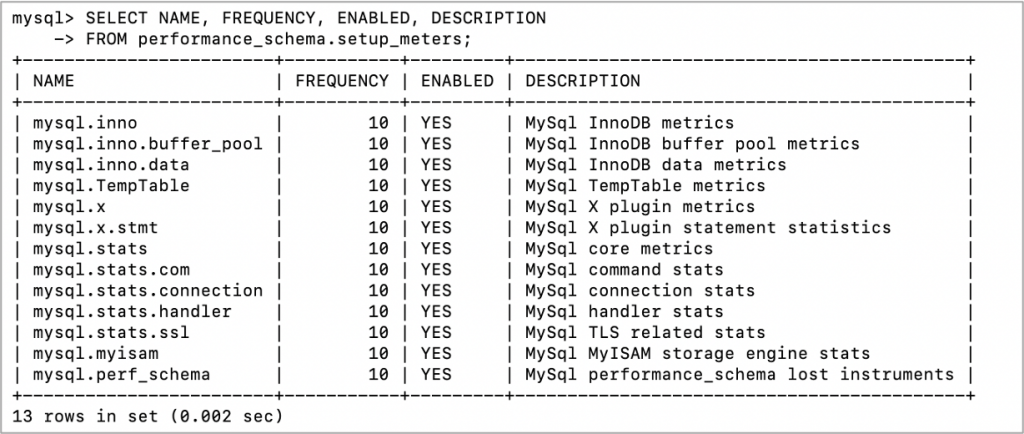
MySQL organizes server metrics into groups called meters. The available meter groups can be viewed from performance_schema.setup_meters, which includes each meter name, frequency, enabled status, and description.
SELECT NAME, FREQUENCY, ENABLED, DESCRIPTION
FROM performance_schema.setup_meters;
A meter group represents a related area of MySQL server behavior:
| Meter group | This provides |
| mysql.inno | General InnoDB metrics. This covers InnoDB engine-level activity and is useful for understanding storage engine behavior. |
| mysql.inno.buffer_pool | InnoDB buffer pool metrics. This helps monitor buffer pool usage and efficiency. |
| mysql.inno.data | InnoDB data metrics. This is useful for understanding InnoDB data file and I/O-related activity. |
| mysql.x | MySQL X Plugin metrics. This provides visibility into X Protocol activity. |
| mysql.x.stmt | MySQL X Plugin statement statistics. This helps monitor X Protocol statement activity. |
| mysql.stats | Core MySQL server metrics. This includes general server-level status and activity indicators. |
| mysql.stats.com | MySQL command statistics. This corresponds to command counters such as statement execution activity. |
| mysql.stats.connection | MySQL connection statistics. This helps monitor connection activity and connection-related behavior. |
| mysql.stats.handler | MySQL handler statistics. This provides insight into lower-level handler operations used by storage engines. |
| mysql.stats.ssl | TLS-related statistics. This helps monitor SSL/TLS usage and related activity. |
| mysql.myisam | MyISAM storage engine statistics. This is relevant for environments that still use MyISAM tables. |
| mysql.perf_schema | Performance Schema lost-instrument metrics. This helps identify cases where Performance Schema could not capture some instrumentation data. |
| mysql.mle | MySQL MLE component metrics. This provides visibility into MySQL MLE component activity. |
The key point is that MySQL telemetry is not just a single metrics stream. It is organized into meter groups, and those groups can be enabled, disabled, and tuned based on monitoring requirements.
Configure Metrics Reader Frequency
MySQL provides metrics reader frequency variables that define how often meter groups are evaluated and exported:
telemetry.metrics_reader_frequency_1
telemetry.metrics_reader_frequency_2
telemetry.metrics_reader_frequency_3
These values are defined in seconds. telemetry.metrics_reader_frequency_1 is mandatory and applies to meters whose FREQUENCY is less than or equal to that value. telemetry.metrics_reader_frequency_2 is optional and applies to meters whose FREQUENCY is greater than frequency 1 and less than or equal to frequency 2. telemetry.metrics_reader_frequency_3 is optional and applies to meters whose FREQUENCY is greater than frequency 2. The documented default for each is 10 seconds.
Example:
SET PERSIST_ONLY telemetry.metrics_reader_frequency_1 = 10;
SET PERSIST_ONLY telemetry.metrics_reader_frequency_2 = 60;
SET PERSIST_ONLY telemetry.metrics_reader_frequency_3 = 300;
With this configuration:
Meters with FREQUENCY <= 10 are evaluated every 10 seconds.
Meters with FREQUENCY > 10 and <= 60 are evaluated every 60 seconds.
Meters with FREQUENCY > 60 are evaluated every 300 seconds.
This allows fast-changing operational metrics, such as connection or core server activity, to be exported more frequently, while slower-changing metrics can be exported less often.
Tune Individual Meter Groups
The FREQUENCY and ENABLED values for meter groups can be edited in performance_schema.setup_meters. MySQL also supports configuring meters at server startup or in a configuration file using the –performance-schema-meter=’meterName=frequency:integer,enabled:ON|OFF’ syntax.
For example:
UPDATE performance_schema.setup_meters
SET FREQUENCY = 10, ENABLED = 'YES'
WHERE NAME = 'mysql.stats.connection';

UPDATE performance_schema.setup_meters
SET FREQUENCY = 60, ENABLED = 'YES'
WHERE NAME = 'mysql.inno.buffer_pool';

UPDATE performance_schema.setup_meters
SET FREQUENCY = 300, ENABLED = 'YES'
WHERE NAME = 'mysql.mle';
Or configure a meter at startup:
--performance-schema-meter='mysql.stats.connection=frequency:10,enabled:ON'The practical takeaway is:
performance_schema.setup_meters controls what groups of metrics are enabled and how they are categorized by frequency. telemetry.metrics_reader_frequency_* controls how often those groups are evaluated and exported through OTLP.
2. Configure Prometheus
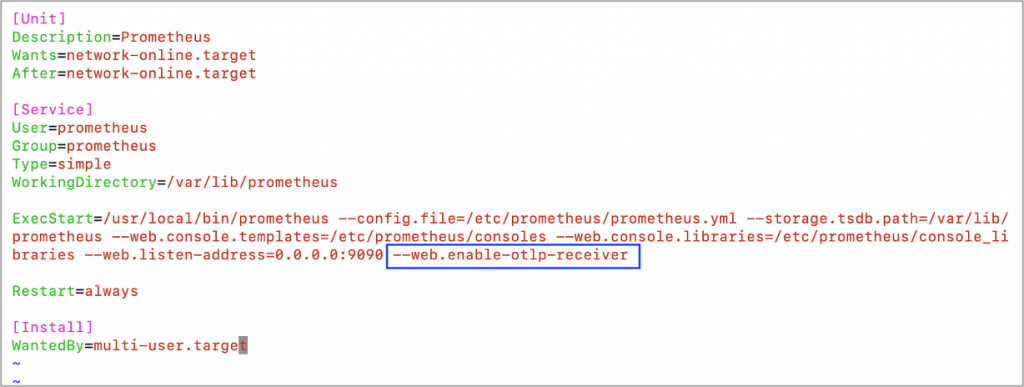
Prometheus must be started with the OTLP receiver enabled.
Startup option:
--web.enable-otlp-receiver
Example systemd configuration:
ExecStart=/usr/local/bin/prometheus \
  --config.file=/etc/prometheus/prometheus.yml \
  --storage.tsdb.path=/var/lib/prometheus \
  --web.listen-address=0.0.0.0:9090 \
  --web.enable-otlp-receiver
After restarting Prometheus, the OTLP metrics endpoint is available at:
/api/v1/otlp/v1/metrics
Prometheus documents that the OTLP receiver is disabled by default because Prometheus may run without authentication, so accepting incoming OTLP traffic should be an explicit configuration choice.
You can verify that the endpoint exists with:
curl http://localhost:9090/api/v1/otlp/v1/metricsA 405 Method Not Allowed response for a GET request is expected because the OTLP metrics endpoint receives metrics through POST.
3. Verify Metrics in Prometheus
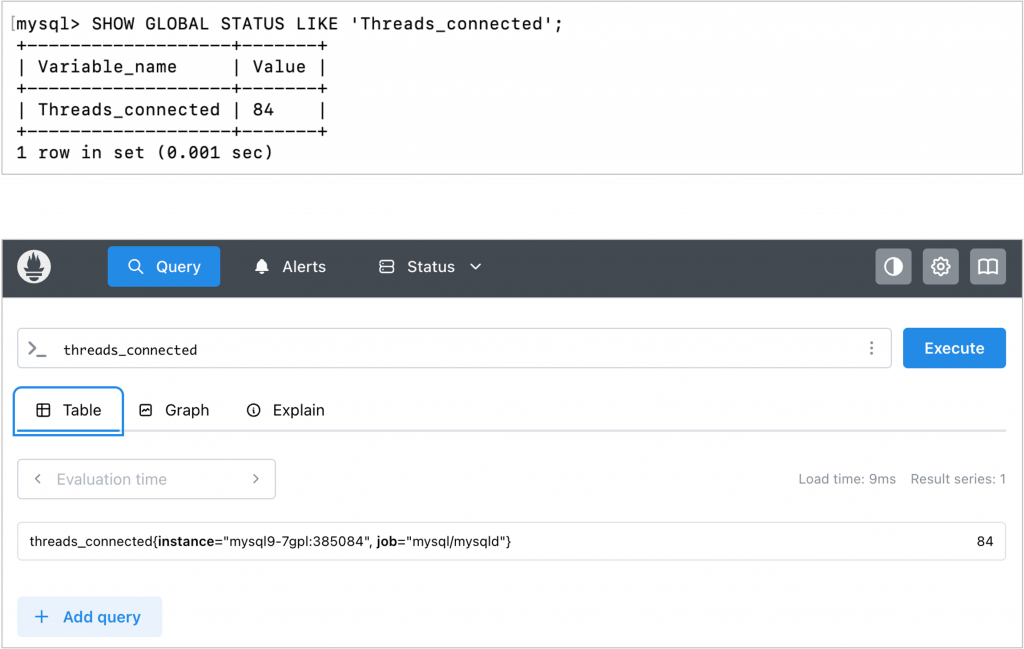
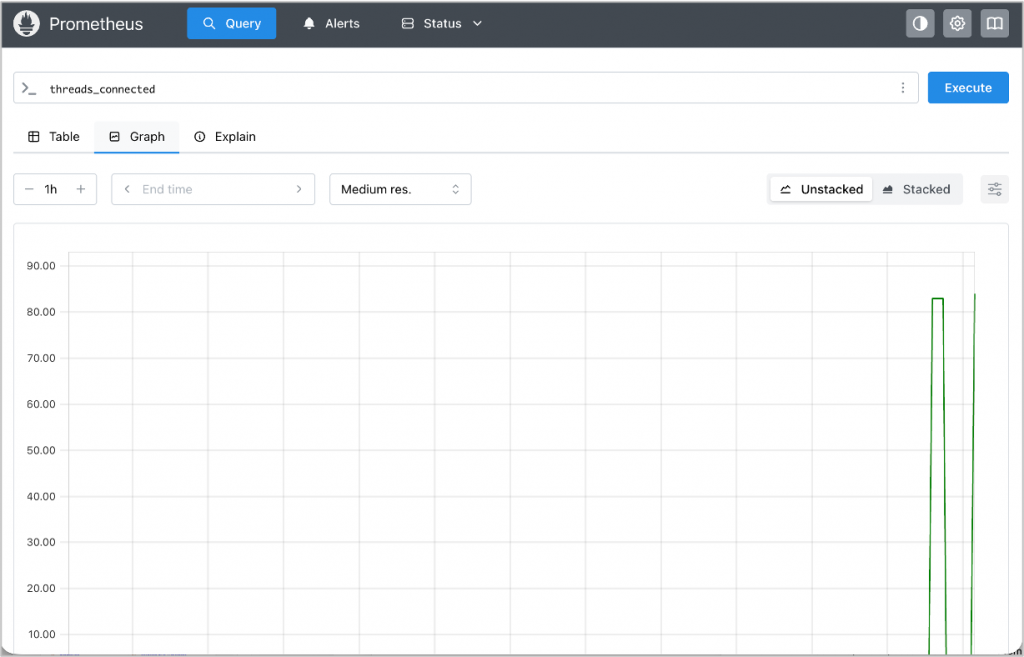
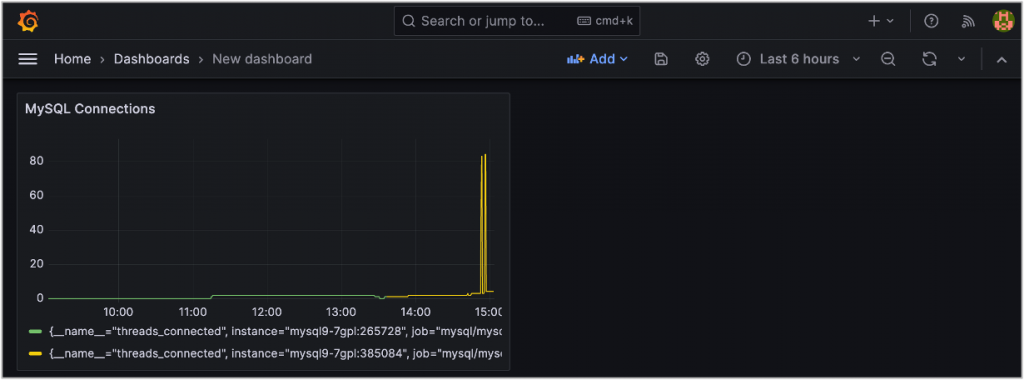
Open the Prometheus UI and run PromQL queries such as:
threads_connected
or:
max_used_connections
Then compare the values with MySQL status variables:
SHOW GLOBAL STATUS LIKE 'Threads_connected';
SHOW GLOBAL STATUS LIKE 'Max_used_connections';
If the values are visible in Prometheus and match the MySQL status output, the configuration is working.
Why the Telemetry Push Model Matters
The configuration above demonstrates more than a new way to send metrics to Prometheus. It also changes the monitoring model.
Traditional MySQL monitoring commonly uses a pull-based approach. An external exporter or collector connects to MySQL using a dedicated monitoring user, queries status variables or Performance Schema, and exposes those metrics for Prometheus to scrape.
MySQL Telemetry uses a push-based model. MySQL exports metrics directly to an OTLP endpoint, such as the Prometheus OTLP receiver.
For basic metrics collection, this can reduce the need to create a dedicated MySQL monitoring user, store database credentials in an external exporter, and allow additional inbound monitoring connections to MySQL.
This improves the security model in several ways:
- No dedicated MySQL monitoring user is required for basic metric export
Since metrics are exported directly by MySQL, there is less need to create a separate database account only for monitoring. - Database credentials do not need to be stored in an external exporter
Traditional exporters require credentials to connect to MySQL. With telemetry push, those credentials are no longer needed for this basic metrics path, reducing credential exposure and operational risk. - Inbound access to MySQL can be reduced
In a pull-based model, the exporter or collector must be able to connect into MySQL. In a push-based model, MySQL sends telemetry to a configured endpoint, which can simplify network access patterns. - The telemetry path can be secured independently
The OTLP endpoint can be protected using network controls, firewall rules, TLS where applicable, and access controls appropriate for the observability platform. - Credential management is simplified
Fewer database accounts and fewer externally stored secrets mean fewer credentials to rotate, audit, and protect.
This does not mean that security controls are no longer required. The Prometheus or OpenTelemetry endpoint must still be properly secured. However, removing the need for an external monitoring process to authenticate into MySQL can reduce credential-management risk and simplify the monitoring architecture.
Benefits of Using MySQL Telemetry with Prometheus
By adopting MySQL Telemetry with Prometheus, teams can simplify monitoring architecture and align MySQL observability with OpenTelemetry-based workflows.
Simple Prometheus Integration
Prometheus can receive OTLP metrics directly when the OTLP receiver is enabled. This allows MySQL metrics to be queried through PromQL and visualized in Prometheus-compatible dashboards.
Vendor-Neutral Telemetry
OpenTelemetry provides a vendor-neutral model for telemetry data. This gives teams more flexibility to route metrics to different backends or add the OpenTelemetry Collector later if requirements change.
Unified Observability
MySQL metrics can become part of a broader observability strategy that includes application metrics, traces, and logs. This helps teams investigate performance issues across the full application stack rather than looking at the database in isolation.
Simpler Architecture
For many use cases, MySQL can export metrics directly without requiring a separate MySQL exporter process. This reduces the number of moving parts that need to be installed, configured, secured, and maintained.
Flexible Production Architecture
Teams can start with direct export from MySQL to Prometheus for a simple setup. As requirements grow, they can introduce the OpenTelemetry Collector to customize, process, and route telemetry data.
Tunable Metric Collection
MySQL meter groups and metrics reader frequency settings allow teams to control what categories of metrics are enabled and how frequently they are evaluated and exported.
When to Continue Using mysqld_exporter
MySQL Telemetry is a strong step forward, but it is not always a complete replacement for existing monitoring tools.
Traditional tools such as mysqld_exporter may still be better suited for:
- Existing Prometheus dashboards and alerts built around exporter metric names
- Replication-specific monitoring
- More detailed SQL or Performance Schema analysis
- Environments where pull-based Prometheus scraping remains the preferred model
In practice, many teams may choose a hybrid approach: use MySQL Telemetry for OpenTelemetry-based observability while continuing to use mysqld_exporter for specialized MySQL operational metrics.
Conclusion
MySQL OpenTelemetry metrics provide a modern way to bring MySQL observability into Prometheus.
The simplest architecture is direct export from MySQL to the Prometheus OTLP receiver. This allows teams to configure MySQL metrics export, verify results in Prometheus, and begin building dashboards and alerts.
For more advanced deployments, the OpenTelemetry Collector can be introduced between MySQL and Prometheus. This provides additional capabilities such as filtering, enrichment, batching, routing, transformation, and multi-backend export.
This approach gives teams a practical path forward:
- Start simple with direct MySQL-to-Prometheus OTLP export
- Add the OpenTelemetry Collector when more customization is required
- Use
SET PERSIST_ONLYto persist MySQL telemetry settings for startup - Verify telemetry configuration with
SHOW VARIABLES LIKE 'telemetry%'; - Tune MySQL meter groups and metrics reader frequency based on monitoring needs
- Reduce reliance on external database credentials for basic metrics collection
- Build toward a more unified OpenTelemetry-based observability architecture
As observability continues to evolve, MySQL Telemetry represents an important step toward simpler, more flexible, and more secure monitoring for MySQL.