We are excited to announce the availability of new observability add-ons for OCI Kubernetes Engine (OKE). This capability helps customers observe the health and resource usage of worker nodes and key Kubernetes infrastructure components, while also providing OKE better visibility into the cluster data plane to detect and address problems sooner.
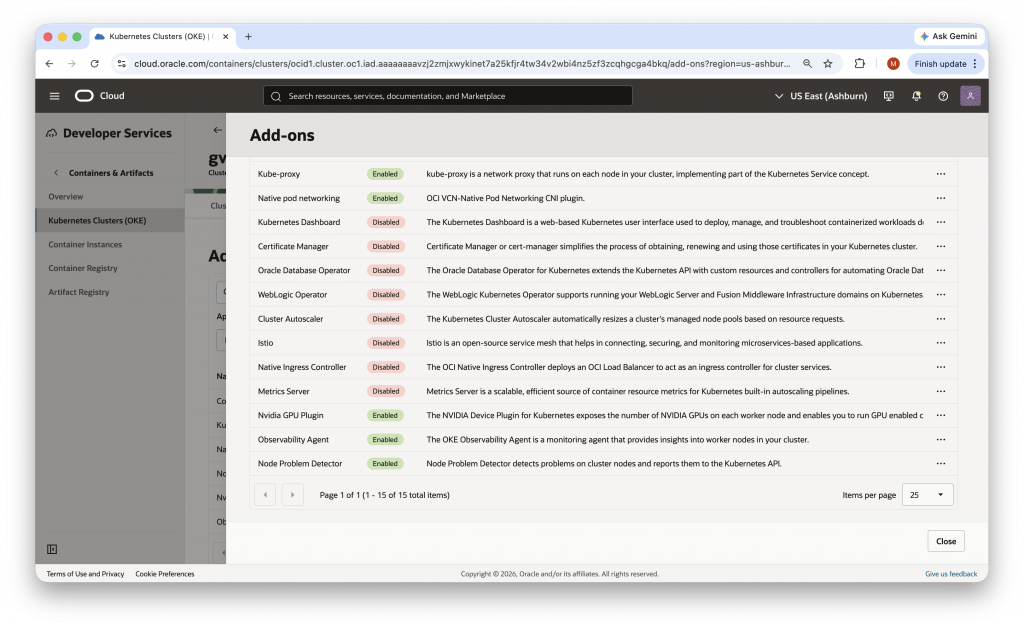
- The ObservabilityAgent add-on collects infrastructure metrics from sources including kubelet, cAdvisor, CoreDNS, and kube-proxy.
- The NodeProblemDetector add-on identifies and surfaces issues such as resource saturation and network problems at the worker node level.
Together, these add-ons improve the shared responsibility model for Kubernetes operations by shifting more of the operational burden from customers to the OKE service. The result is better out of the box visibility into the cluster data plane, less work for customers who would otherwise need to build and maintain their own node health tooling, and ultimately improved worker node availability.
Why did we build this?
Operating Kubernetes reliably requires visibility into more than just application-level telemetry. Many cluster issues begin in the data plane, including on the worker nodes themselves, or in critical node-level services such as DNS, networking, and the kubelet. When the signals to identify those issues are missing, customers are left diagnosing node issues reactively after workloads are already impacted.
Our goal for this feature is to reduce time to resolution and the burden of customers operating their own solutions, all with the aim of improving data plane reliability. By collecting relevant infrastructure metrics and health signals needed to understand worker node behavior, OKE on-call operators gain better visibility into the data required to detect, troubleshoot, and proactively resolve data plane problems. This visibility helps improve cluster availability while reducing the amount of custom operational software customers need to deploy and manage on their own.
What are the observability add-ons?
The observability add-ons enable you to observe health and resource usage by collecting operational and resource metrics from each worker node. They enable you to proactively detect and troubleshoot potential issues and anomalies before workloads are affected.
The ObservabilityAgent add-on focuses on infrastructure telemetry. It collects metrics related to container and pod CPU, memory, and network usage from kubelet and cAdvisor, along with CoreDNS request and error metrics and kube-proxy service networking statistics. These metrics are exposed through standard interfaces compatible with common monitoring tools, including Prometheus-compatible tooling.
The NodeProblemDetector add-on complements those metrics with node health intelligence. It surfaces worker node issues and events that indicate underlying problems, including resource pressure and networking-related failures. This information helps close the gap between raw utilization data and actionable signals about node health. An important design goal for NodeProblemDetector was to avoid disrupting customers who already run their own node health tooling. The managed configuration is designed to avoid conflicts with existing deployments of Node Problem Detector or similar tools.
Built for managed operation
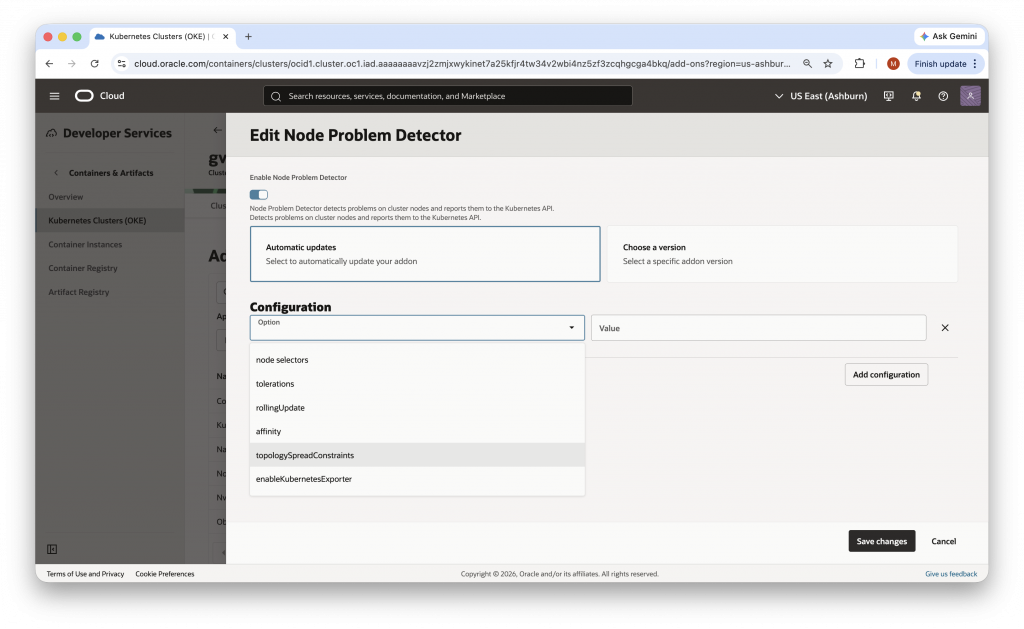
These new observability capabilities are delivered through OKE cluster add-ons, software tools that support and extend the functionality of Kubernetes clusters. They can be managed using the same add-on controls already used for other cluster software, including the ability to enable or disable the add-ons, choose automatic updates managed by Oracle, or pin to a specific supported version when greater change control is required, and specify additional configuration arguments. These add-ons are essential, which means they are enabled by default. For those who prefer not to opt out of data collection, specific labels can be added to worker nodes to disable observability collection.
These observability add-ons are designed to be lightweight. They are configured to use minimal resources and are assigned a low scheduling priority so that system services and customer workloads remain the primary consumers of worker node capacity. OKE supports common configuration arguments for both add-ons, including placement-related settings such as affinity, node selectors, tolerations, and topology spread constraints. The ObservabilityAgent also supports add-on specific configuration of the metrics and health check ports, while NodeProblemDetector includes an option to enable its Kubernetes exporter.
Better visibility, less operational toil
This release is about more than collecting useful metrics. It provides customers a simpler operational experience and gives OKE the visibility needed to be a more effective managed Kubernetes service. Better insight into worker node health helps shorten time to detection, improve diagnosis, and support more proactive data plane operations. At the same time, customers no longer need to build and maintain their own solution just to gain basic insight into node-level health and infrastructure behavior.
We believe this shift is an important step toward reducing operational overhead in OKE while improving service reliability. As we continue investing in managed cluster operations, visibility into the data plane will remain a key part of helping customers run Kubernetes more confidently on OCI.
Learn more
- Observing Worker Node and Add-on Health
- ObservabilityAgent Configuration Arguments
- NodeProblemDetector Configuration Arguments
- Get started with Oracle Cloud Infrastructure today with our Oracle Cloud Free Trial