Introducing SQL Performance Watch
Oracle Cloud Infrastructure SQL Performance Watch is a cloud-native pay-as-you-go solution that enables rapid and cost-effective adoption of database infrastructure and technology changes. It helps IT teams proactively assess the impact of changes on the performance of the database. SQL Performance Watch is designed to predict and prevent SQL execution performance issues caused by system changes whether the databases are deployed on-premises, cloud, or in hybrid environments. SQL Performance Watch helps make security, code, and patch updates as well as other lifecycle changes seamless and maintain predictable database performance—the same or better than before these changes are deployed on the system. In other words, no more guessing and delaying security or software updates due to fears about interruptions or delays.
SQL Performance Watch enables DBAs, IT managers, and developers to proactively manage performance challenges for typical environmental changes such as:
- Database upgrades or patch sets
- Platform migrations including Exadata, cloud, etc.
- Refreshing optimizer statistics
- Modifying optimizer-related parameters
- Access structures additions/deletions (indexes, materialized views, etc.)
SQL Performance Watch complements the performance diagnostics and tuning capabilities of OCI Database Management service. By integrating SQL Performance Watch’s insights with the existing diagnostic tools, customers can effectively implement and validate the changes recommended by SQL Performance Watch.
Key capabilities of SQL Performance Watch
- Provides a global view of environment change impact by key performance metrics as well as fine-grained drill down into SQL execution plans and statistics
- Performs comprehensive workload analysis by running SQL statements in isolation with production system optimizer context and binds before and after the changes
- Identifies SQL statements that have had their performance regress, improve, or not be impacted by the change
- Details execution plan statistics and recommendations for optimizing any regressed SQL statements
- Proactively manages system change-related performance challenges for optimal database health

SQL Performance Watch use cases
- Assessing system changes by database administrators or DevOps
- Assess the impact of various system changes (listed above) impacting SQL performance
- Detect workload changes with a minor version update of an application – impact of new or missing application SQL on performance
- Analyzing workload performance across two time periods on same or different databases to derive performance insights by developers or AIOps
- Track workload drift – Improved, Regressed, New, and Missing SQL
- Plan changes and impact on performance
SQL Performance Watch navigation and key features
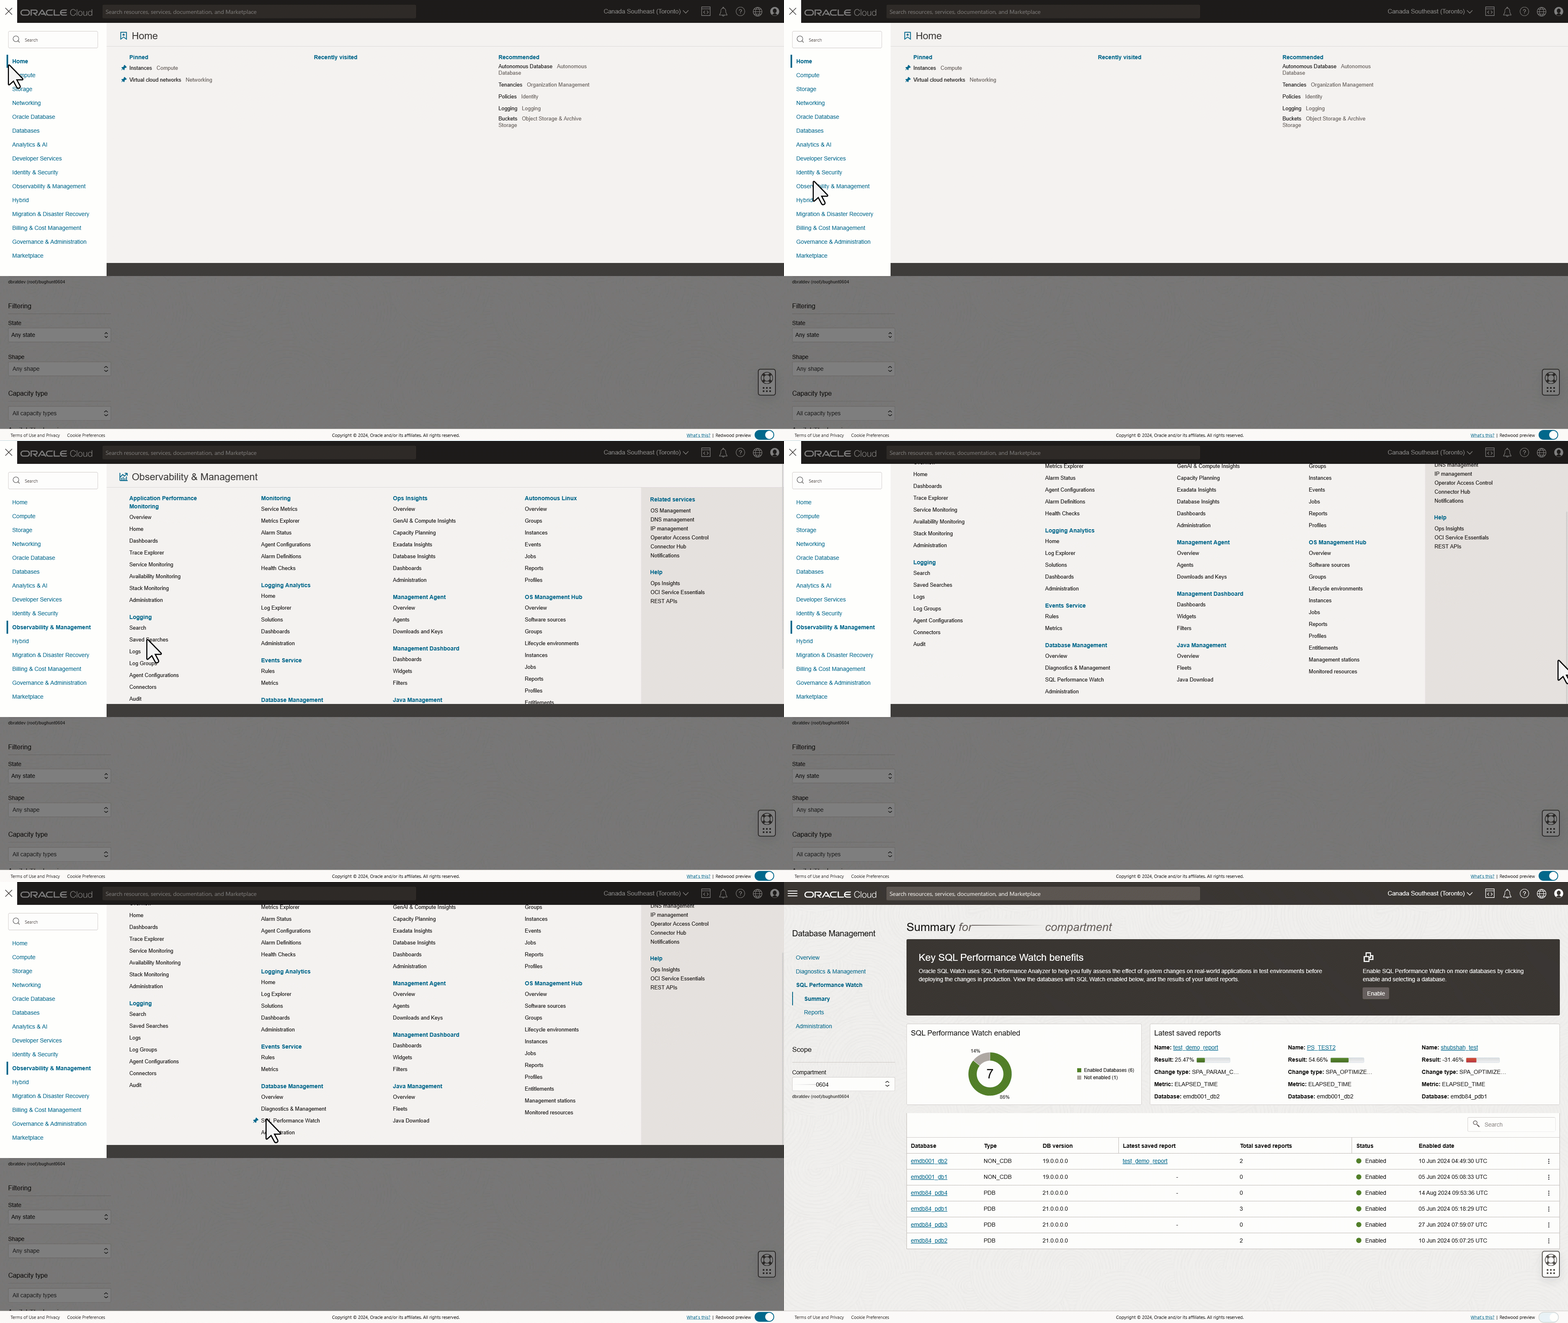
SQL Performance Watch is part of the OCI Database Management service and can be found under the Observability and Management menu in the OCI console. In a matter of minutes, you can submit SQL Performance Watch task to assess the impact of upgrades or other changes.
Key features
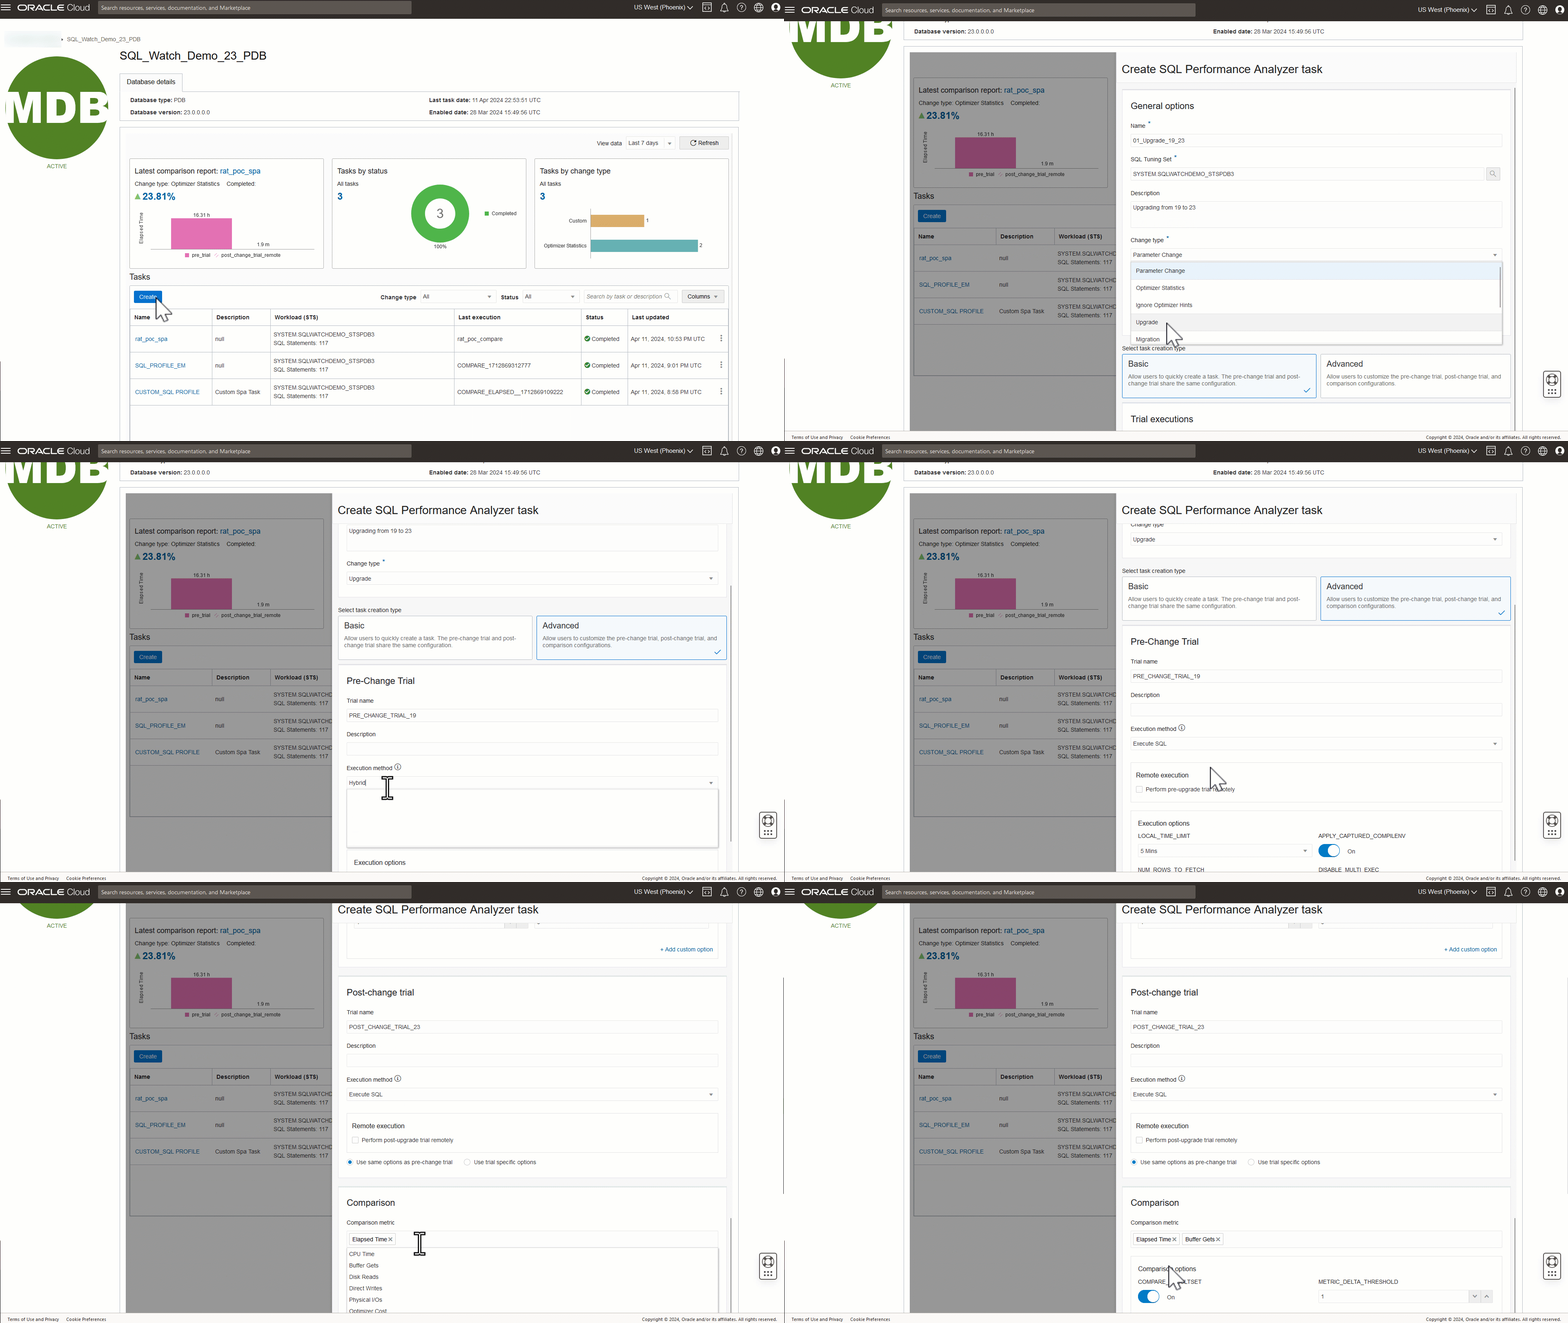
- Pre-defined and optimized workflows for different change types such as Upgrade/Migration, Parameter change, Optimizer Statistics, Ignore Optimizer Hints, and Custom
- Basic options (default) at SQL Performance Watch task level and customization of task parameters with Advanced Settings
- Support for pre- and post-trial configurations
- SQL trial execution type: Build from STS (Convert to STS), Hybrid, Execute SQL locally and remotely via Database Links, Generate Explain Plans
- Trial parameters: Local per SQL Time limit, Execute DML, etc.
- Comparison metrics: Elapsed time, Buffer gets, CPU time, User I/O time, Disk reads, Direct writes, Physical I/O, etc.
- Comparison report by multiple metrics generated highlighting the net impact of the change on the workload, errors, unsupported SQL, and per-SQL impact on execution plans and performance

Upgrade/migrate to Oracle Database 23ai with more confidence
With all the excitement surrounding Oracle Database 23ai, get a head start on the upgrade process using SQL Performance Watch. Here is an example of how to leverage SQL Performance Watch for a database upgrade or migration:
- Start with two copies of the production database in a test/stage environment using export/import (or other supported mechanisms). Let’s call them TestDB1 and TestDB2. Use these installations to compare before and after scenarios of the production database using SQL Performance Watch.
- Capture a representative workload of interest (peak time periods) into a SQL Tuning Set (STS) on the production database.
- Upgrade one of the clone databases (let’s say TestDB2) to DB 23ai, import the captured STS, and name it TEST23ai.
- Create a SQL Performance Watch task using the same user or another user that has the same privileges as the STS owner.
- Use TEST23ai as the SQL Performance Analyzer (SPA) orchestration system.
- Must be the highest database version involved in the trials
- The database link already exists or is created during the task (if running remote trials)
- The workload schema (data) exists on the pre-trial and post-trial databases (through the copy or export mechanism) and STS imported into the orchestration system
- Run the trials with pre-change trial (TestDB1) and post-change trail (TEST23ai) with the change type as UPGRADE on SQL Performance Watch.
- Compare both trials to identify any regressions during the upgrade.
Supported versions
SQL Performance Watch currently supports the following releases of external (on-premises) databases:
- Oracle Database 23ai
- Oracle Database 21c
- Oracle Database 19c
- Oracle Database 11.2.0.4 to 18c
SQL Performance Watch support for cloud databases is planned for future releases.
