OCI Stack Monitoring Service (Stack Monitoring) continues to grow its list of supported resource types. We are pleased to announce Stack Monitoring has added Windows Server and Solaris monitoring to the list of Linux hosts already in support. Stack Monitoring has also extended its monitoring of PeopleSoft with the addition of Process Monitor and Elasticsearch.
Getting started with Peoplesoft application and Stack Monitoring
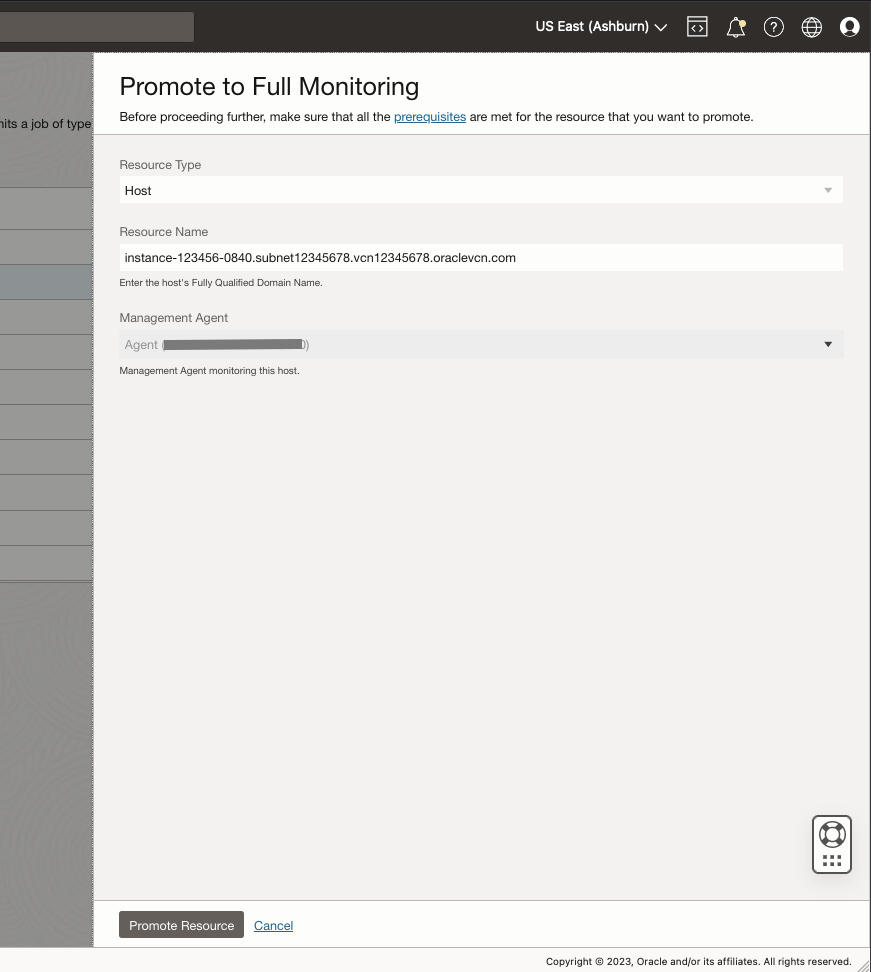
The first step to monitoring a PeopleSoft application is to promote the host to full monitoring. Stack Monitoring makes getting started with monitoring easy with host promotion. Simply install a Management Agent on the host you wish to monitor, Linux, Windows Server, or Solaris, and Stack Monitoring will prepare a promotion job once the agent is installed. To submit the promotion job, simply navigate to Stack Monitoring’s promotion UI, find the host you wish to monitor and click the Promote link. A slide-out will appear, review the Resource Name to ensure the name is the host’s fully qualified domain name, and click Promote Resource.
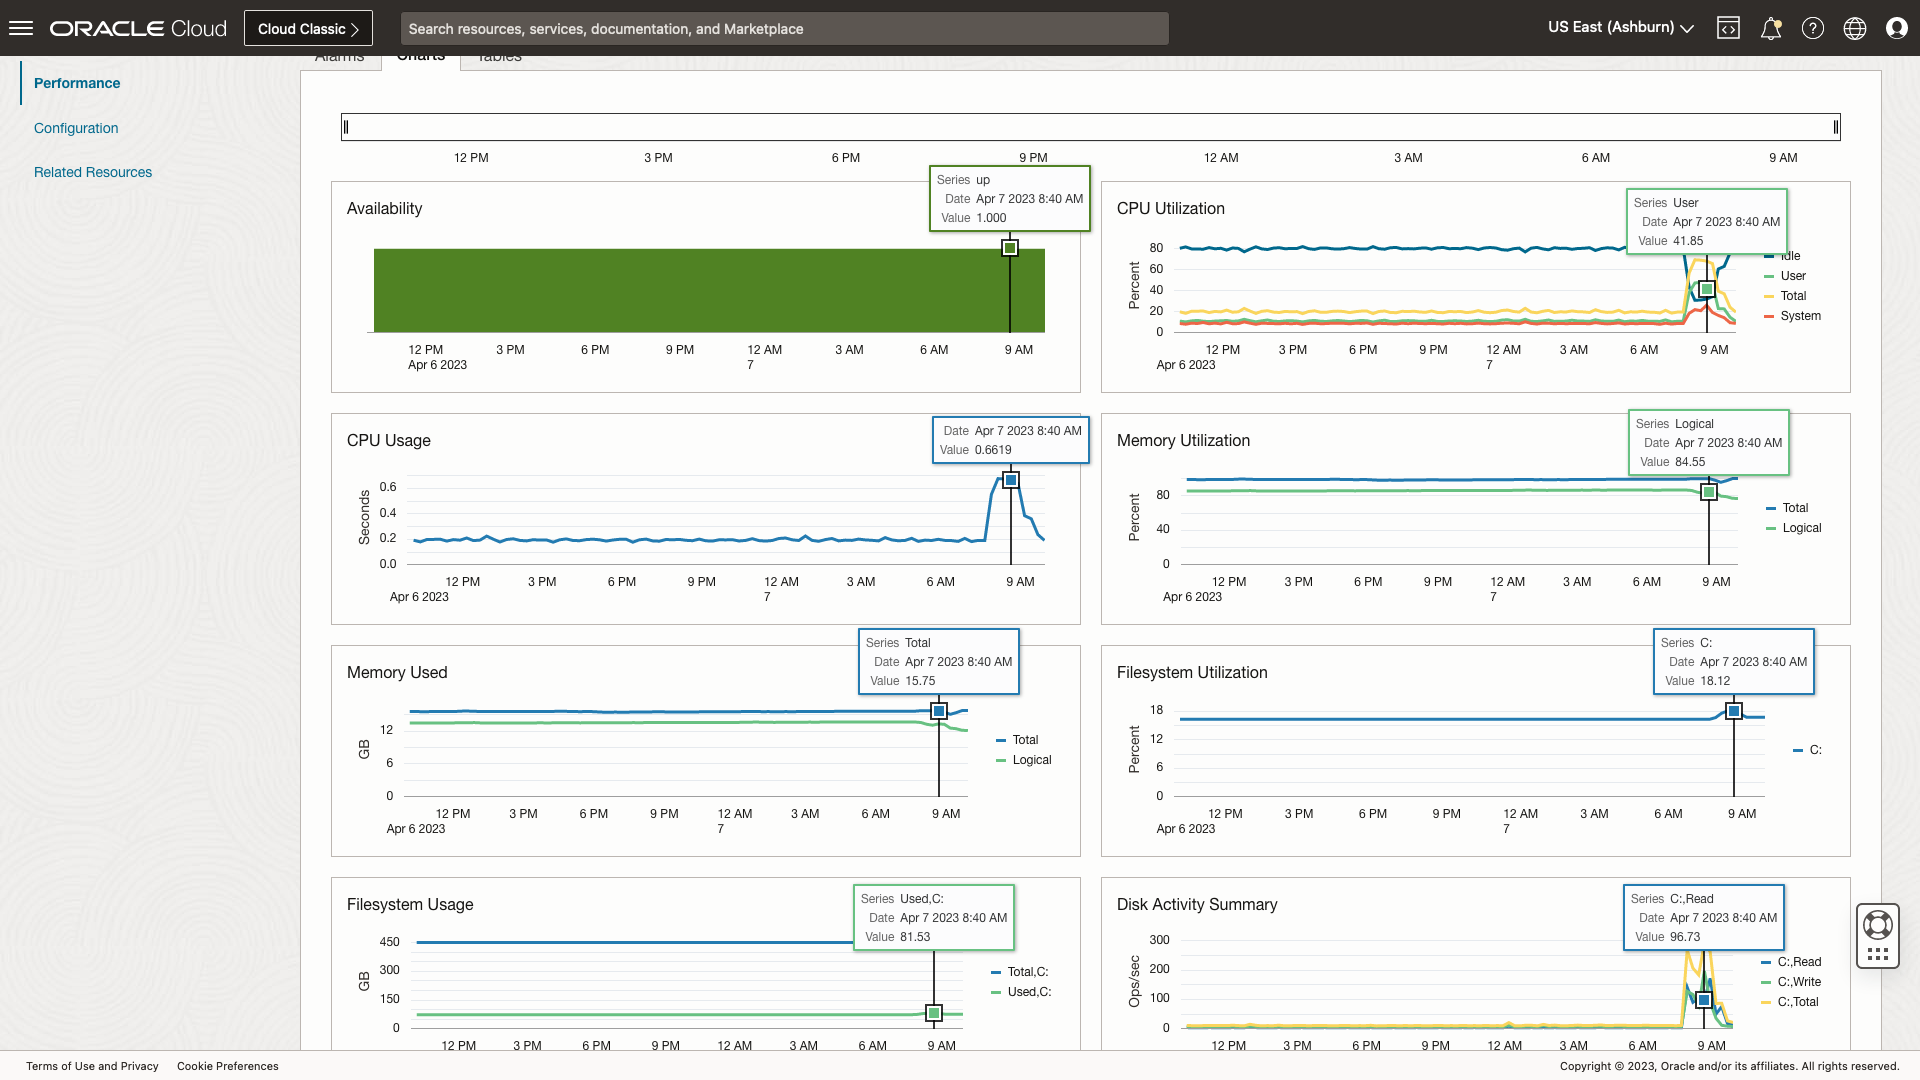
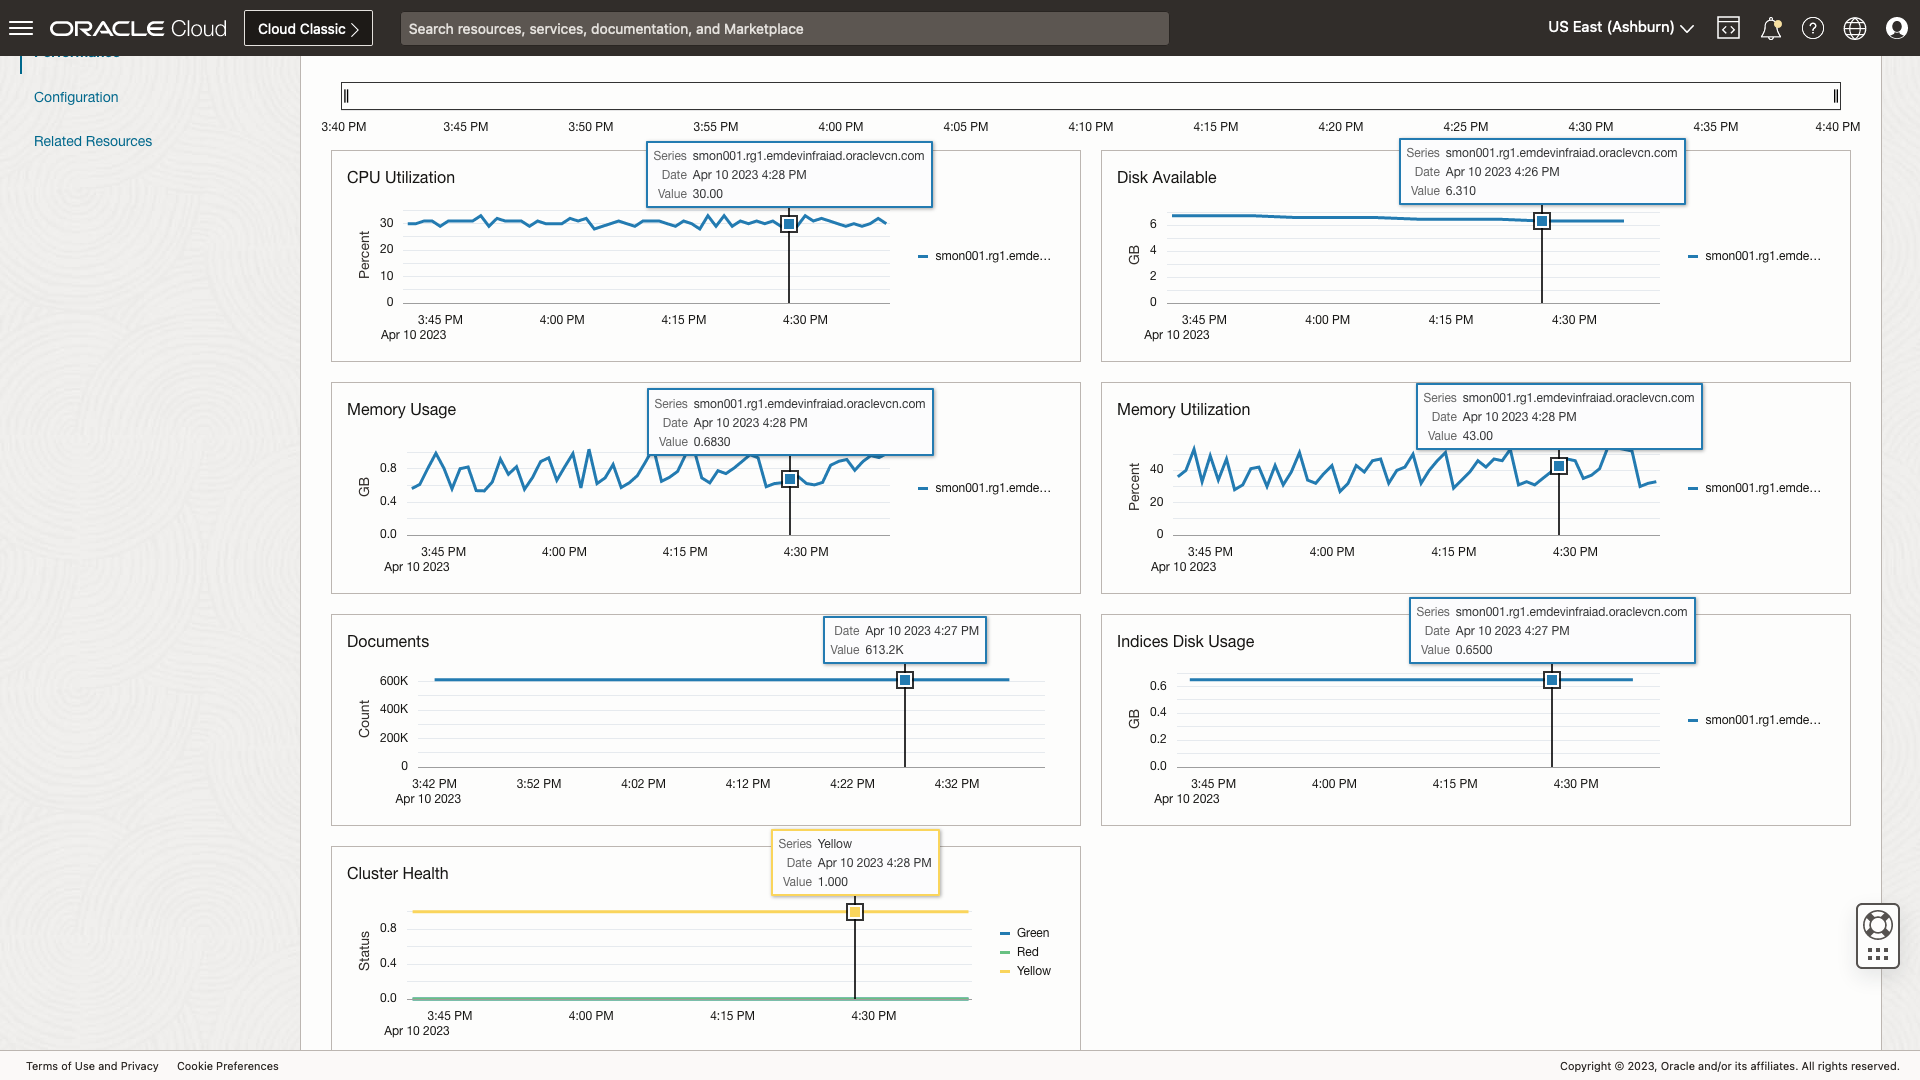
Within minutes monitoring for the Windows Server, Solaris, or Linux host will begin. The promotion job will create a unique homepage for each host and begin collecting metrics. For example, Figure 2 shows a Stack Monitoring homepage for Windows Server. These charts provide easy identification of the availability of the Windows Server, and any changes to CPU utilization. Users can quickly identify when CPU peaks, and if the peak is attributed to User or System CPU. Additionally, users can review other metrics including disk activity to determine if there is a spike in disk read and/or writes that may be impacting latency.
With the hosts such as Solaris or Windows Server, running the PeopleSoft application and Oracle Databases promoted, the next step is to discover the databases in which the PeopleSoft application schema resides. Discovering the database prior to discovering a PeopleSoft application allows Stack Monitoring to automatically build the topology between the application and the database. Once the database is discovered, the final step is to discover the PeopleSoft application.
Discovering a PeopleSoft application, including Process Monitor and Elasticsearch
Monitoring an entire PeopleSoft application stack is easy with Stack Monitoring’s discovery UI. From within the resource discovery page, click Discover New Resource, and a slide-out will appear. From the drop-down, select PeopleSoft Application. Then simply fill in the blanks, such as the PeopleSoft application name, database credentials, and decide if you want to monitor the PeopleSoft Process Monitor and Elasticsearch. When monitoring Elasticsearch the monitoring credentials must be provided. With all the other fields completed, click Discover New Resource at the bottom left of the slide-out.
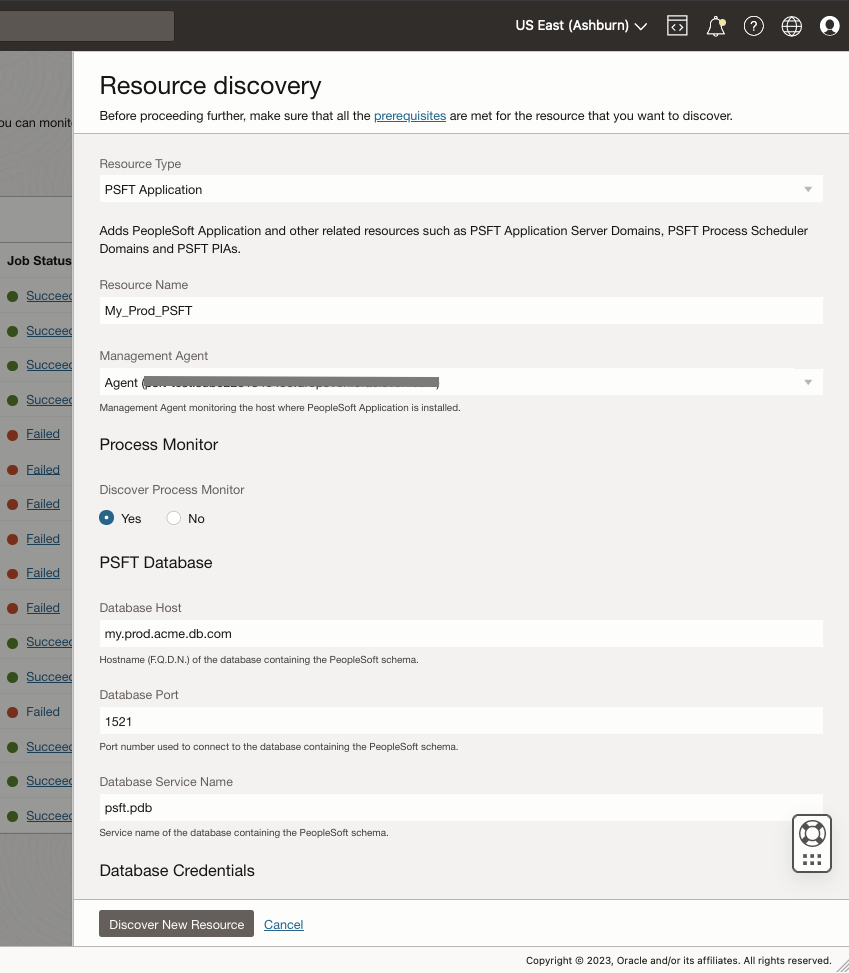
Stack Monitoring will begin discovering the PeopleSoft application, application topology, and its underlying components including Elasticsearch and the PeopleSoft Process Monitor. The status of the discovery job progress may be viewed by clicking the Executing link under the column Job Status. The discovery job may take several minutes to complete. If for any reason the job fails, click the link Failed to see more information on why the job failed. Once the reason for the failure has been resolved, click Retry. Retry, will once again initiate the slide-out, where all the fields will be prepopulated except usernames and passwords.
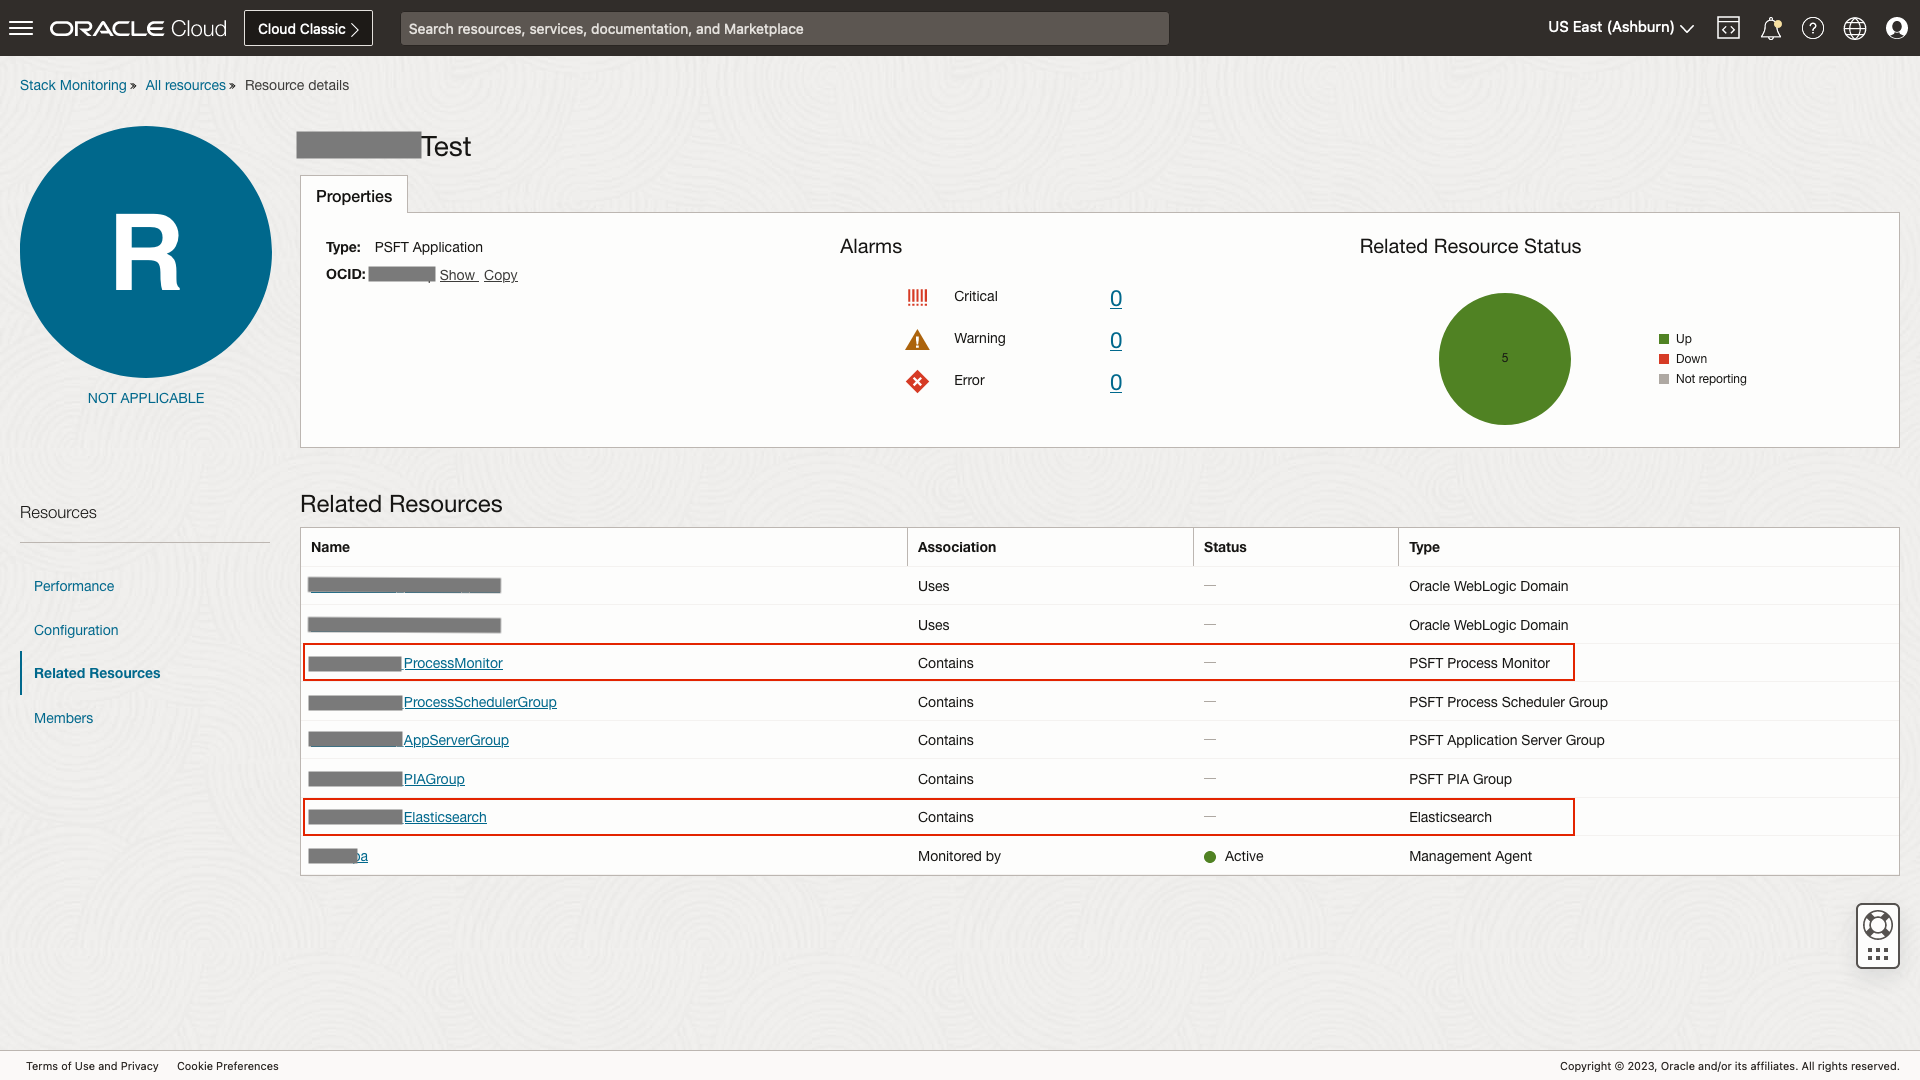
Once the discovery completes, Stack Monitoring will immediately begin collecting metrics on PeopleSoft and the underlying components. Utilizing Stack Monitoring’s topology, navigating up and down the PeopleSoft application stack is quick and easy. To navigate to the new ElasticSearch or Process Monitor homepage simply click the PeopleSoft application’s name in the job results to navigate to the PeopleSoft application’s homepage. From the homepage, navigate to Related Resources to view the PeopleSoft application topology and links to the underlying components, (e.g. Elasticsearch, Process Monitor) and tech stack, (e.g. Oracle Database, WebLogic Server).
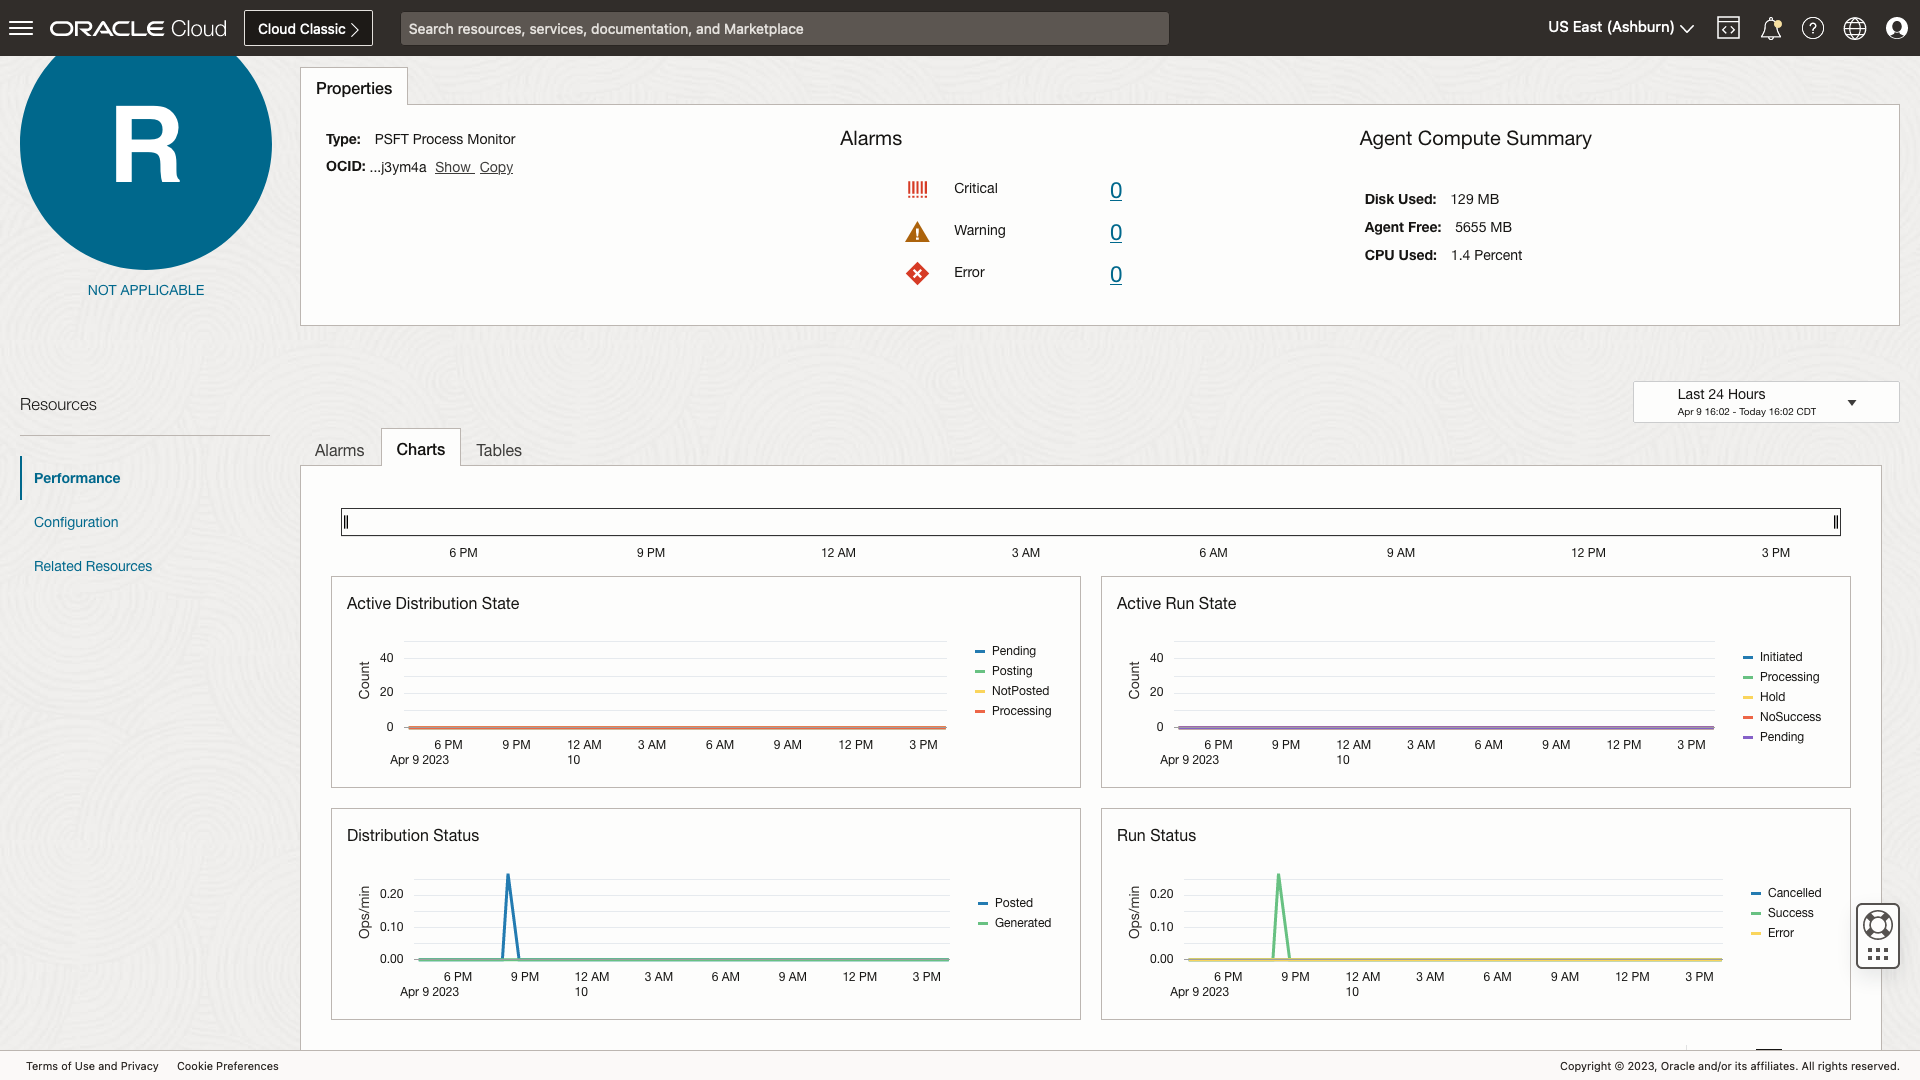
Clicking the Process Monitor’s name will navigate to the Process Monitor homepage. From the homepage, easily review any open alarms or identify any performance problems using charts. Charts provide a curated set of metrics for each resource type needed to effectively monitor a resource. For example, when monitoring a PeopleSoft Process Monitor you can review processes for any errors using the Run Status chart or review a count of running processes on hold using the Active Run State chart.
To review the health and performance of another PeopleSoft component such as Elasticsearch, click Related Resources, and select the name of the PeopleSoft application to which this Process Monitor belongs. Once on the Related Resources of PeopleSoft, select the Elasticsearch resource.
PeopleSoft Elasticsearch homepage provides critical details into the performance of Elasticsearch. Stack Monitoring allows for easy identification of cluster health shared allocation using the Cluster Health chart. For example, if the chart denotes a spike in yellow, this indicates that the primary shard is allocated but replicas are not.
With this release, Stack Monitoring has broadened PeopleSoft support to include both Process Monitor and Elasticsearch. With Stack Monitoring’s UI-driven discovery and out-of-the-box metrics, monitoring your entire PeopleSoft stack including the tech stack is easy. With the combination of PeopleSoft resources and the support for Windows Server and Solaris, there has never been a better time to start monitoring with Stack Monitoring.
For more information on monitoring hosts, PeopleSoft or other Stack Monitoring capabilities, see our recent blogs.