


Intermittent database connection failures can interrupt transactions, delay processing, and involve several teams in the same investigation. You need to identify the affected resources, understand what happened, and decide where to investigate next.
For Oracle Database@AWS, the evidence can span AWS monitoring signals and diagnostic files distributed across database nodes. Retrieving those files individually and comparing their timestamps adds work before diagnosis can begin.
Oracle Cloud Infrastructure (OCI) Log Analytics brings collected diagnostic logs into a common analysis environment. Database and infrastructure teams can examine errors across instances, compare related events, and share supporting records. This helps you spend less time gathering evidence and more time investigating the issue.
Consider an application reporting intermittent connection failures. Is the problem isolated to one database instance? Did a listener report connection errors? Did a cluster service change during the same period? This blog introduces a collection and investigation workflow for Oracle Database@AWS deployments using Exadata Database Service on Dedicated Infrastructure (ExaDB-D).
How the solution works
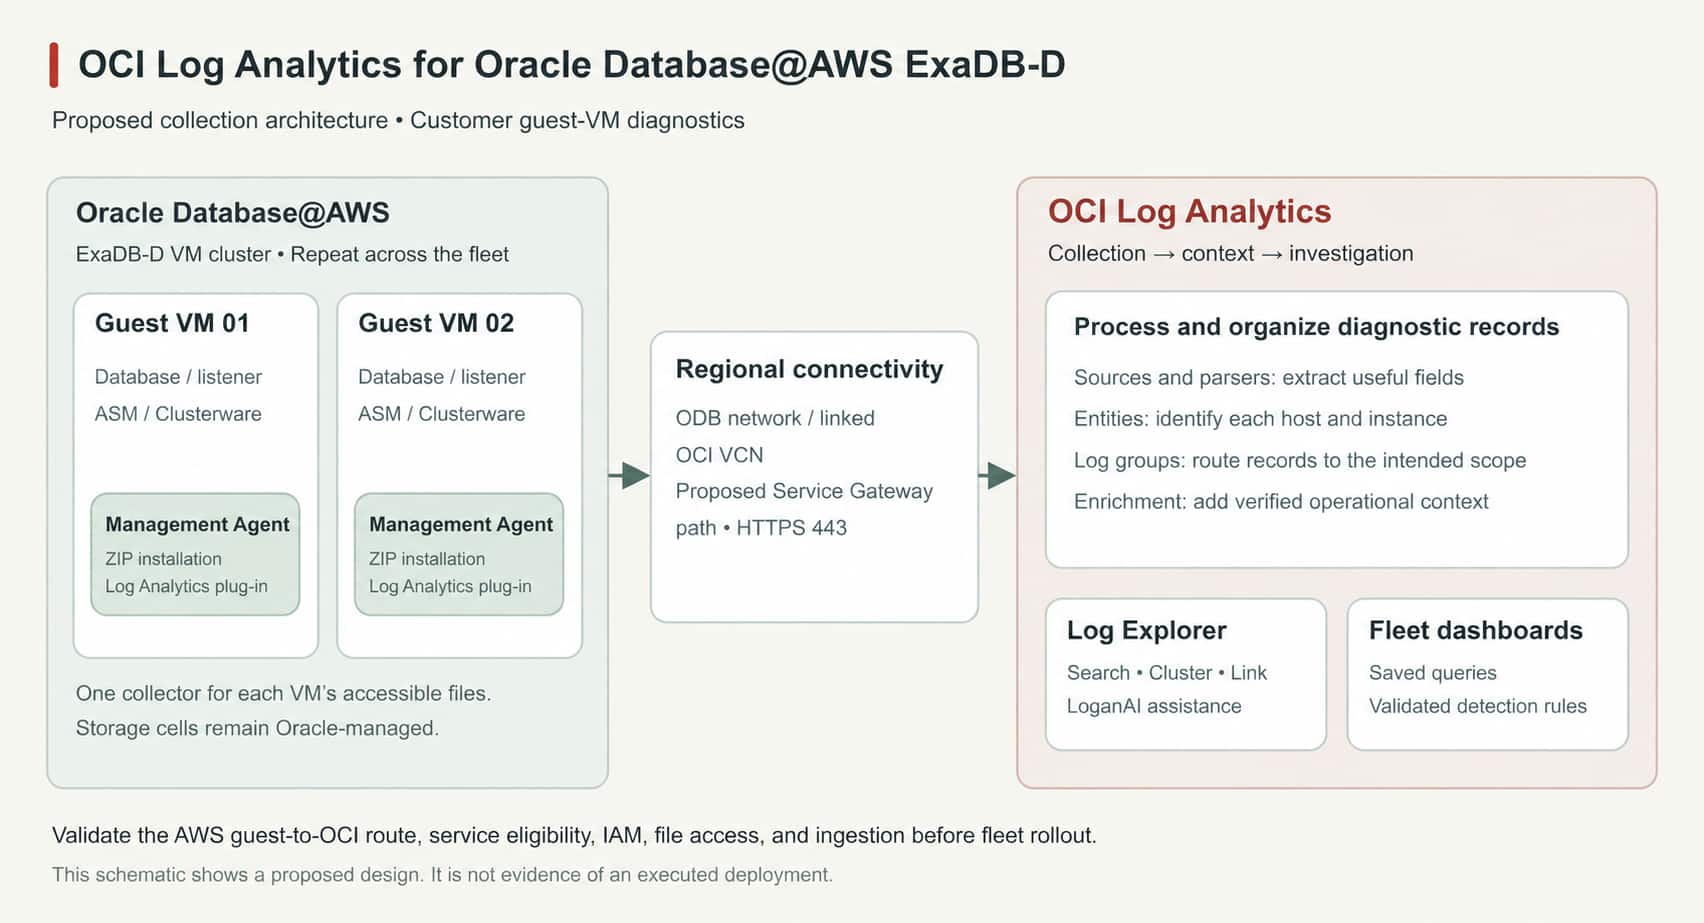
Collection starts on the customer-accessible database guest virtual machines (VMs). An OCI Management Agent with the Log Analytics plug-in runs on each VM whose local diagnostic files you need to collect. It reads authorized files and sends their records to OCI Log Analytics. The collection scope is the diagnostics accessible from those guest VMs.
Within Log Analytics, sources define collection and processing, parsers extract searchable fields, and entities identify the resources producing the logs. Correct source and entity associations preserve the instance and component context needed when comparing records across a fleet. See Log Analytics.
AWS monitoring provides complementary context. Amazon CloudWatch supports metrics, dashboards, and alarms, while Oracle Database@AWS lifecycle events delivered through Amazon EventBridge help establish resource changes. Use these signals to identify the incident window, then examine the relevant diagnostic records. Collecting guest-VM files does not automatically ingest CloudWatch telemetry. See the AWS monitoring overview and Oracle Database@AWS events.
Set up continuous log collection
Begin with one VM cluster and validate the collection pattern before expanding across your fleet.
- Prepare the OCI destination and access. Configure Log Analytics, the destination log group, and the required OCI Identity and Access Management (IAM) permissions. Verify connectivity from the guest VMs to the required OCI service endpoints.
- Deploy and configure collection. Install the Management Agent with the Log Analytics plug-in on each relevant guest VM and grant it read access to the required files. Follow Oracle’s documented Exadata installation guidance, which specifies the Linux ZIP installation method on an external volume.
- Associate sources and verify records. Configure the appropriate sources, diagnostic paths, and entities. Confirm that records arrive from every intended node with the expected timestamps and resource associations. Review collection warnings and resolve gaps before relying on dashboard results.
For the connection-failure example, establish database alert, listener, Clusterware, and Automatic Storage Management (ASM) log coverage. Clusterware and ASM are components of Oracle Grid Infrastructure. Add audit or trace collection according to your investigation requirements. Oracle’s continuous collection workflow describes the configuration steps.
What OCI Log Analytics offers
Oracle-defined dashboards provide starting points for different investigation questions. Select the appropriate log group, resource scope, and incident time range. Each dashboard requires its corresponding data; collecting alert logs alone does not populate audit or trace analysis. See Oracle-defined dashboard guidance.
Identify affected databases
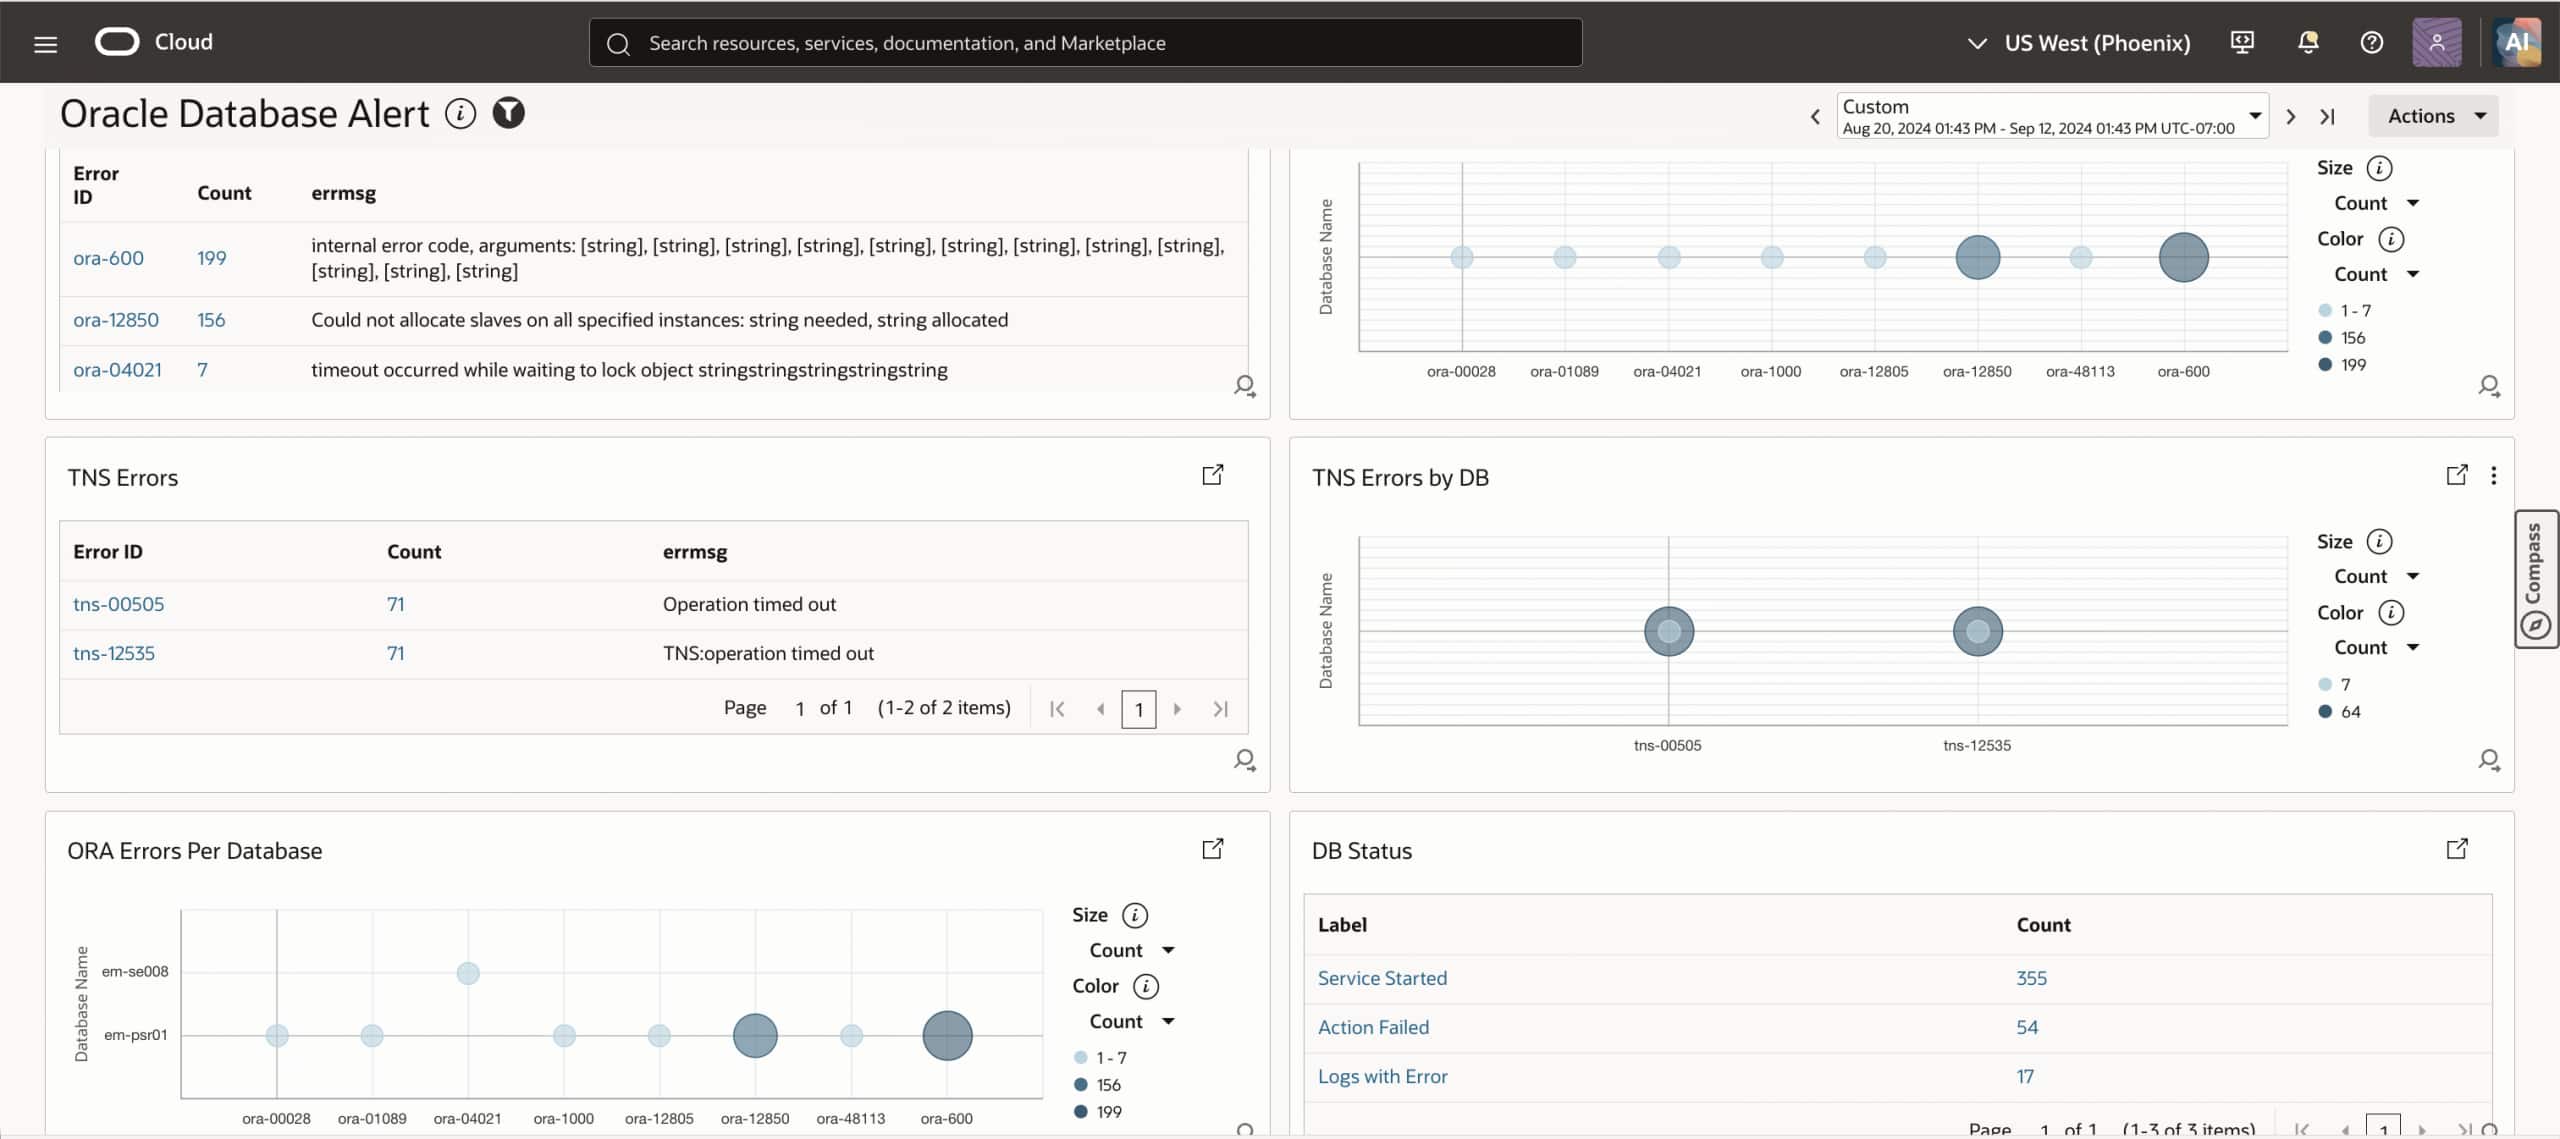
Start with Oracle Database Alert to understand which databases reported errors during the incident. Compare error trends and distributions to determine where activity changed, then examine the supporting alert messages. For intermittent connection failures, this helps establish the databases and intervals that need closer attention. See Oracle Database Alert.
Examine recorded database activity
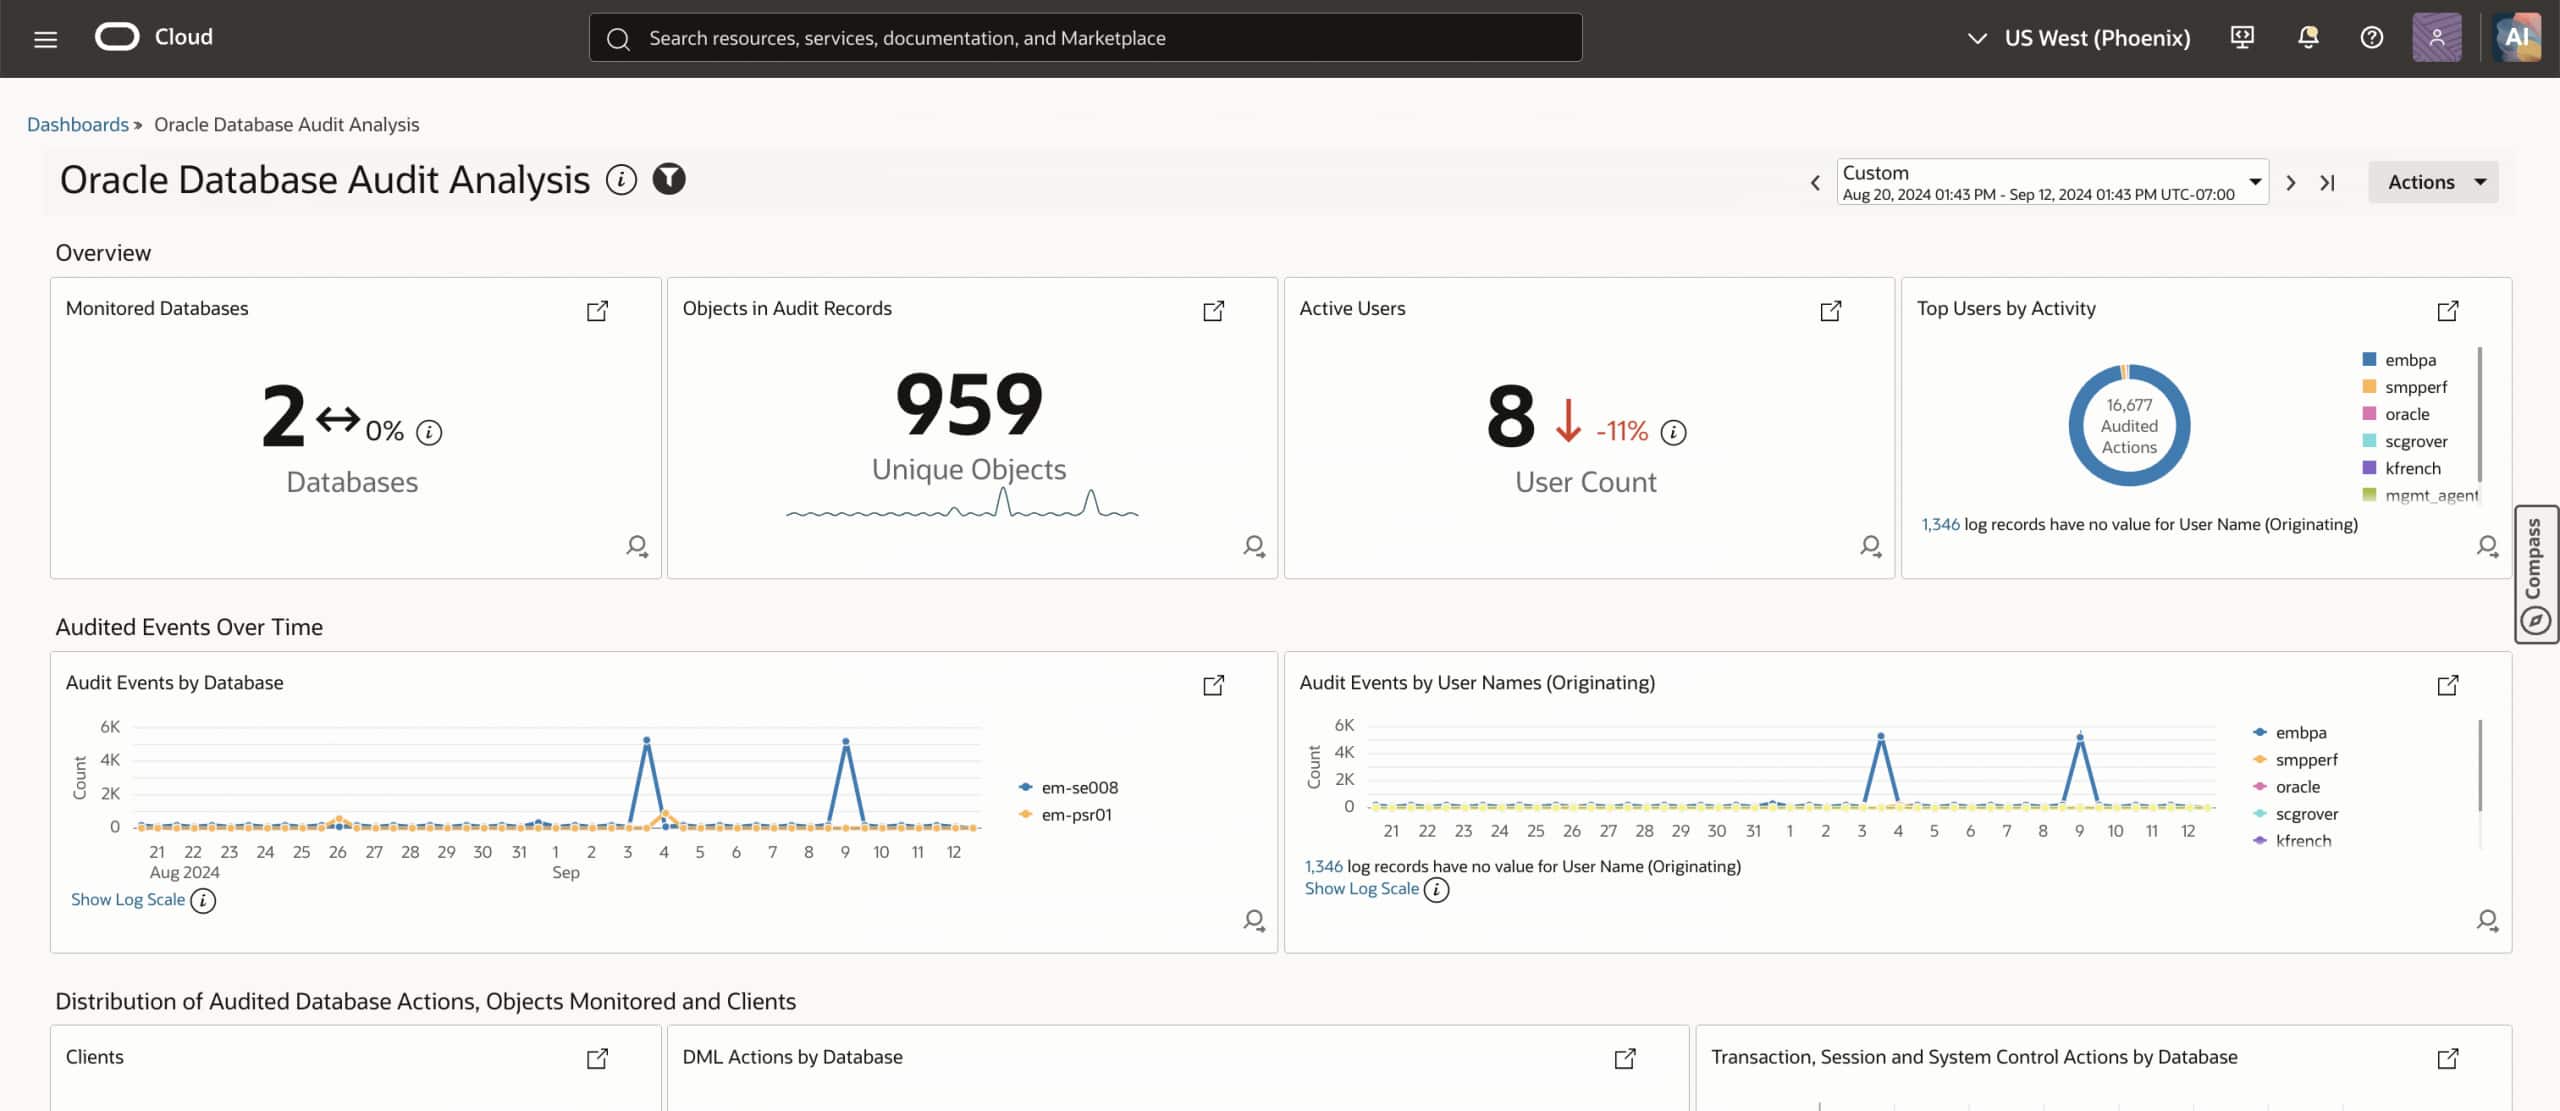
Use Oracle Database Audit Analysis when an administrative, user, or schema change becomes relevant. Review the recorded activity around the incident to identify actions requiring closer examination. The available evidence depends on your database auditing configuration and the audit records you collect. See Oracle Database Audit Analysis.
Review deeper diagnostic evidence
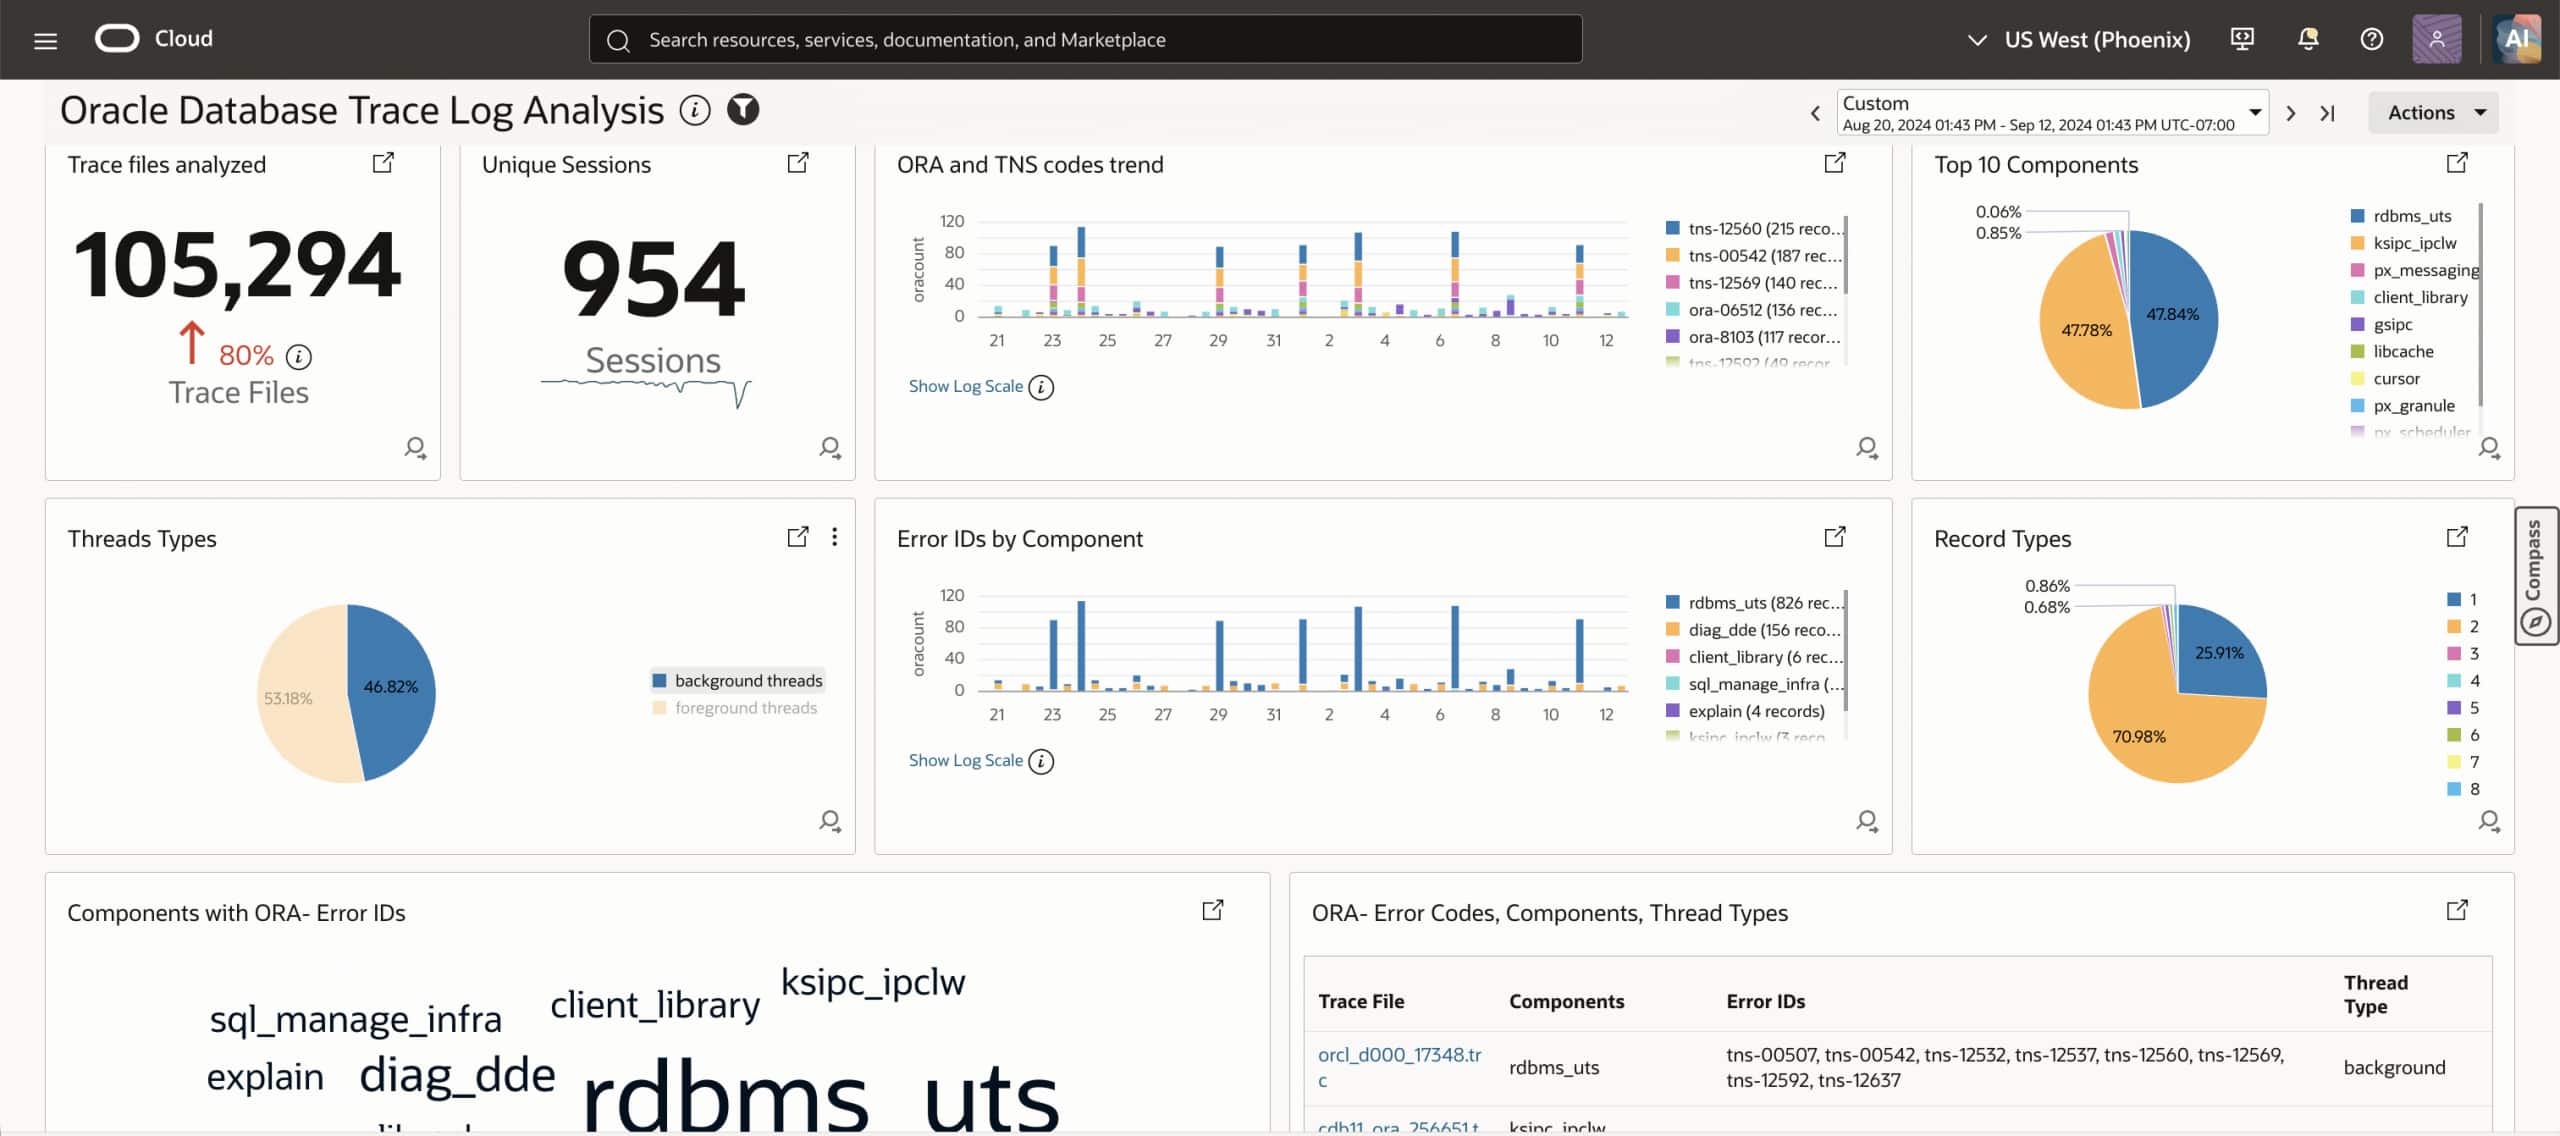
Use Oracle Database Trace Log Analysis when the investigation requires details beyond the initial alert messages. Focus on collected trace records for the affected instance and interval, using the earlier findings to guide your examination. Oracle includes this dashboard in its Oracle-defined dashboard guidance.
Follow the incident into supporting records
Return to the application’s connection failures. Open a relevant Alert dashboard widget in Log Explorer to examine its supporting alert records. Then review the collected listener records for the same resources and time range.
Use the evidence to choose your next check:
| Database alert messages | Errors, restarts, or significant instance events |
| Listener messages | Connection-related errors and reported service conditions |
| Clusterware messages | Cluster resource or service events |
| ASM messages | Storage-management events during the incident |
Keep resource scope and timestamps consistent across these checks. Events occurring together help establish a timeline; their content and workload context determine whether they are related. If the collected diagnostics do not explain the failure, continue with relevant application or network evidence. Verify collection coverage before interpreting an absence of records.
Save useful searches and retain the supporting messages, resource scope, and time range so another operator can reproduce the investigation.
Use AI assistance to explore the evidence
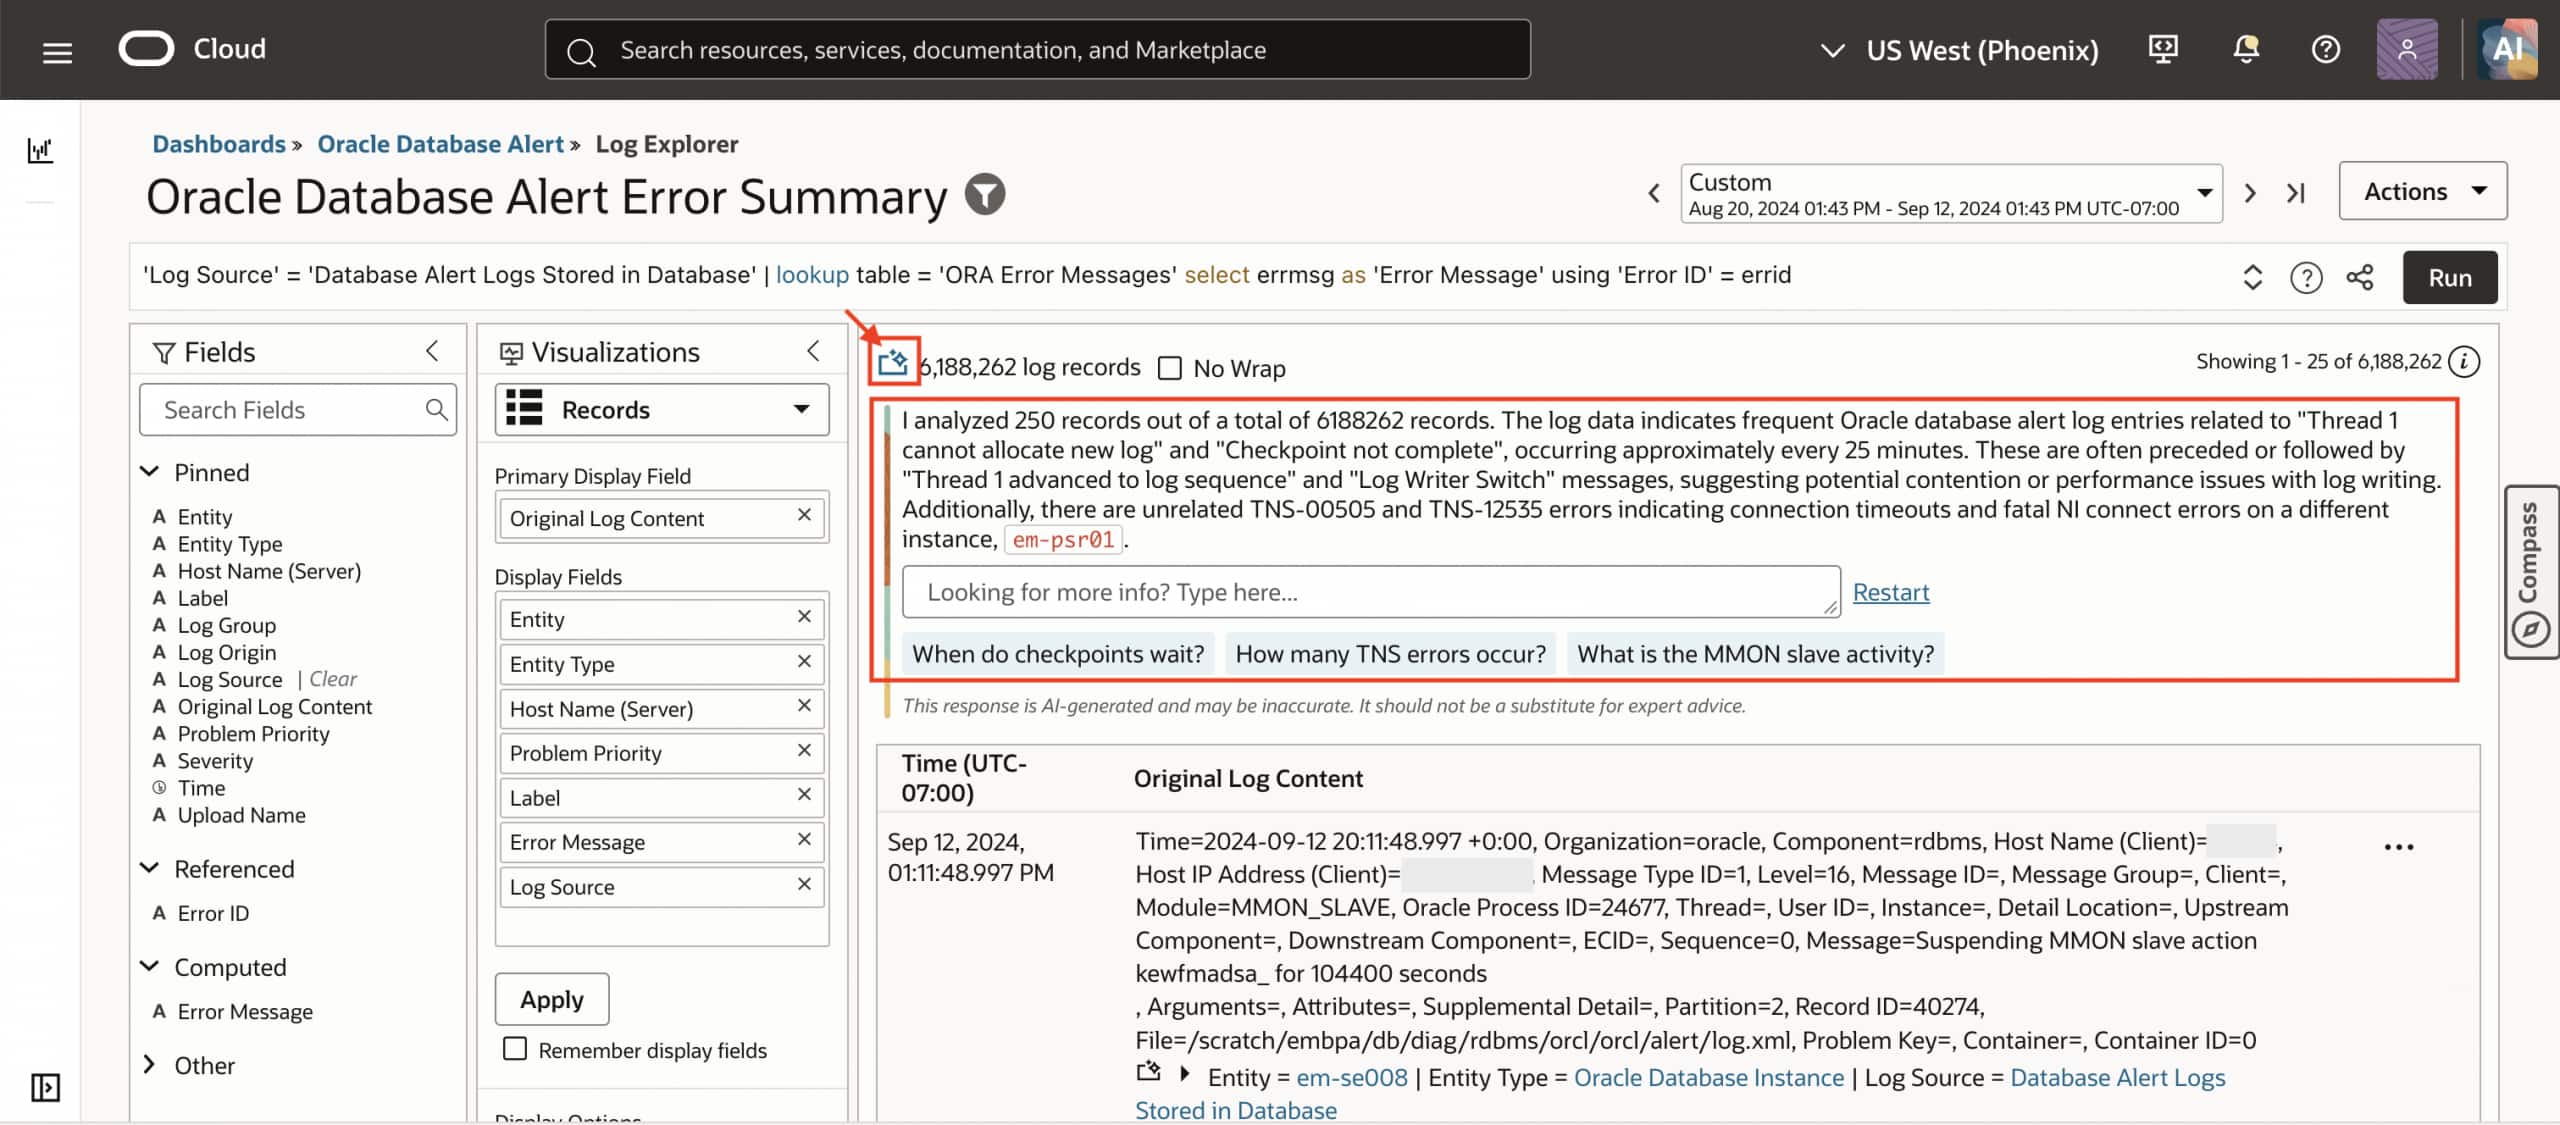
After narrowing the incident, use LoganAI Explain in a supported record view to summarize diagnostic messages and explore follow-up questions. Check which records were included in the analysis, particularly when it covers a subset of the matching data, and validate the explanation against the original messages.
LoganAI requires separate enablement and its documented prerequisites. See Use LoganAI and the Explain feature.
Get started with fleet log management
Centralized diagnostic logs give your team a consistent starting point for investigating Oracle Database@AWS issues across instances and clusters.
For the implementation walkthrough, follow Royce Fu’s OCI Log Analytics for Oracle Database@AWS Fleet Log Management. The guide covers agent installation, connectivity, permissions, log collection, and validation.
Start with one VM cluster, confirm the required diagnostic coverage, and expand the validated approach across your fleet.