

Predictable Exadata performance keeps reporting and scheduled processing on track. When a workload slows down, the impact can extend beyond the database to delayed reports, missed processing windows, and disrupted business operations.
Consider a batch job that usually finishes before the business day begins but is now running late. Your team needs to understand what changed. Is one server under increased load? Are competing processes consuming resources? Did memory or I/O behavior change during the same interval?
Oracle Cloud Infrastructure (OCI) Log Analytics brings collected ExaWatcher data into dashboards that help you investigate these questions. You can compare activity across servers, examine the processes active during a slowdown, and follow resource trends into their supporting log records. This gives database and infrastructure teams a shared basis for deciding where to investigate and whether resource use warrants closer attention.
This blog shows how to use those dashboards to move from a reported slowdown to a focused investigation. You’ll learn how to identify the affected server and time window, connect resource changes with workload activity, and gather evidence for your next troubleshooting step.
How the solution works
ExaWatcher collects detailed system statistics on individual Exadata servers. The OCI Management Agent, with the Log Analytics plug-in, collects the configured ExaWatcher files and sends their records to OCI Log Analytics.
Configured log sources and parsers turn the file content into structured records with timestamps and searchable performance fields. Entity associations provide the resource context needed to distinguish activity across servers.
The ExaWatcher dashboard brings these records into views of system, process, memory, and I/O activity. You can compare servers over a consistent time window and examine how resource behavior changed during a workload’s execution.
When a chart highlights activity worth investigating, open the relevant widget in Log Explorer to examine its analysis and supporting records. For the slow batch job, this connects the broader resource trend with the server, processes, and samples that warrant closer attention.
Set up ExaWatcher log collection
With OCI Log Analytics enabled and the required permissions and connectivity in place, setup follows three main steps:
- Install the Management Agent.
Deploy the OCI Management Agent on the Exadata hosts whose logs you want to collect and enable the Log Analytics plug-in. Follow Oracle’s documented Linux ZIP installation on an external volume procedure for Exadata. See Install Management Agents. - Configure file-based collection.
Configure the sources and parsers for the required ExaWatcher files, associate them with the appropriate host entities, and grant the agent read access. Include the data sources needed for the system, process, memory, and I/O views. See Set Up Continuous Log Collection. - Verify the data and open the dashboard.
Confirm that recent records contain the expected timestamps, server associations, and performance fields. In the OCI Console, go to Observability & Management → Log Analytics → Dashboards, select the appropriate compartment, and open the ExaWatcher Overview dashboard.
What the ExaWatcher dashboard offers
The dashboard connects system, process, memory, and I/O activity so you can investigate a slowdown from several perspectives. Keep the server scope and time window consistent as you move between views.
Identify where system activity changed
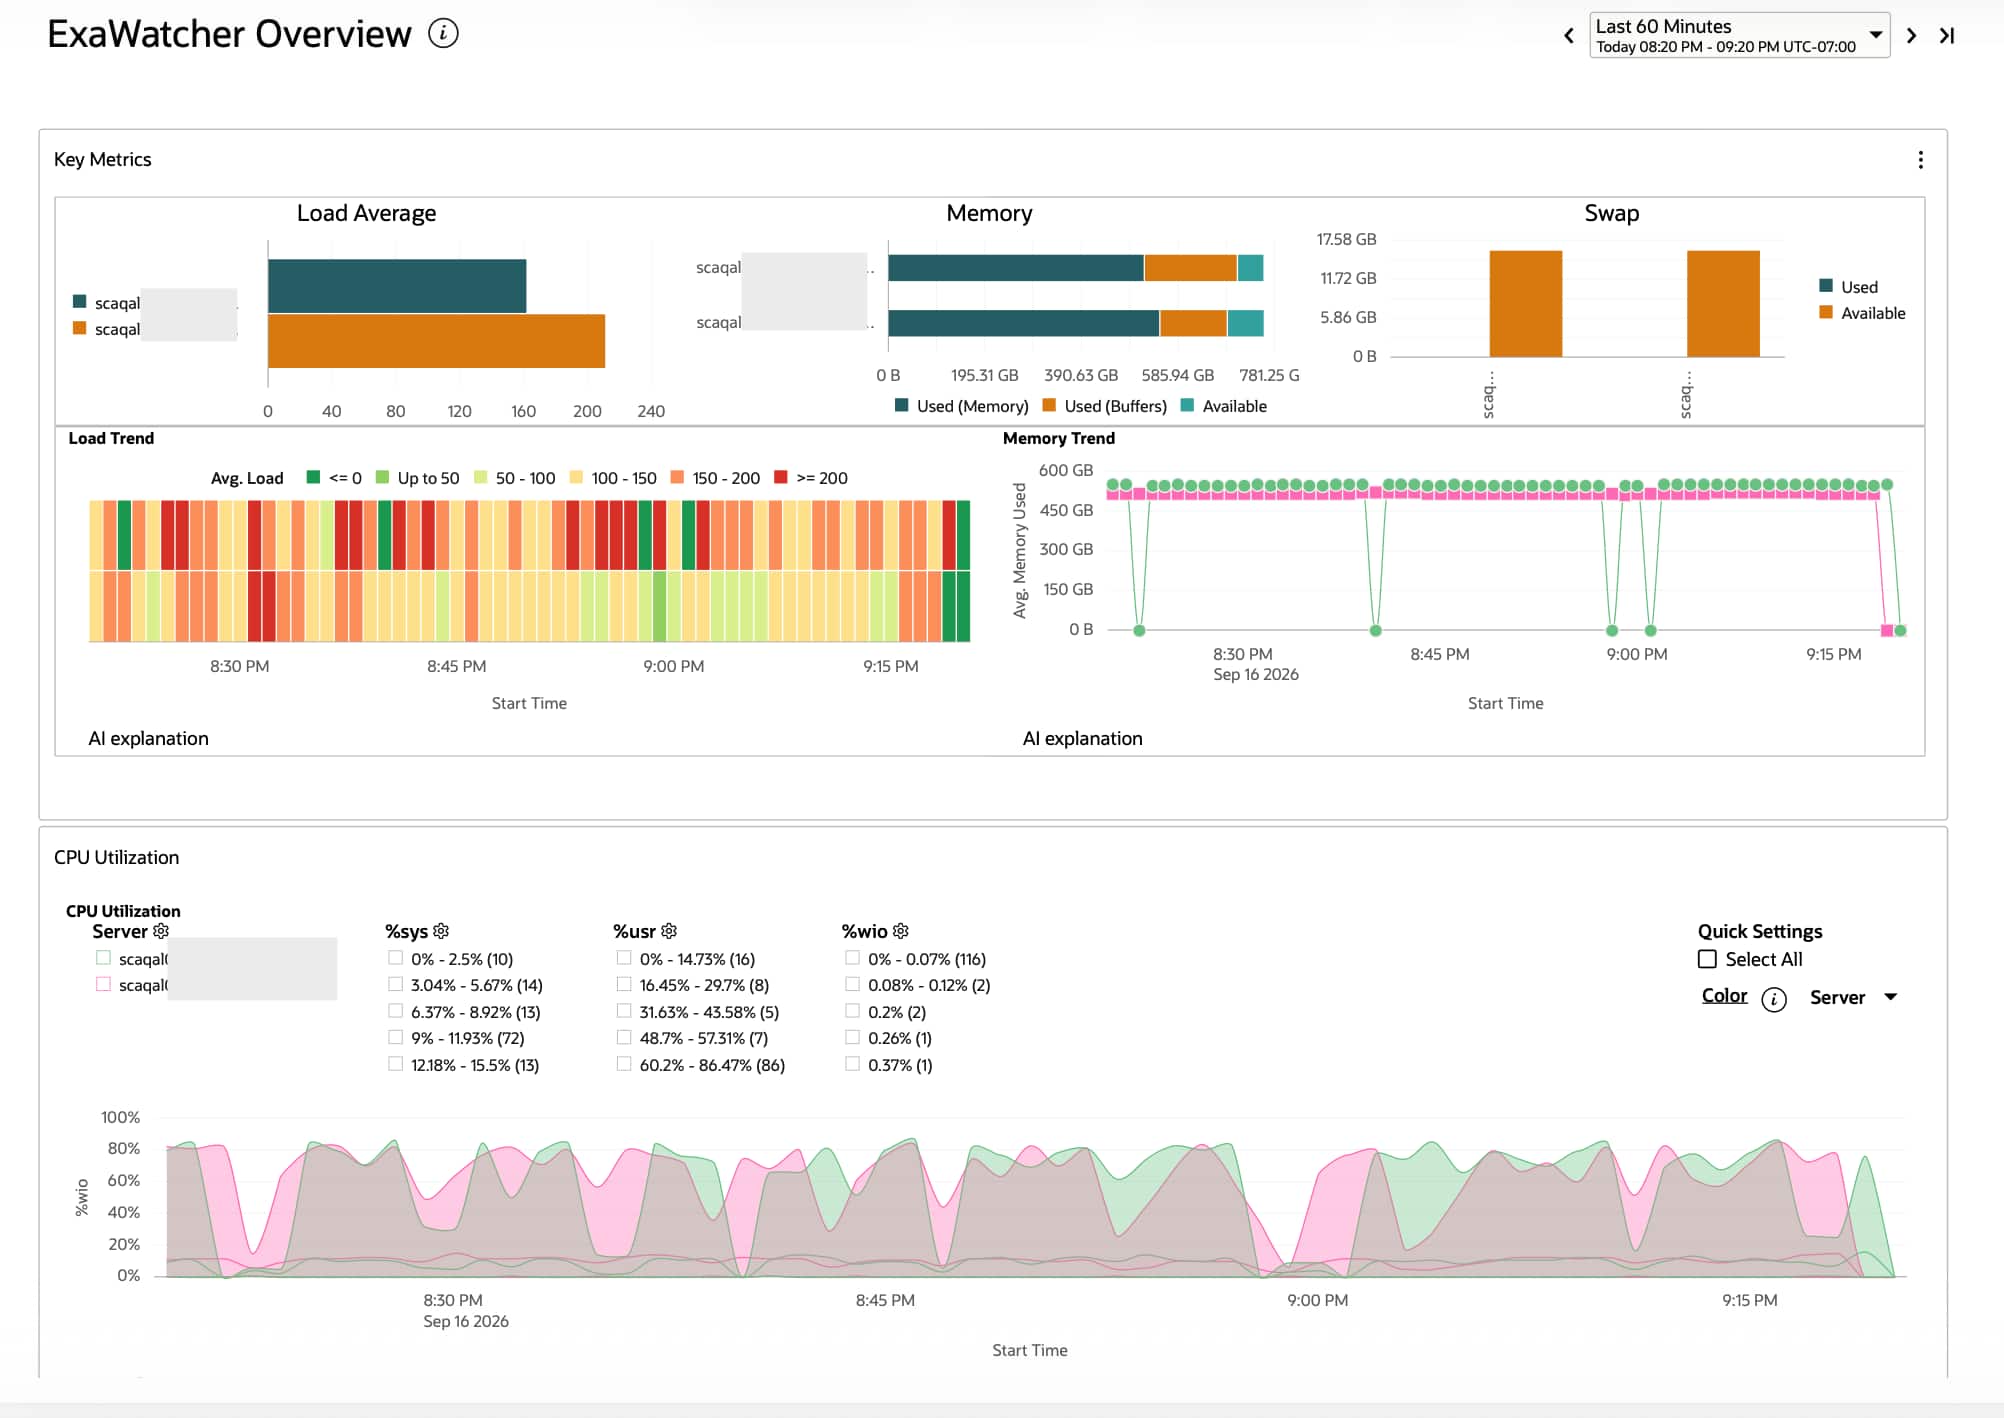
Use System to compare load trends and CPU utilization across servers. Determine whether a change was brief or sustained and whether it affected one server or several.
Interpret load against CPU capacity and the workload’s normal behavior. Load average includes runnable work and work in an uninterruptible wait state, so an increase alone does not establish CPU pressure. Compare it with user CPU, system CPU, and I/O wait to select a server and interval for closer investigation.
Identify processes active during the slowdown
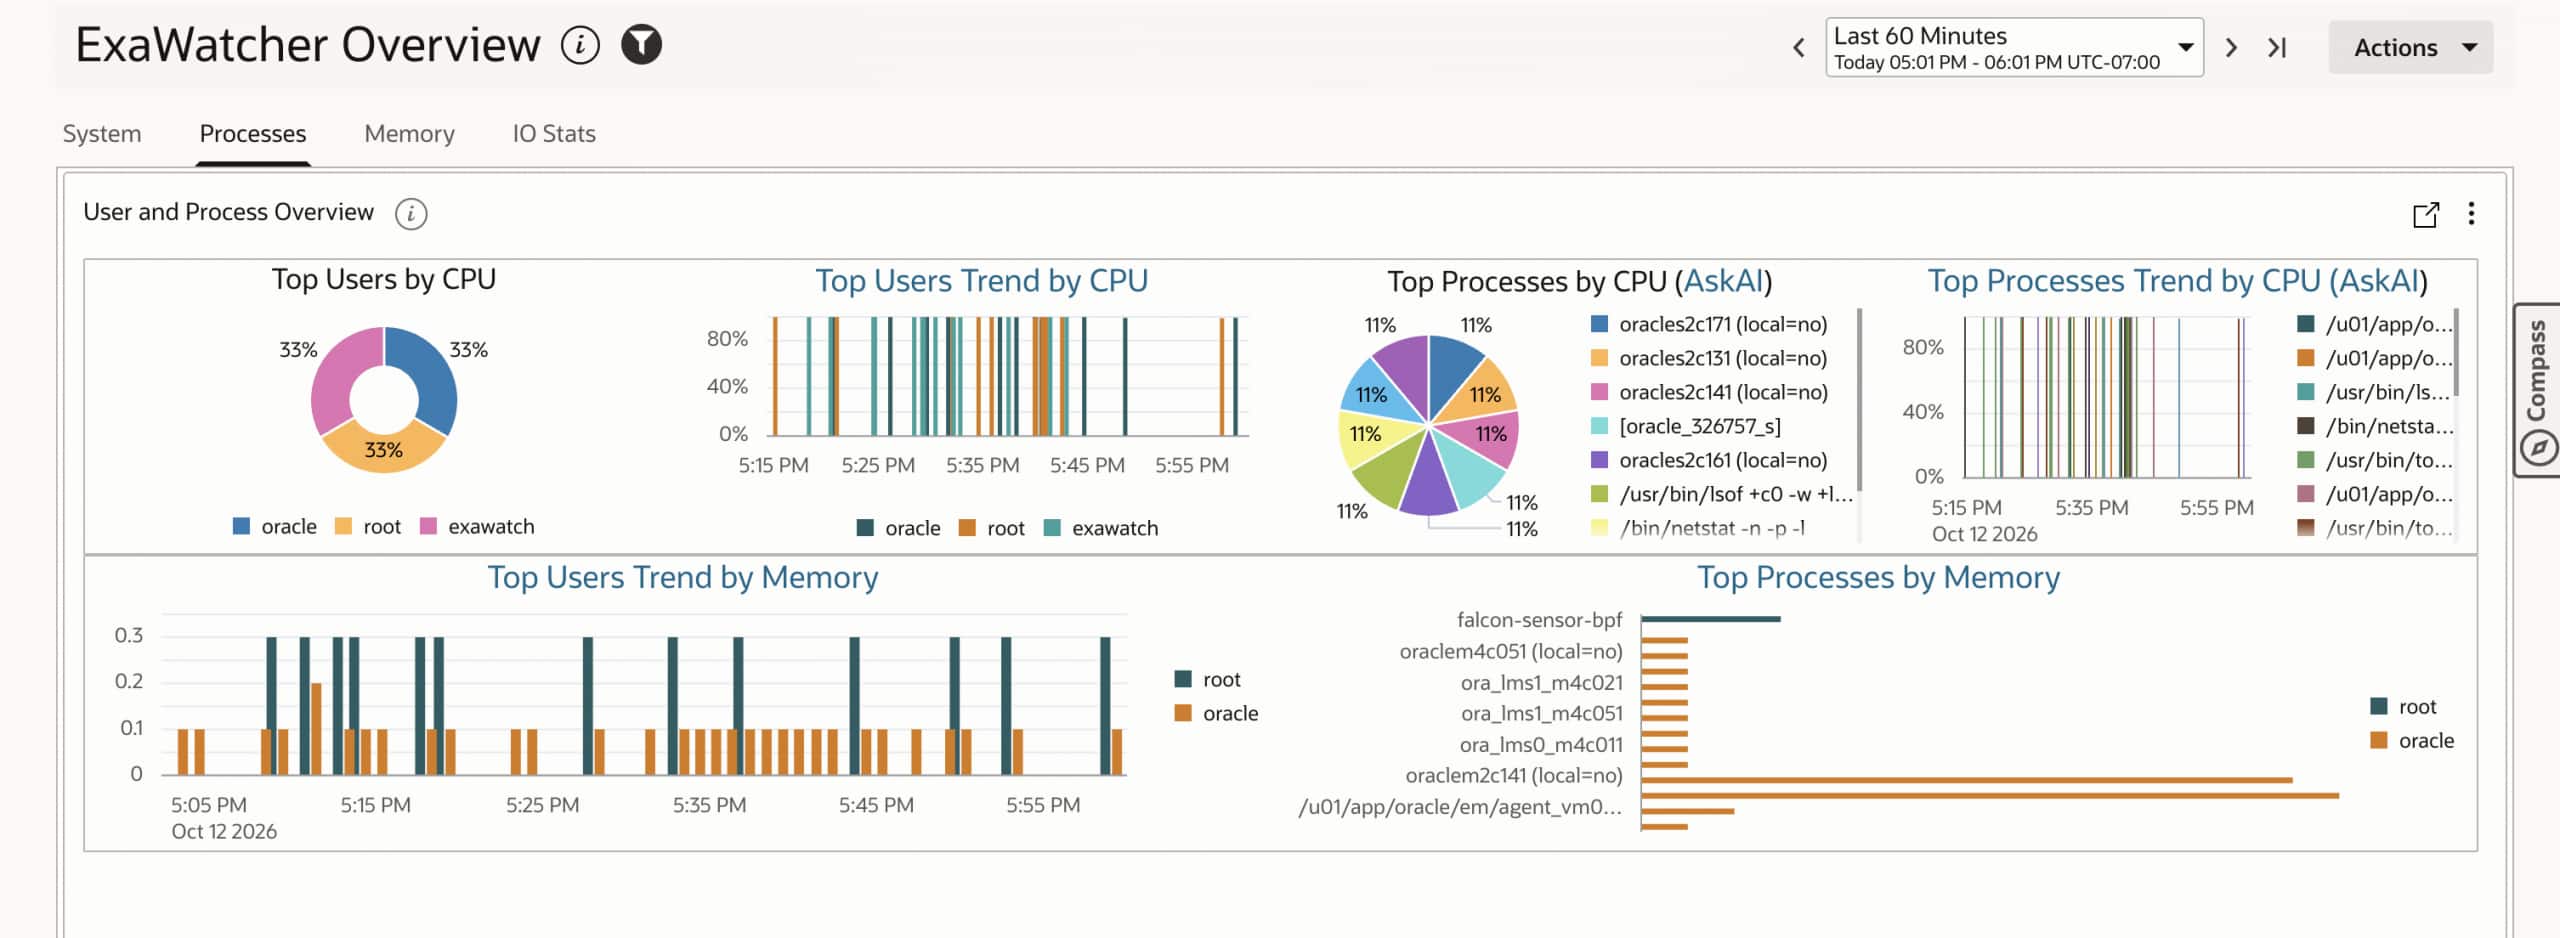
Use Processes to examine CPU and memory consumption by user and process. Compare rankings with activity trends to identify processes whose resource consumption overlaps the slowdown.
For the batch-job example, determine whether that activity belongs to the batch, a concurrent workload, or an expected background operation. Where available, correlate the host, process identifier, and timestamps with database session or SQL activity.
Evaluate memory and swap behavior
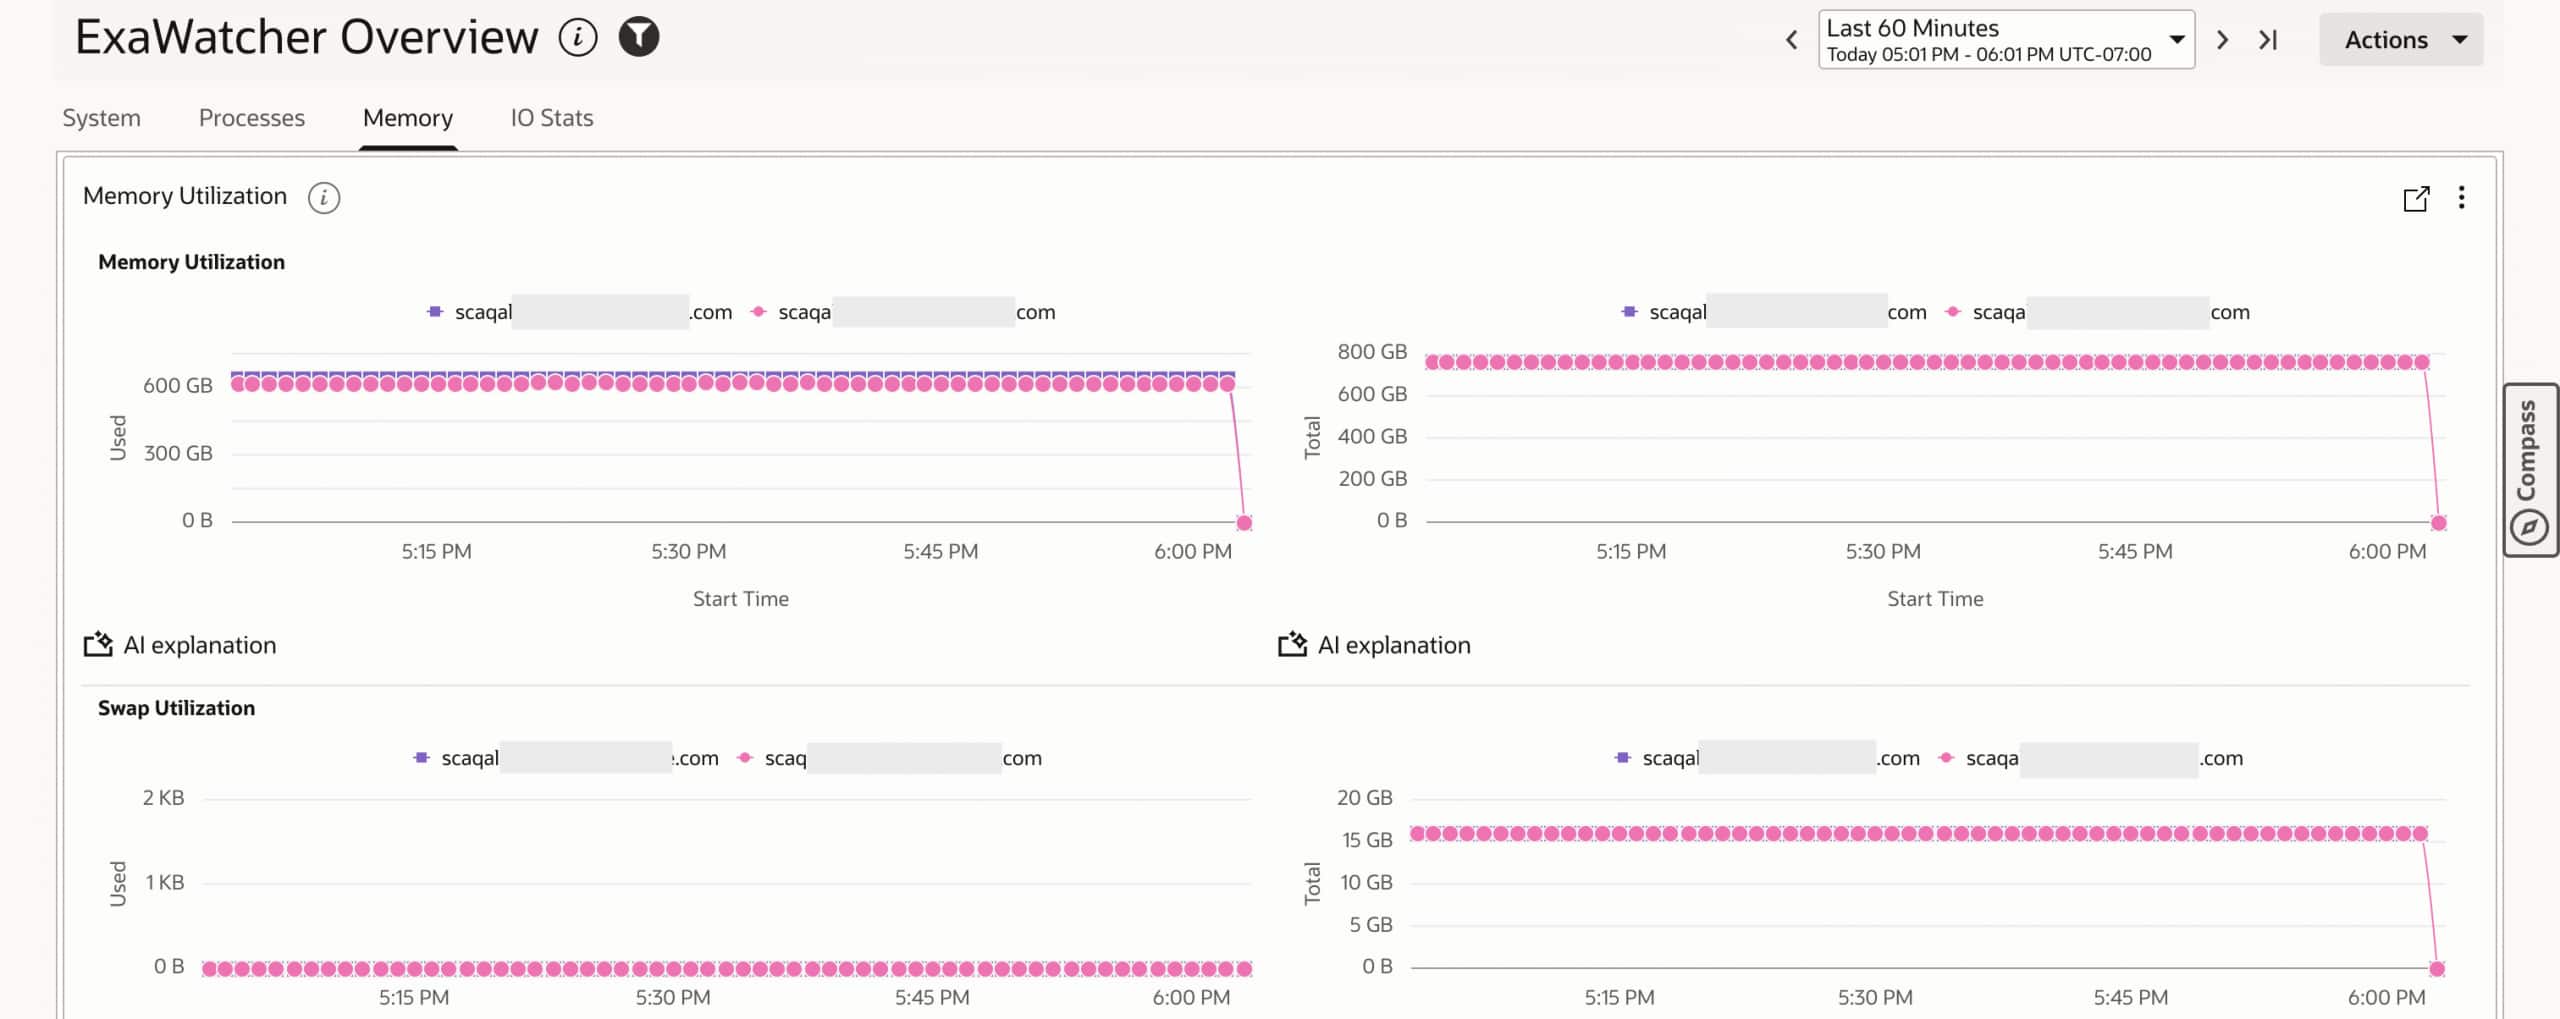
Use Memory to compare used and total memory alongside swap usage. Review available memory in System and check how the underlying fields account for buffers and cached memory.
High memory usage alone does not establish memory pressure. If available memory declines during the slowdown, examine process memory consumption and supporting VMStat records. Swap-in and swap-out rates, where collected, help distinguish active swapping from the amount of swap occupied.
Investigate flash I/O behavior
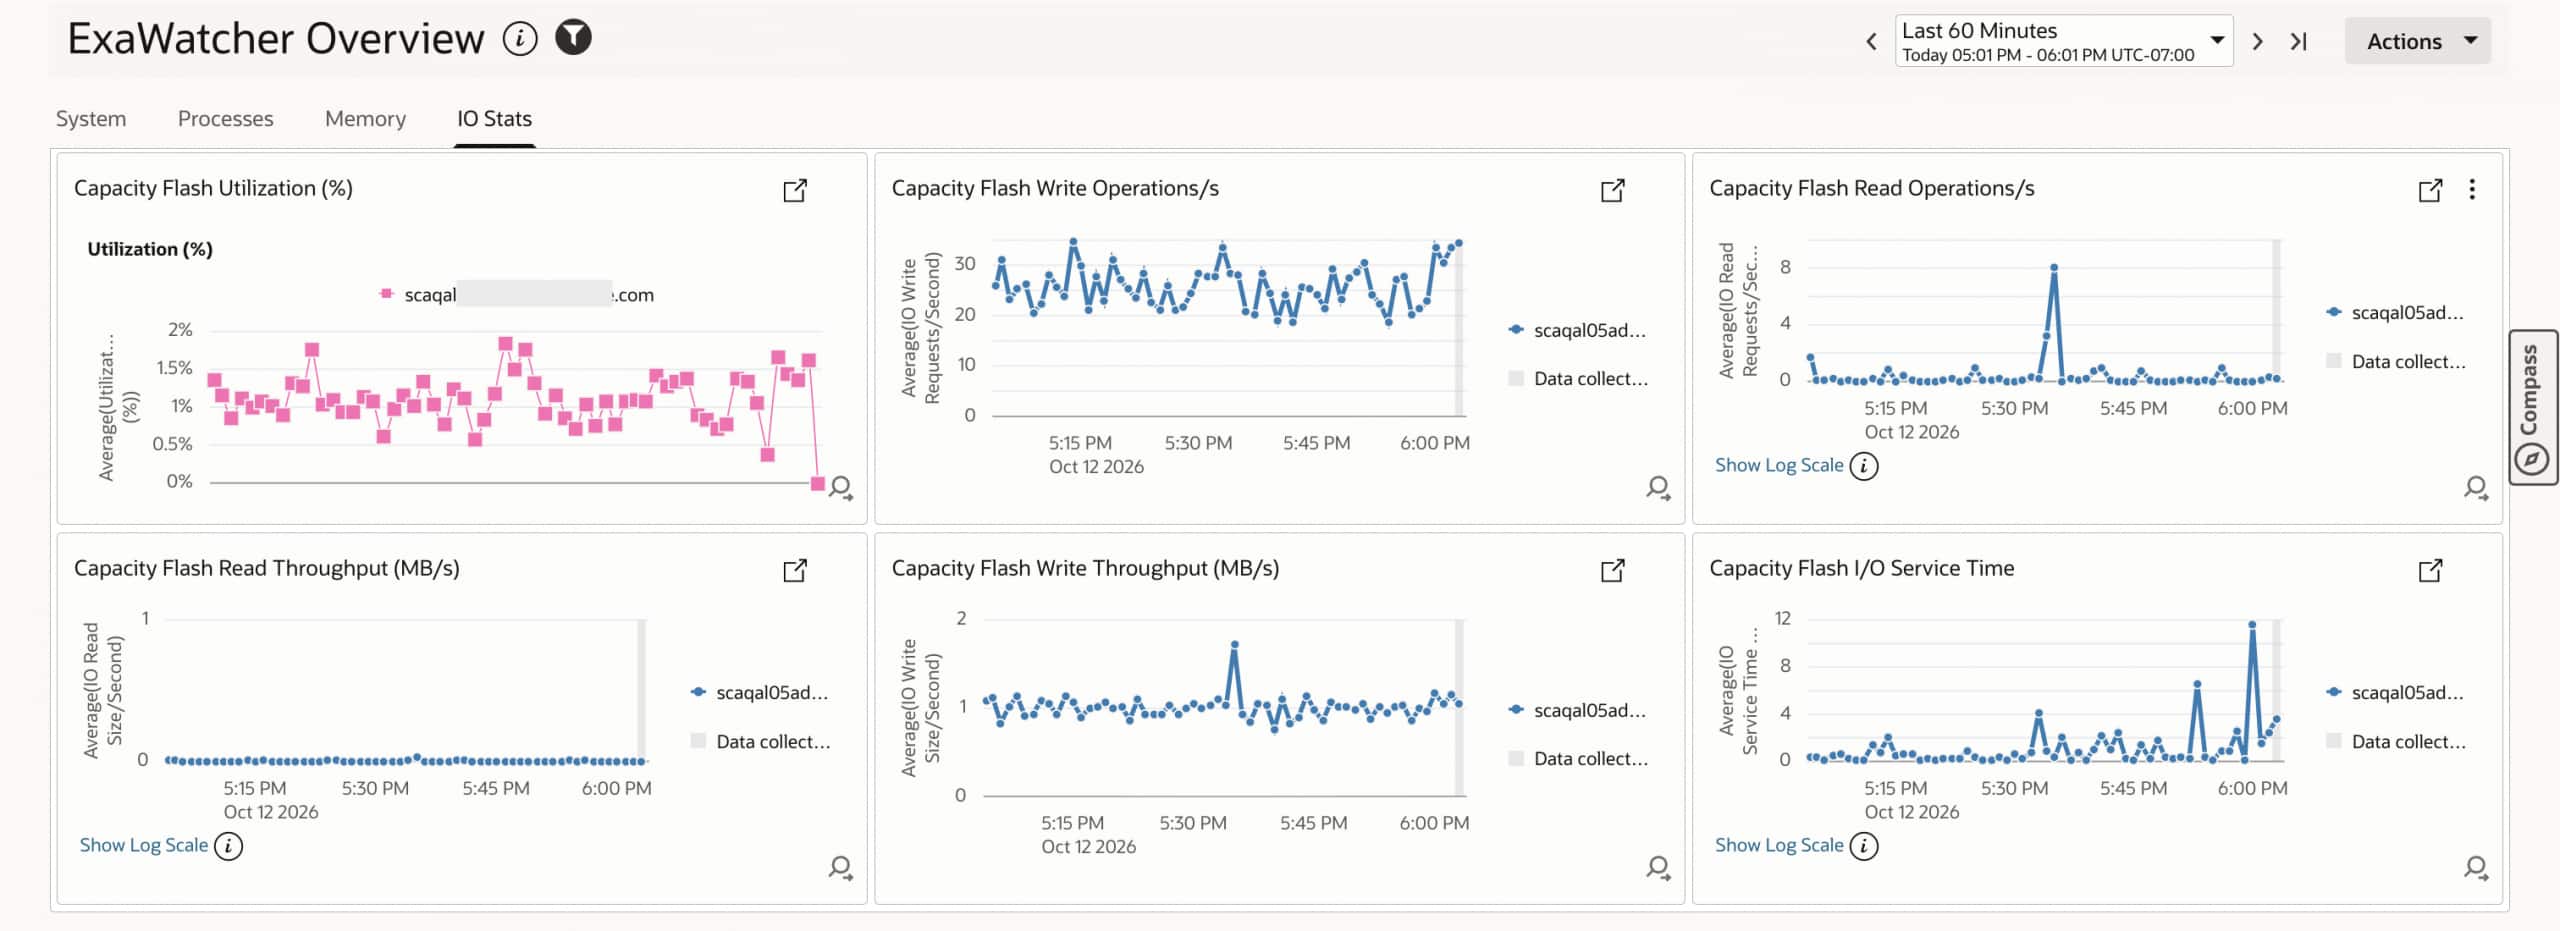
Use IO Stats to compare flash utilization, read and write operation rates, throughput, and service time.
Operations per second describe request frequency, while throughput describes data volume per second. Compare both with service time during the affected execution and a representative normal run. Confirm the units and the host or device represented by each series before interpreting a change.
If storage becomes a candidate, correlate the interval with database wait events and workload evidence to assess its contribution to the slowdown.
Validate findings with Log Explorer and LoganAI
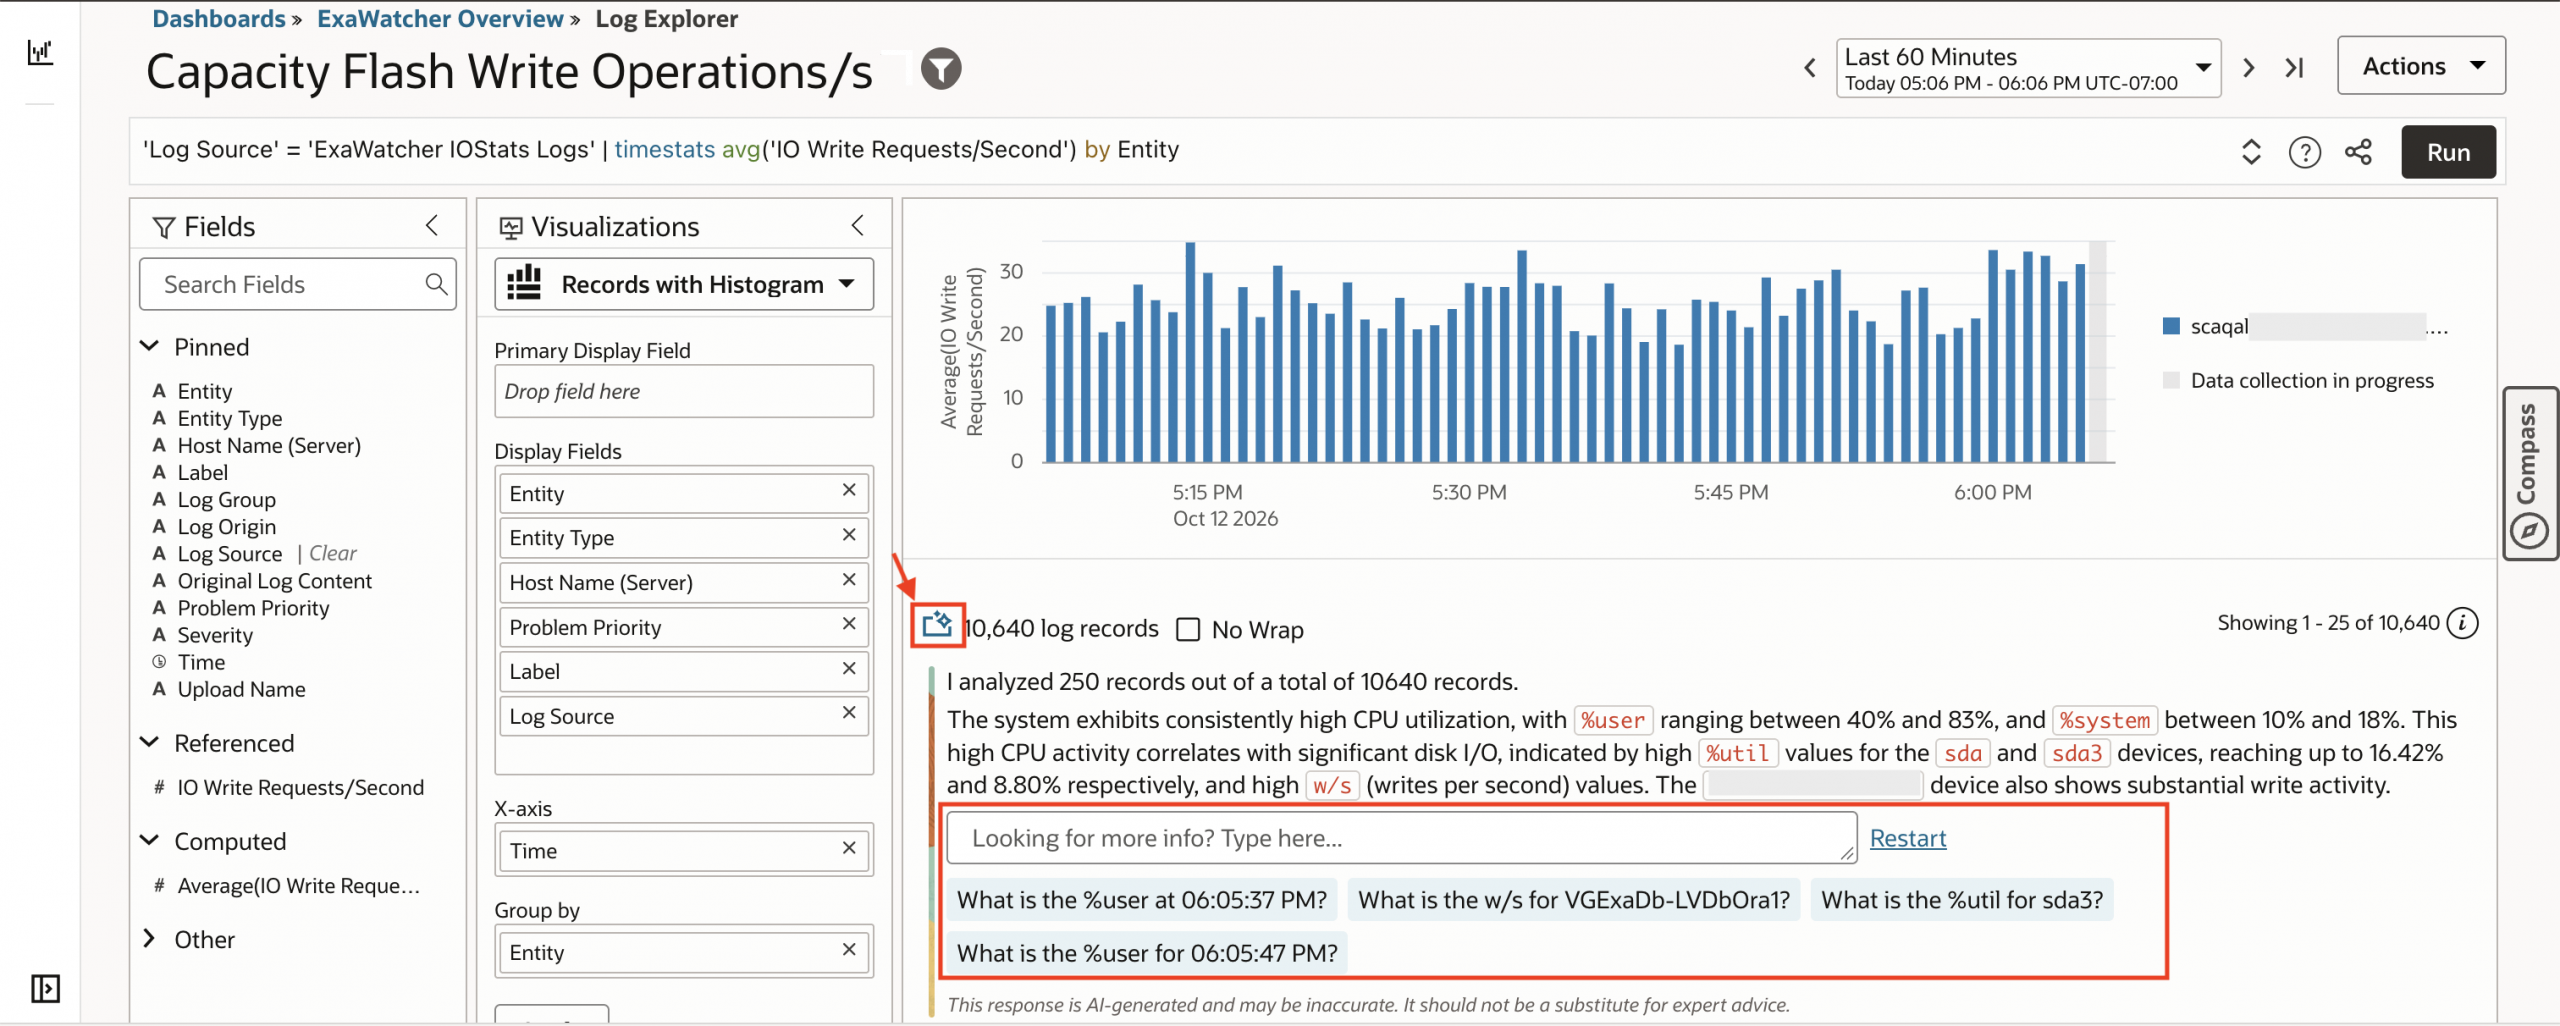
Open a relevant widget in Log Explorer to examine its analysis and supporting records. Check the resource scope, timestamps, and aggregation, particularly when an average may conceal a brief peak or a chart contains unexpected gaps.
If LoganAI is enabled, use Explain in supported record views to summarize selected messages and explore follow-up questions. Check which records were analyzed and validate the explanation against their values and timestamps.
For the batch-job investigation, these capabilities help you assemble a specific server, time window, and set of resource observations for the database or infrastructure team to examine next.
ExaWatcher dashboards in OCI Log Analytics bring system, process, memory, and I/O activity together to support Exadata performance investigations. By connecting dashboard trends with supporting log records, you can better understand workload behavior and guide your next troubleshooting step.