

Reliable network connectivity keeps applications communicating with the services they depend on. When that communication fails, the impact can extend to interrupted transactions, delayed processing, and unavailable application functions.
Consider a deployment after which your application can no longer reach a dependency. Your team needs to understand what changed. Is traffic being rejected? Which subnet, endpoint, and destination port are involved? Did the change begin with the deployment or earlier?
The enhanced VCN Flow dashboard in Oracle Cloud Infrastructure (OCI) Log Analytics brings recorded network activity into a shared investigation view. Network, application, and security teams can examine the same evidence to identify affected communication and decide where to investigate next.
This blog shows how to move from a reported connectivity issue to a focused investigation, using traffic trends, endpoint and subnet activity, and the supporting flow-log records.
What’s new in the VCN Flow dashboard?
The enhanced VCN Flow dashboard builds on existing flow-log analysis in OCI Log Analytics, organizing investigation into Overview, Traffic Analysis, and Security Analysis.
These views help you establish when traffic changed, identify the communication involved, and examine broader security patterns. You can move from overall activity to specific endpoints, ports, protocols, and subnets, then open a relevant widget in Log Explorer to examine its analysis and supporting records. See Oracle’s VCN flow-log documentation.
Set up VCN flow-log collection
OCI Logging collects VCN flow logs, and a Service Connector transfers selected records to OCI Log Analytics. The OCI VCN Flow Unified Schema Logs source provides the parsing context for analysis.
Before you begin, confirm that you have the permissions required to configure collection and access the relevant logs and dashboard. See Oracle’s ingestion guide for the prerequisites.
Use the Add Data workflow to configure collection:
1. Choose OCI service log collection.
Open Add Data in Log Analytics. Expand Monitor OCI resources and select OCI Services.
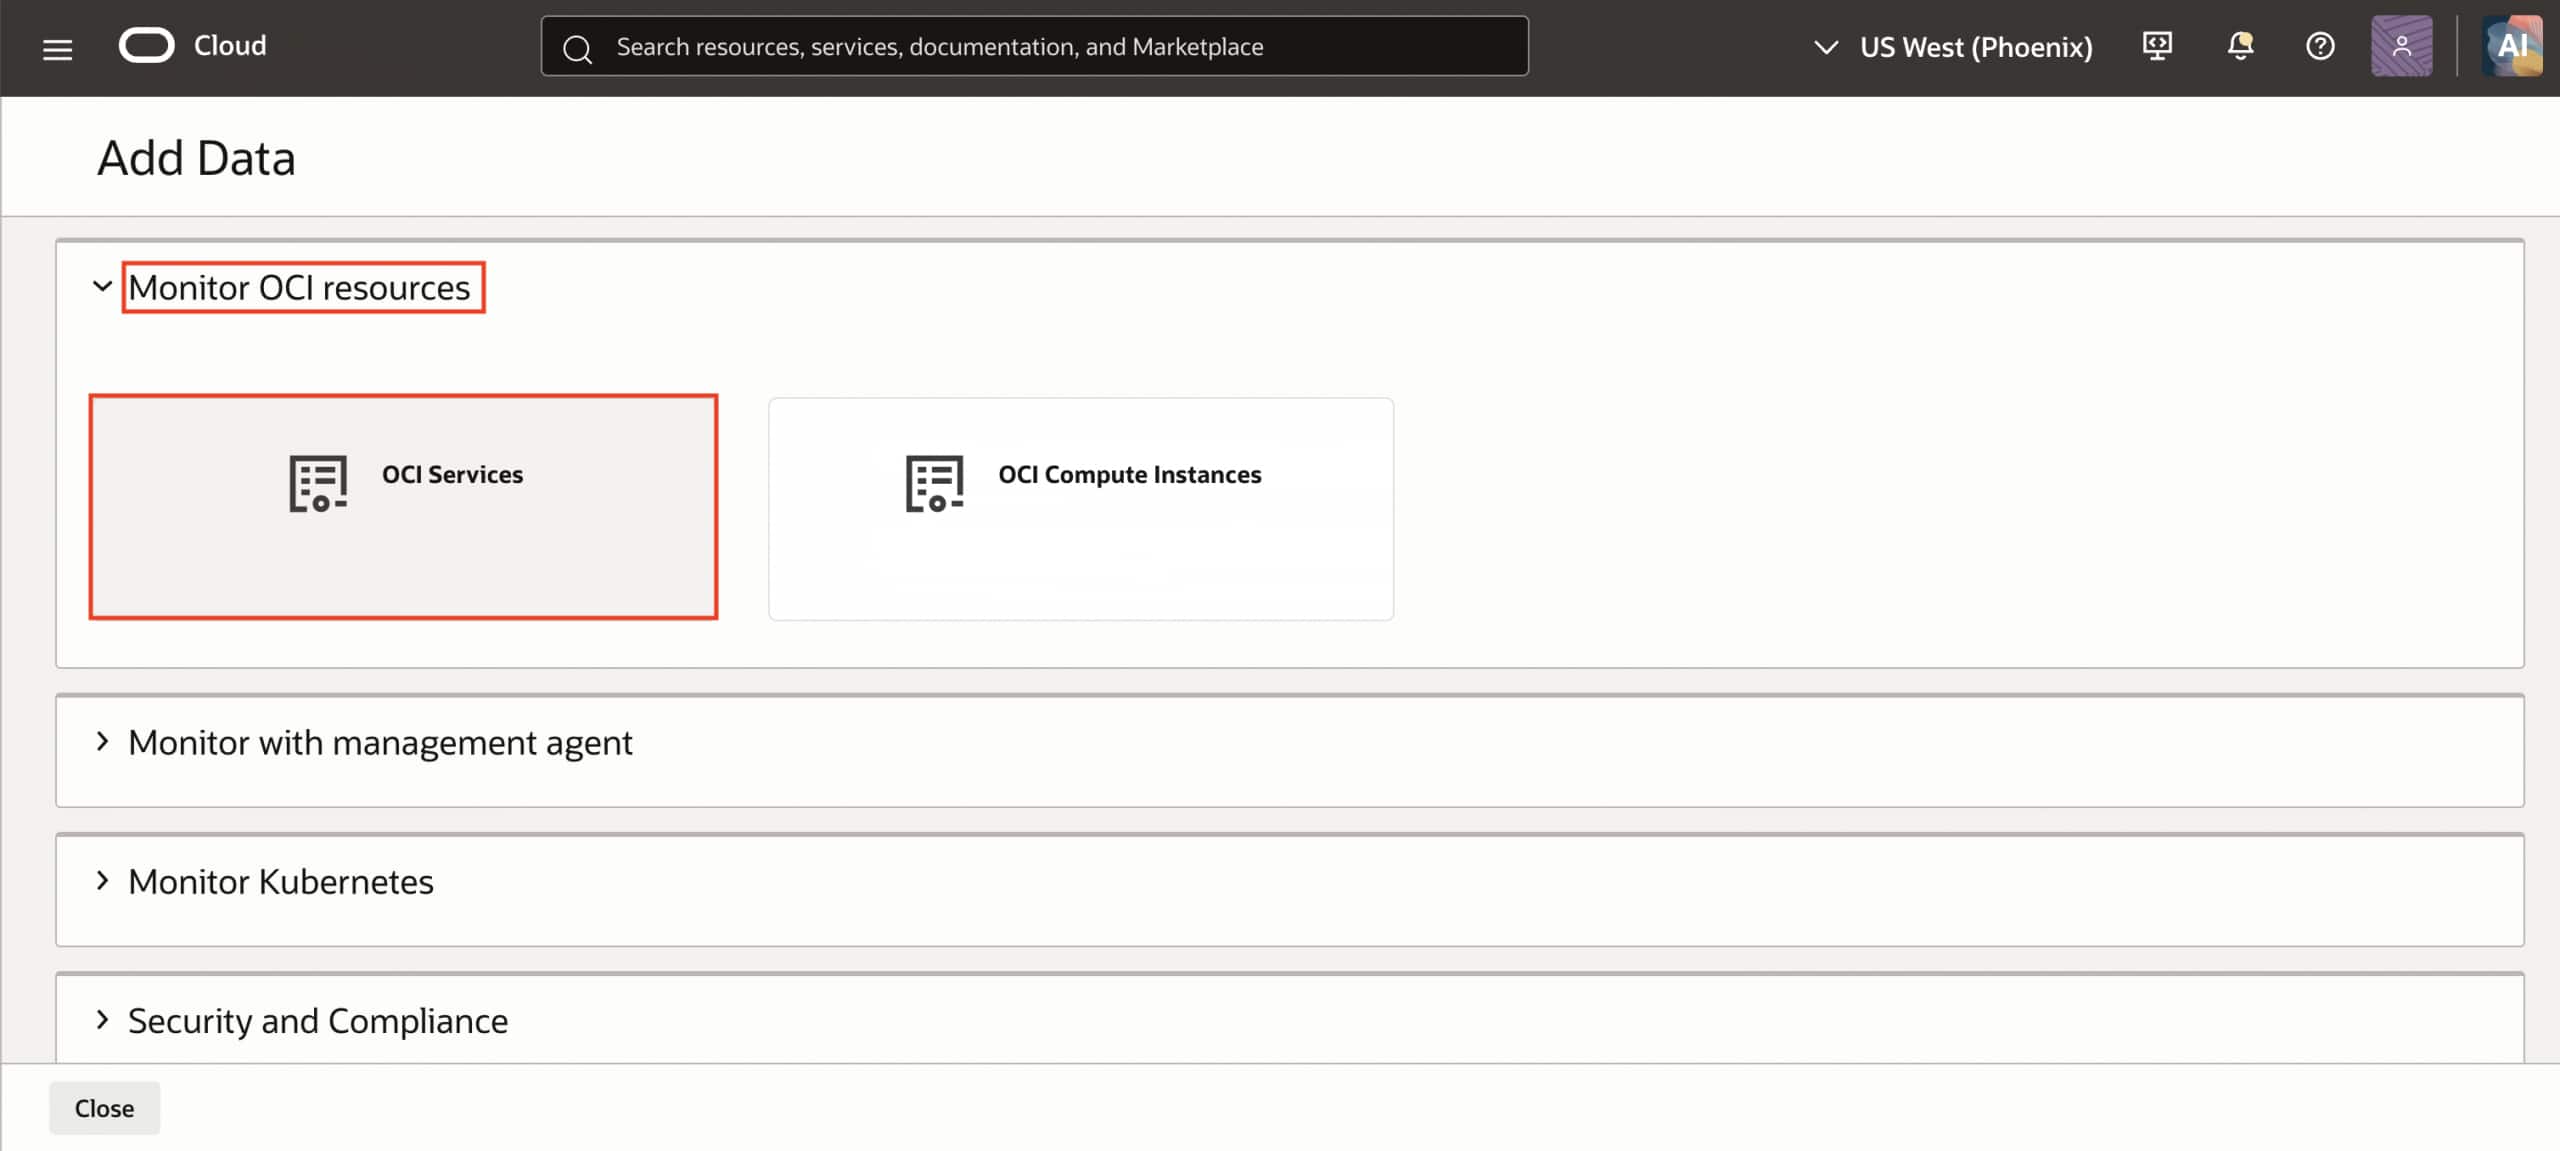
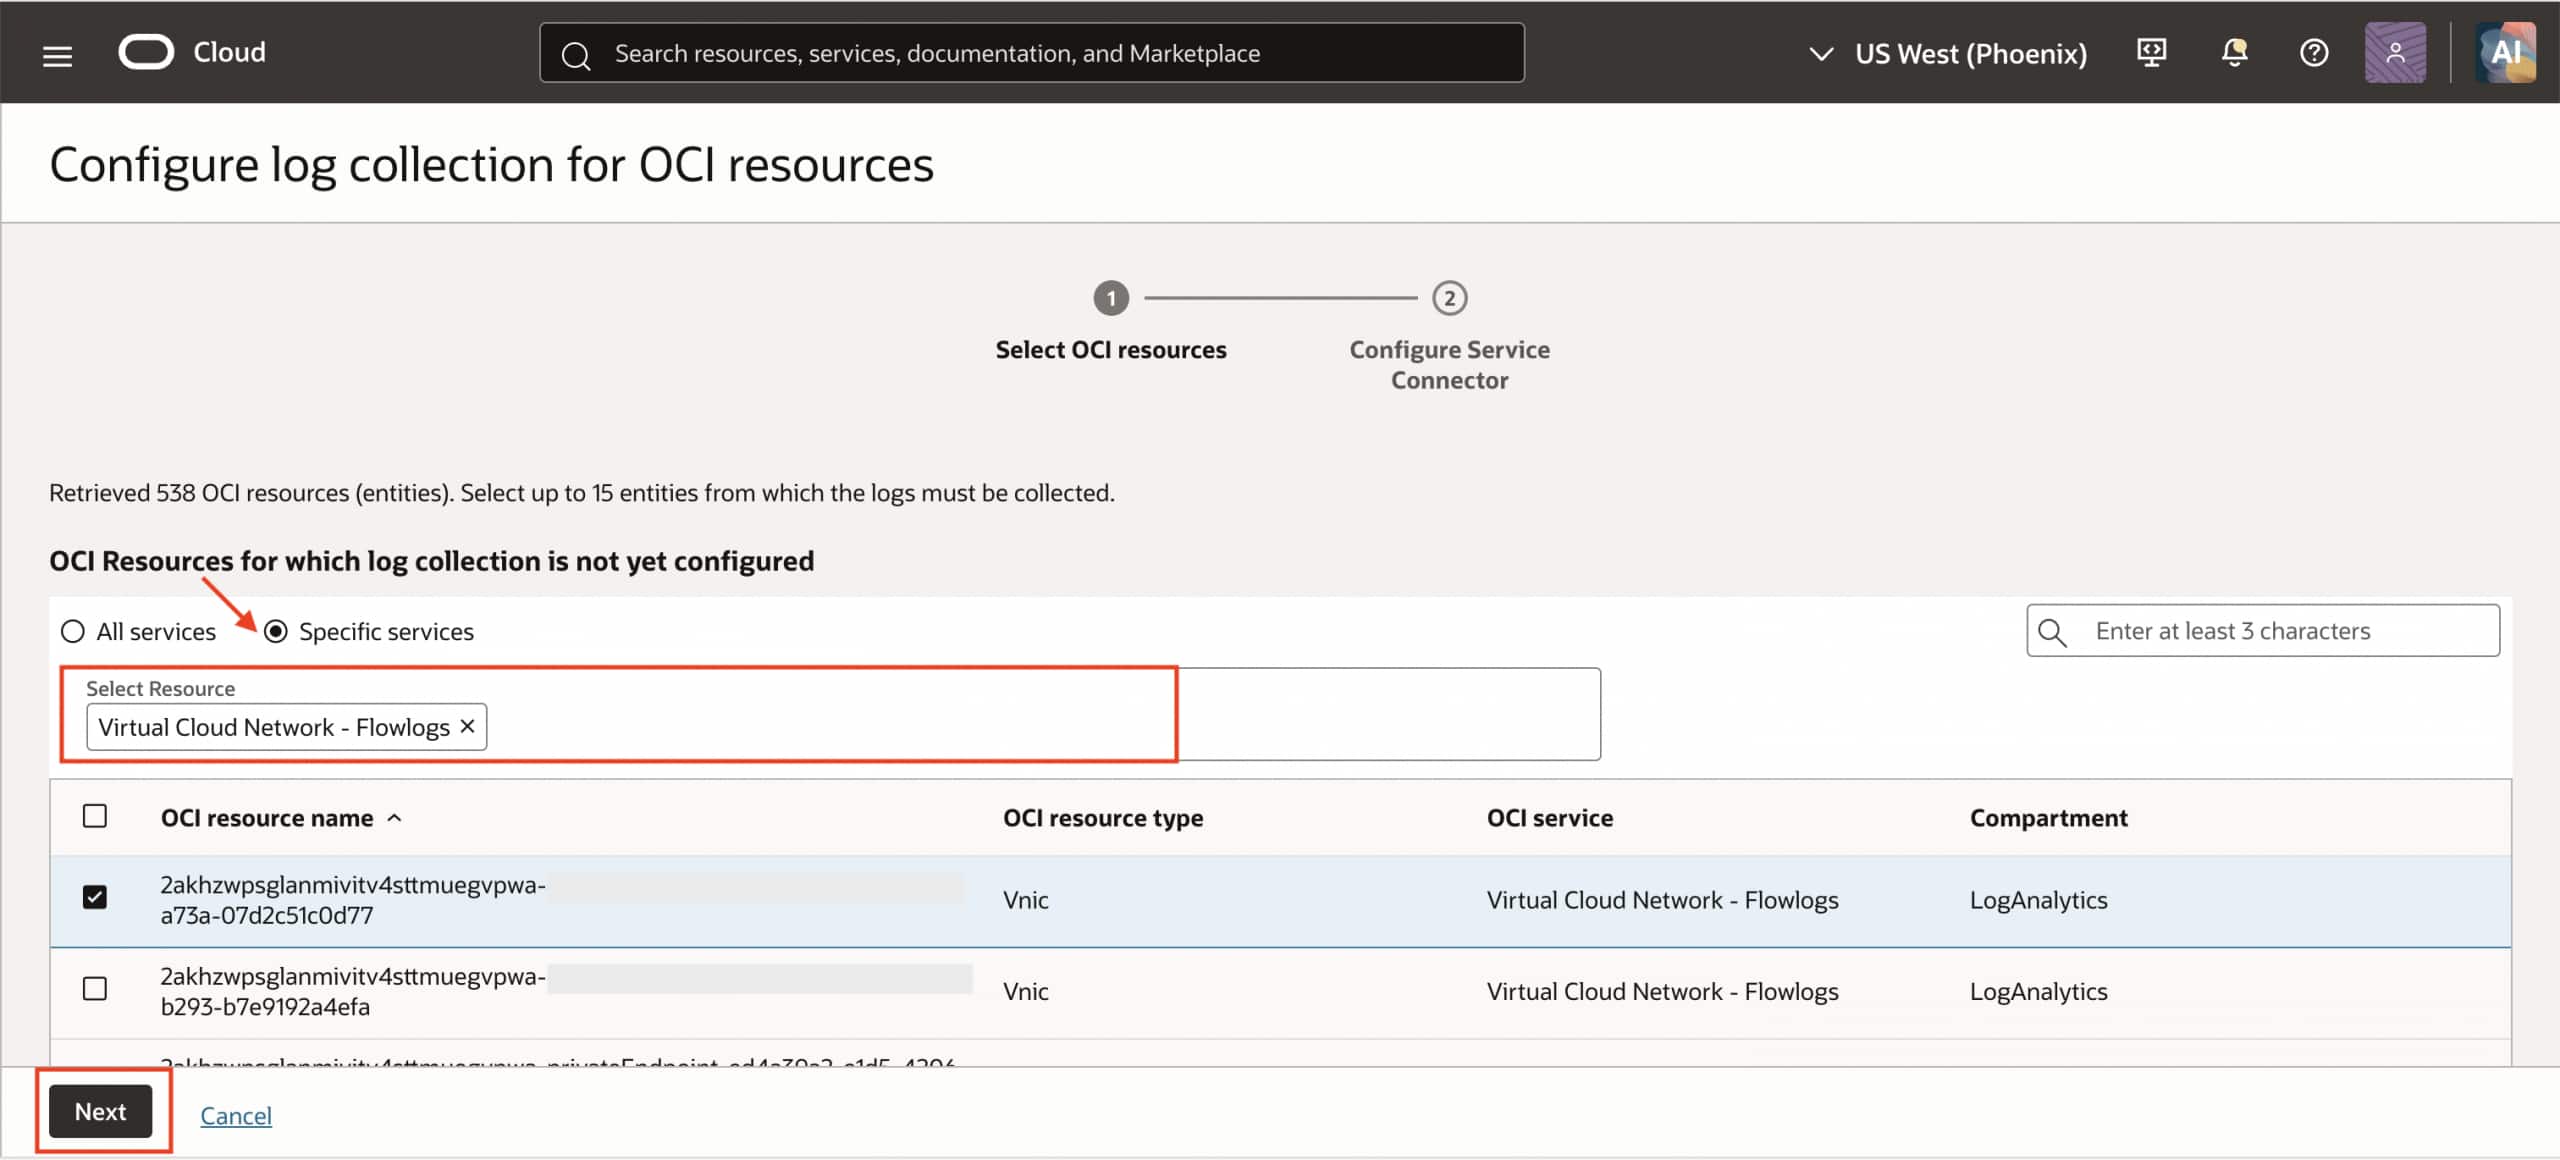
2. Select the resources you want to monitor.
On Configure log collection for OCI resources, choose Specific services and select Virtual Cloud Network – Flowlogs. Select the resources relevant to your investigation, then click Next.
3. Review and configure collection.
Confirm that the associated source is OCI VCN Flow Unified Schema Logs. Review the automatic configuration details, select Configure log collection, and complete the guided workflow.
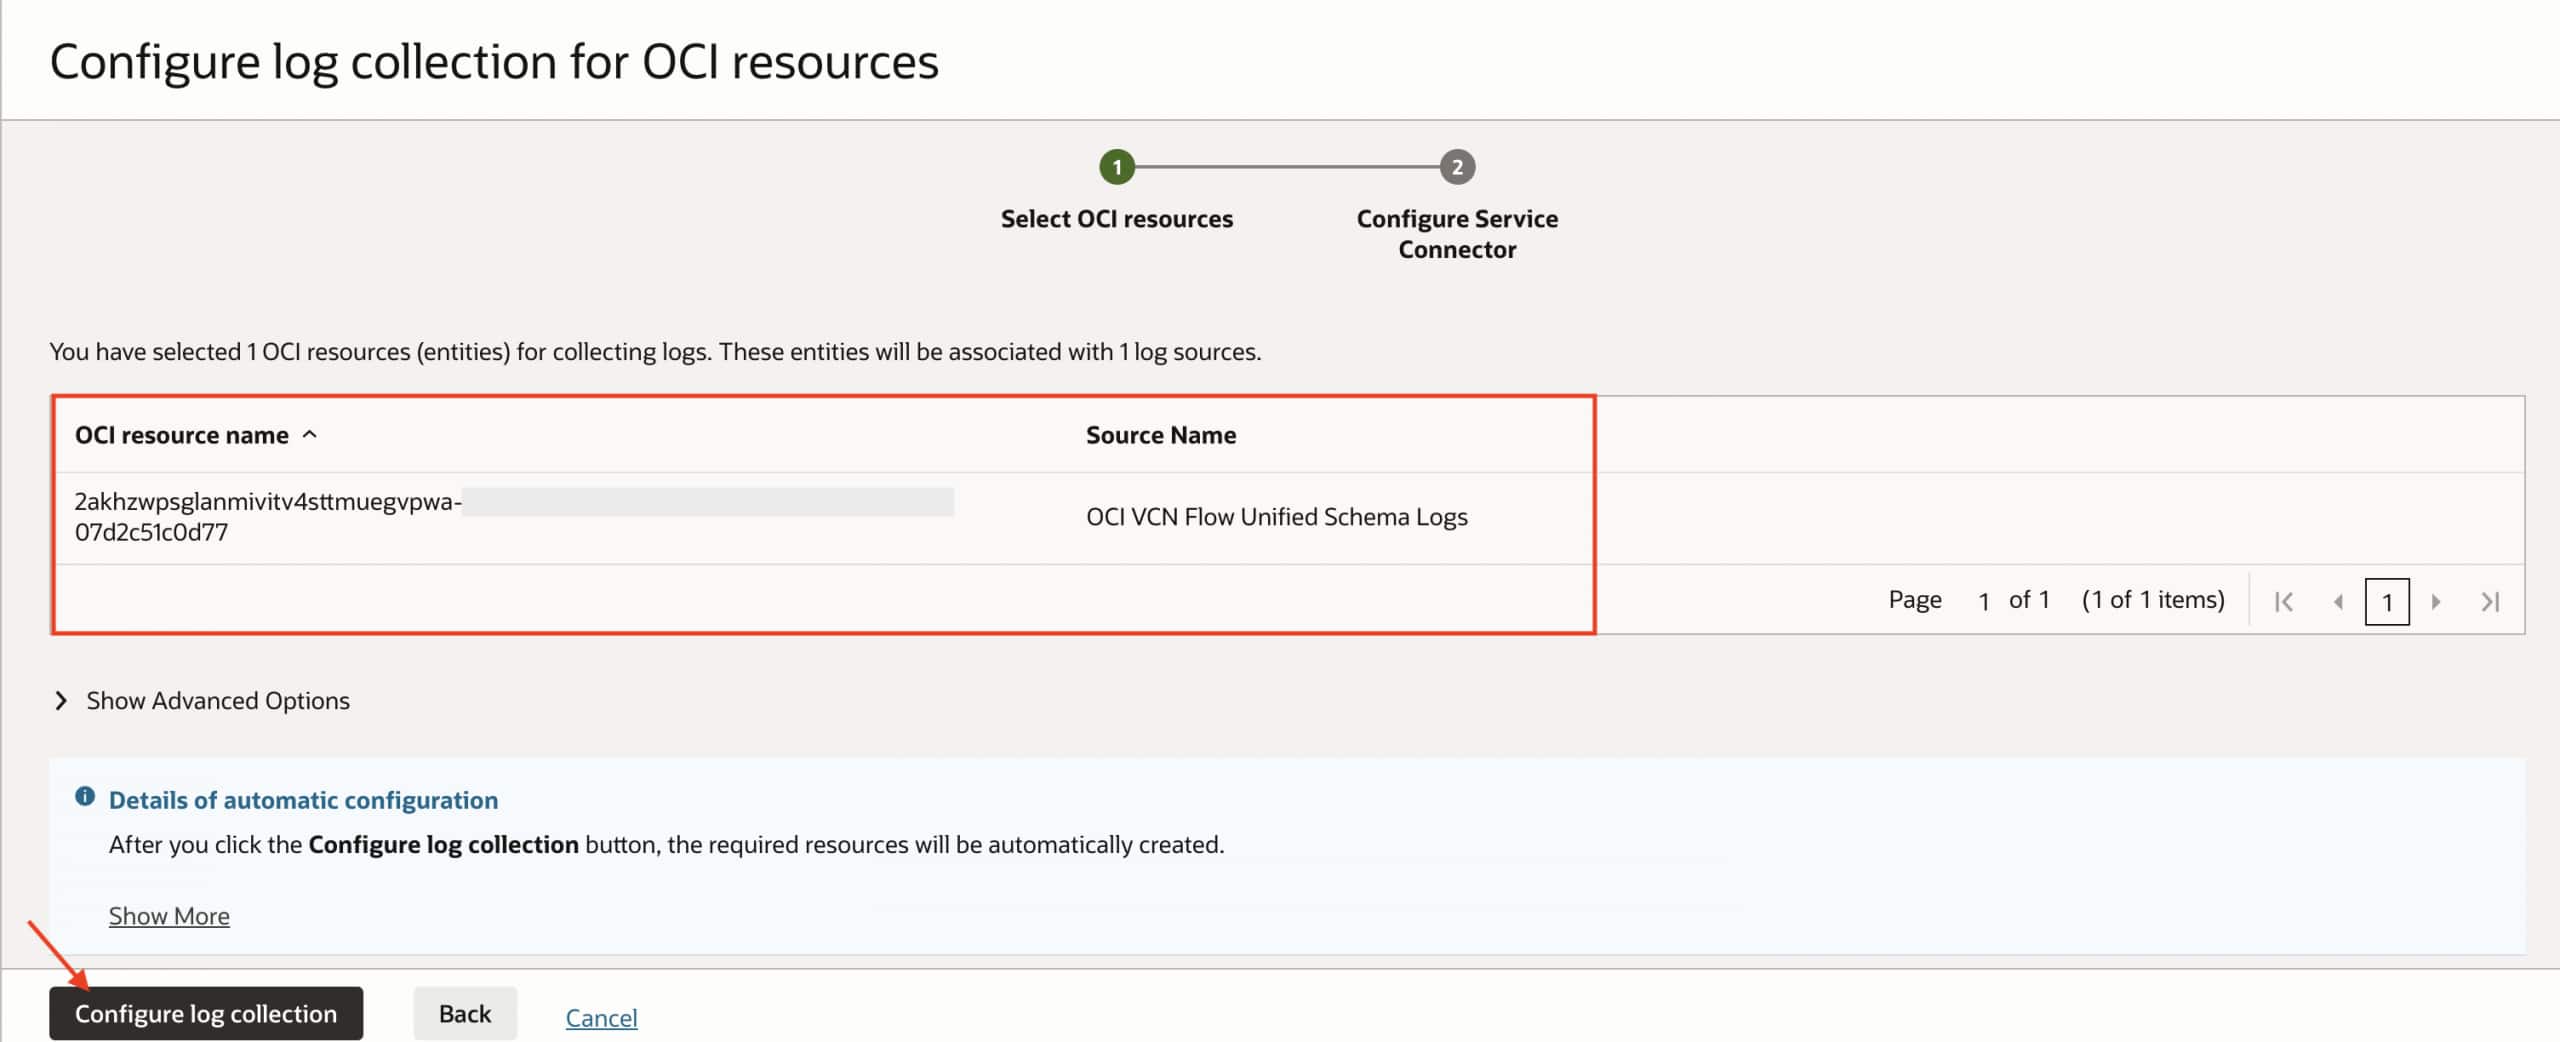
After setup, verify that recent records from the expected resources are arriving in Log Analytics.
In the OCI Console, go to Observability & Management → Log Analytics → Dashboards, select the appropriate compartment, search for VCN, and open the VCN Flow dashboard available in your environment.
Within the dashboard, select the investigation time range, log-group compartment, and relevant entity filters. The compartment used to locate the dashboard controls its listing; the filters inside the dashboard determine the scope of the logs being analyzed.
What the VCN Flow dashboard offers
The three tabs provide complementary views of recorded network activity. Keep the investigation time window and resource scope consistent as you move between them.
Overview: understand when traffic changed
Use Overview to see whether traffic changed around the time the problem began. Compare accepted and rejected activity over time, and read rejection percentages alongside record counts to identify an interval for closer investigation.
Check capture status before interpreting quiet charts: OK indicates a normal record, NODATA means no traffic was recorded during the capture window, and SKIPDATA indicates incomplete capture because of system errors or capacity issues. The public-IP map adds approximate geographic context where available.
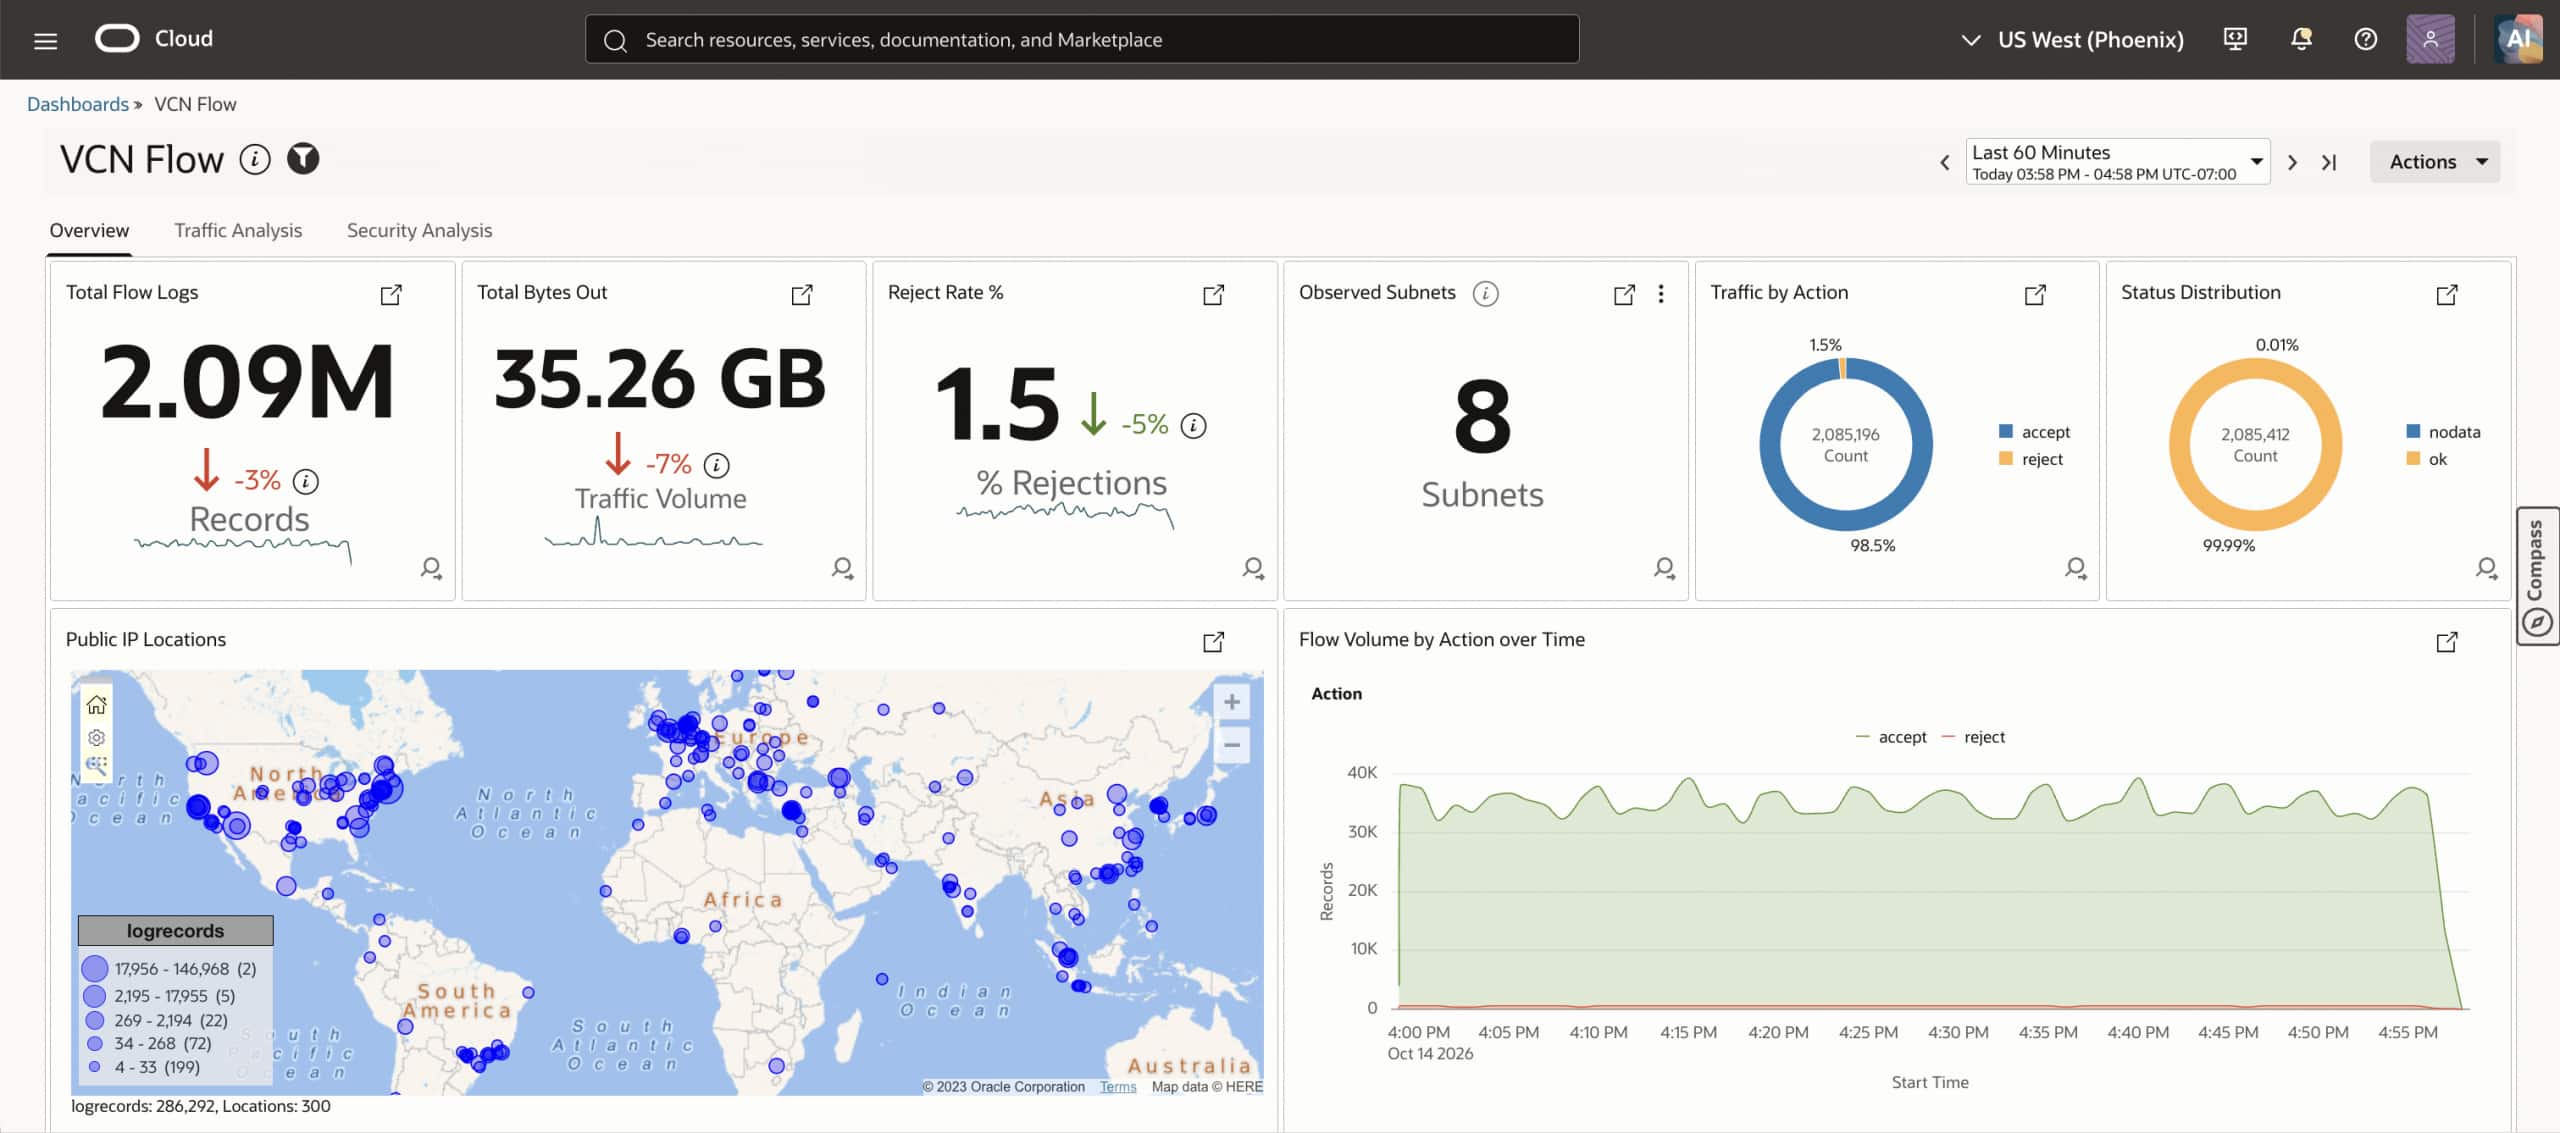
Traffic Analysis: identify the communication involved
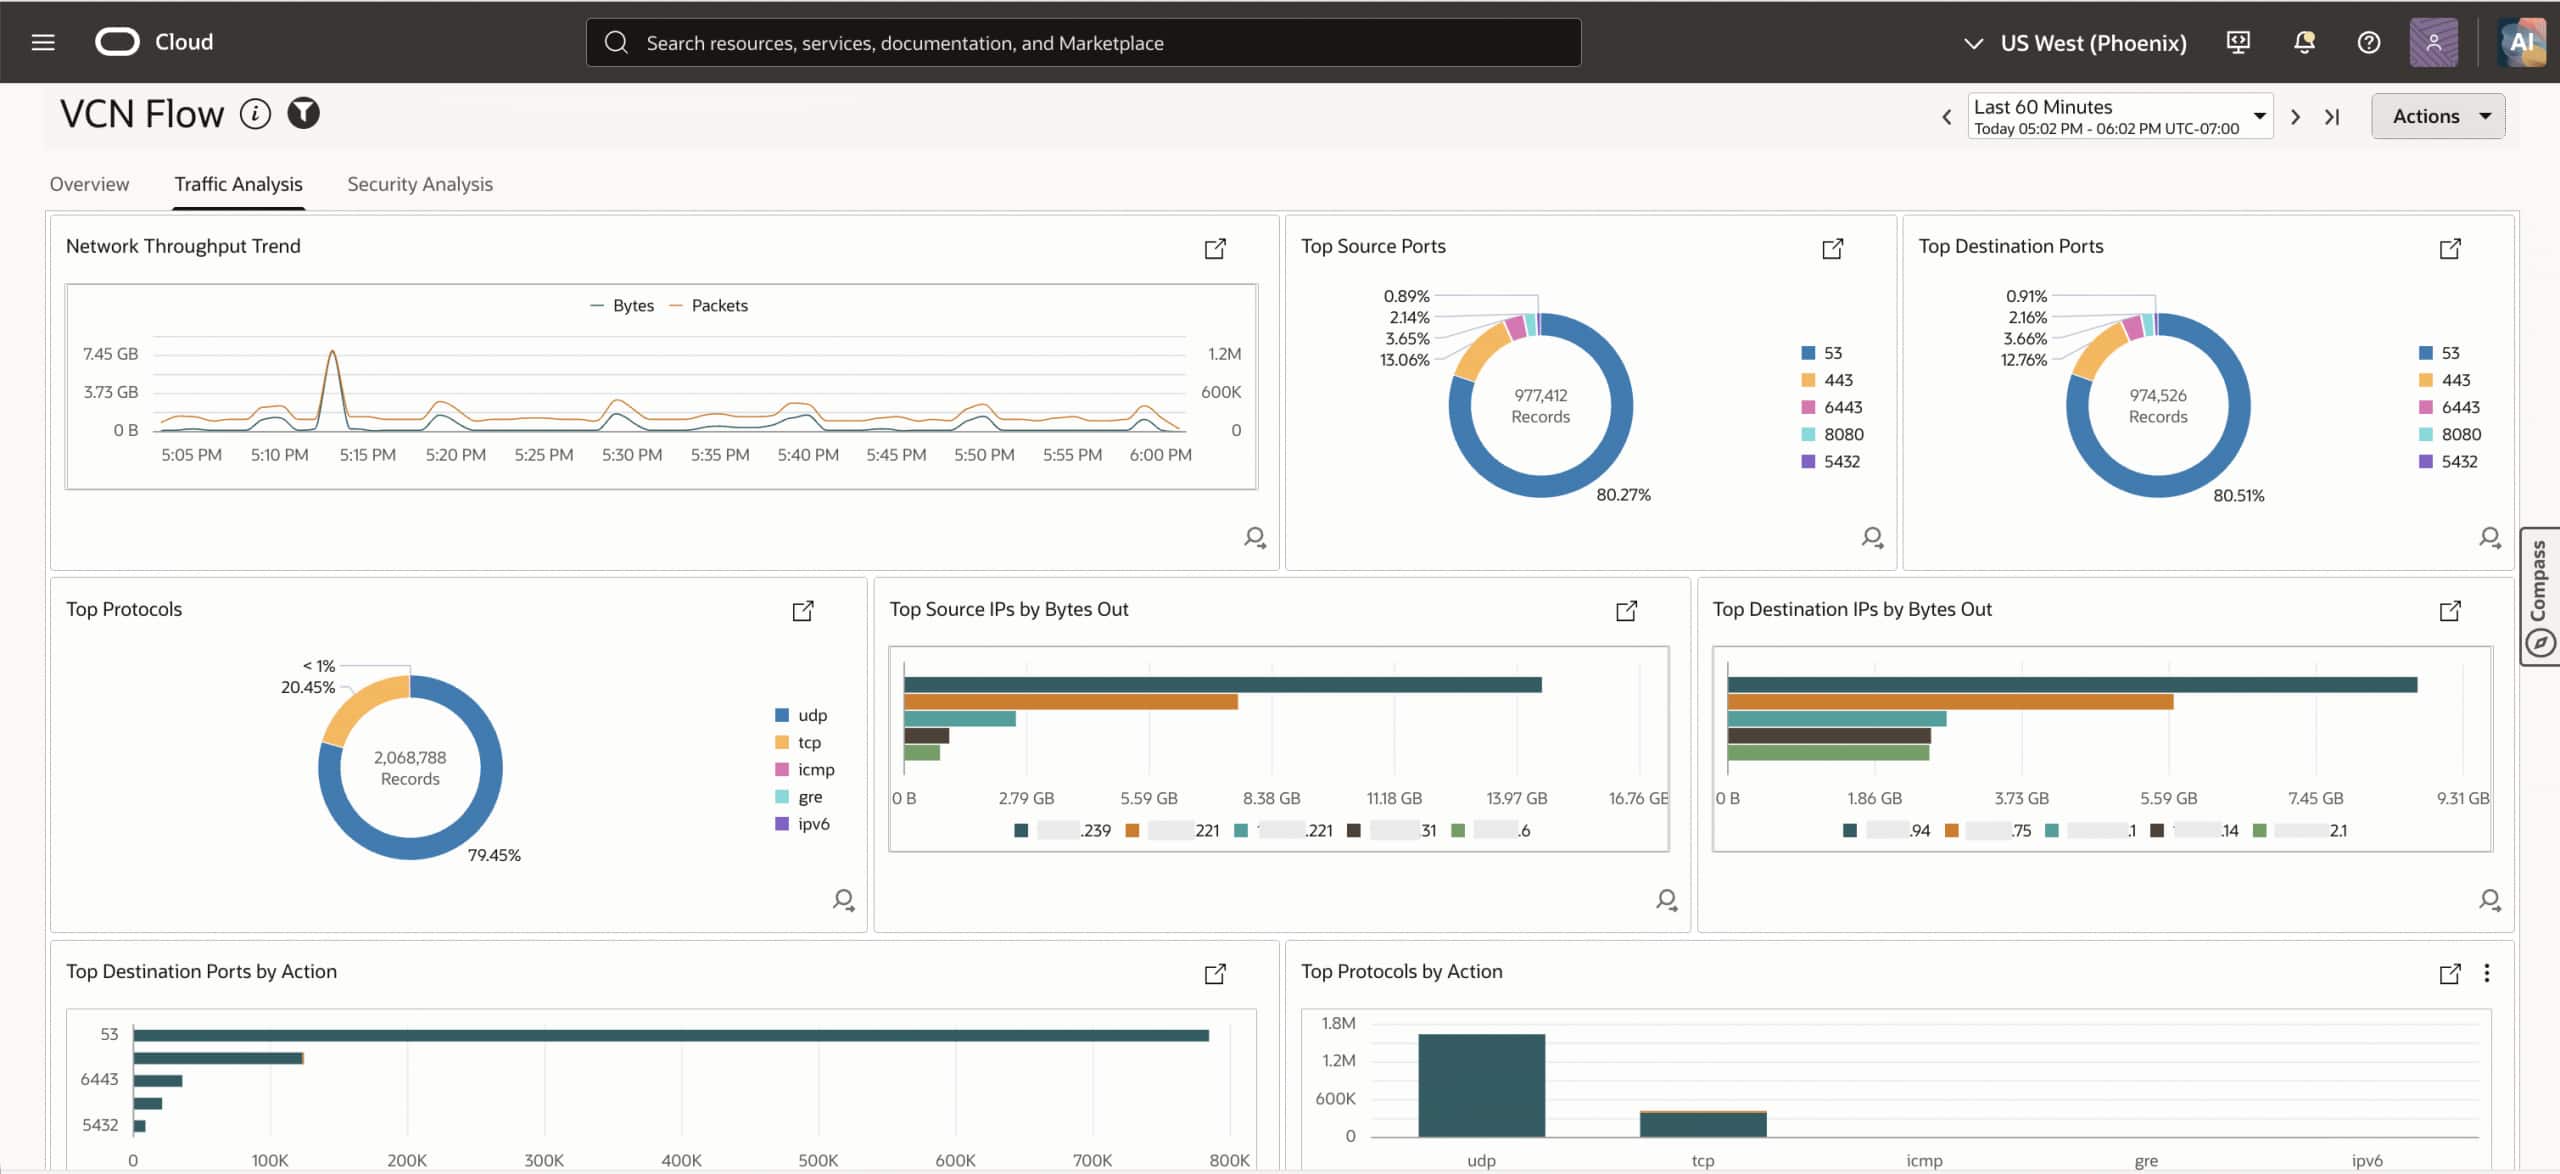
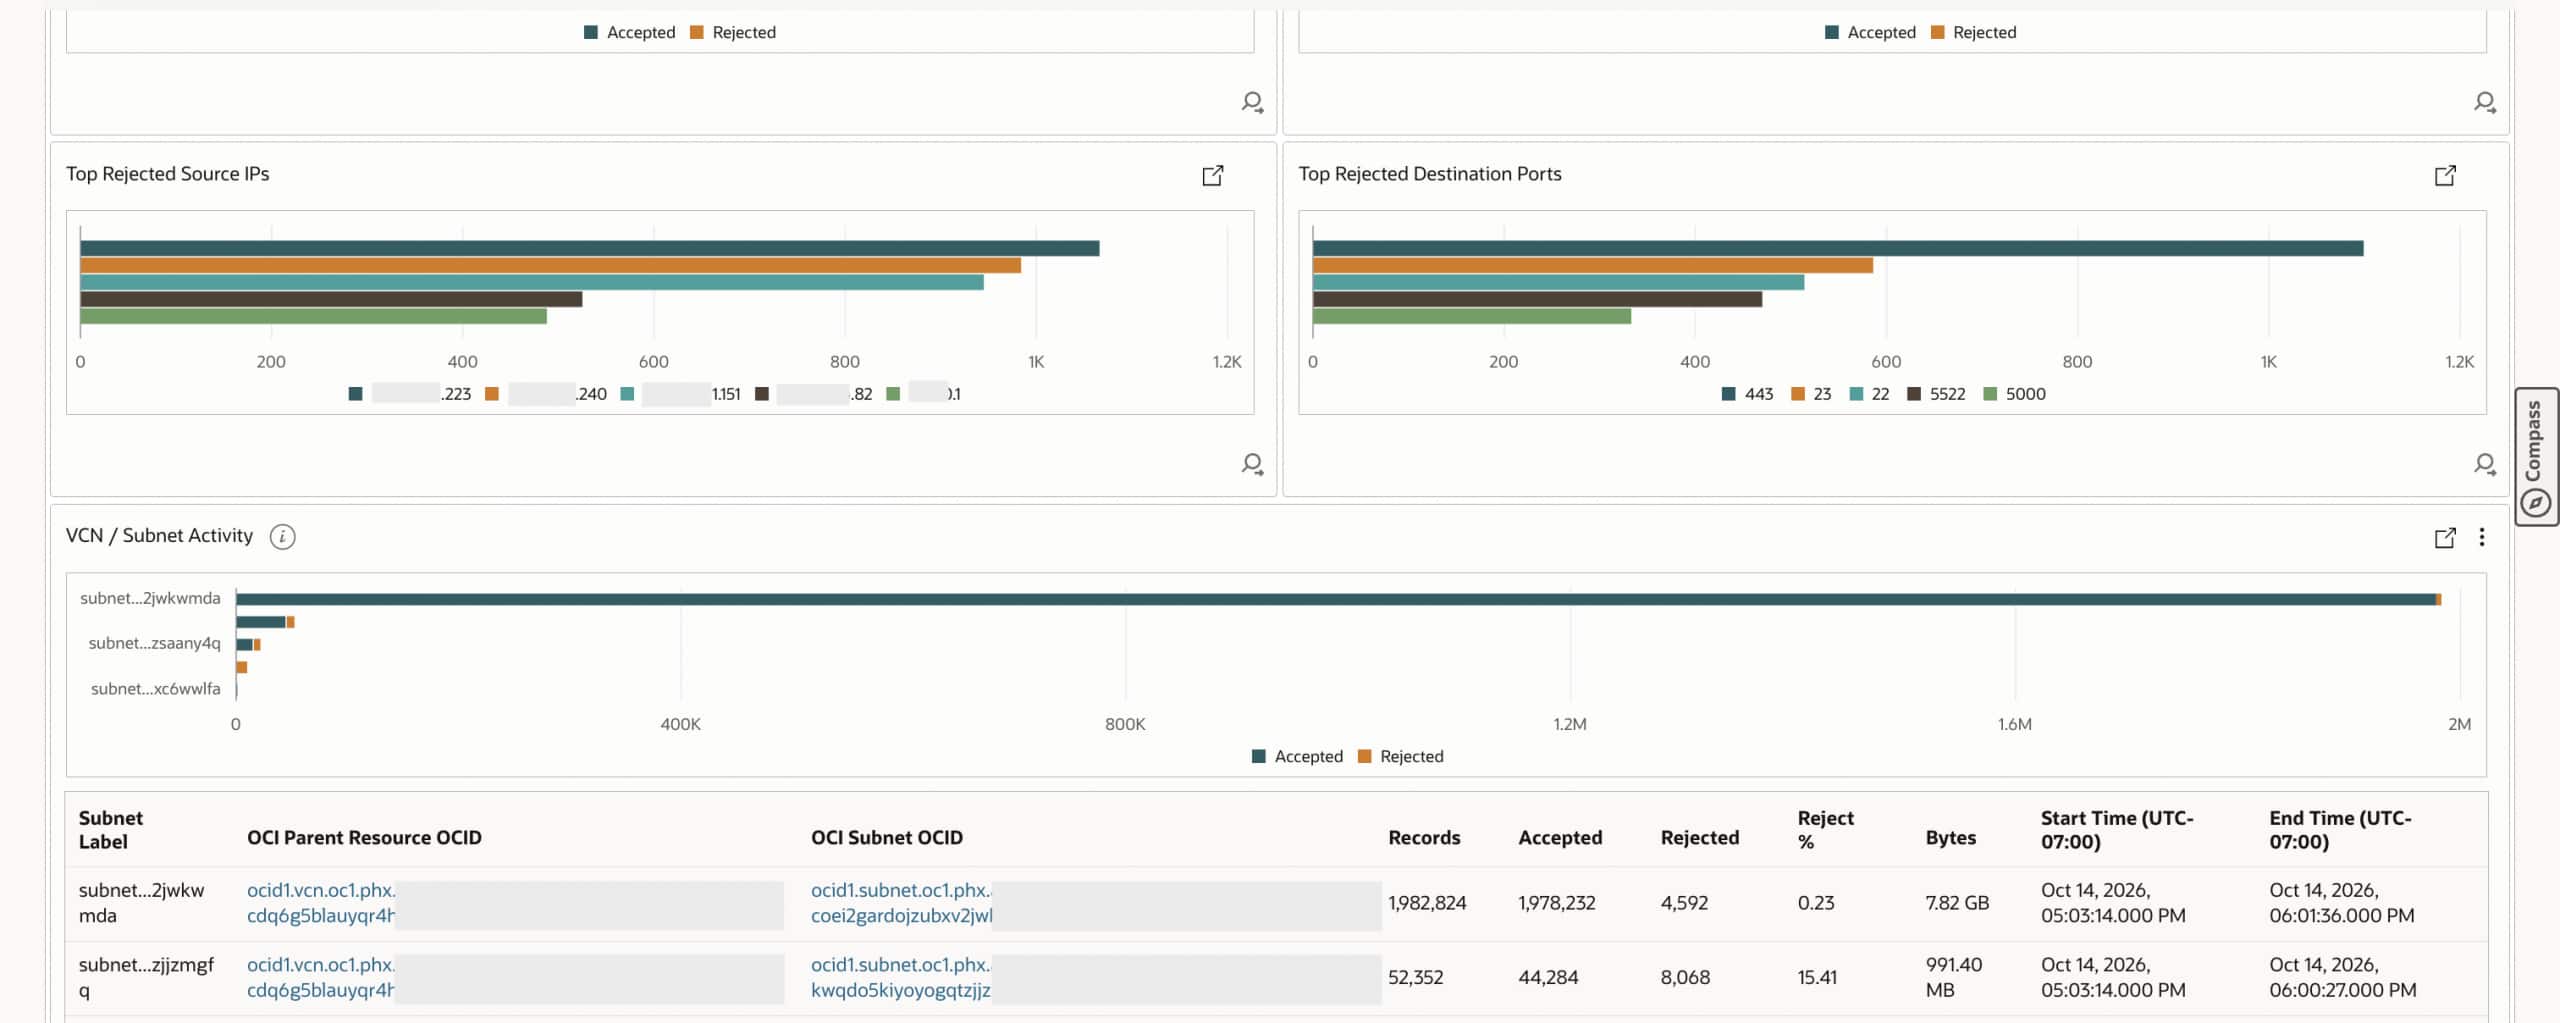
Use Traffic Analysis to identify the endpoints, ports, protocols, and subnets associated with the change. For a failed application dependency, focus on its expected destination and port, compare accepted and rejected activity, and examine matching records when the top results do not show the expected communication.
Compare byte and packet trends over consistent intervals, and use subnet activity to focus the investigation. Treat byte totals as recorded activity within the selected scope; observations from multiple interfaces can include the same communication more than once.
Security Analysis: assess how broadly activity extends
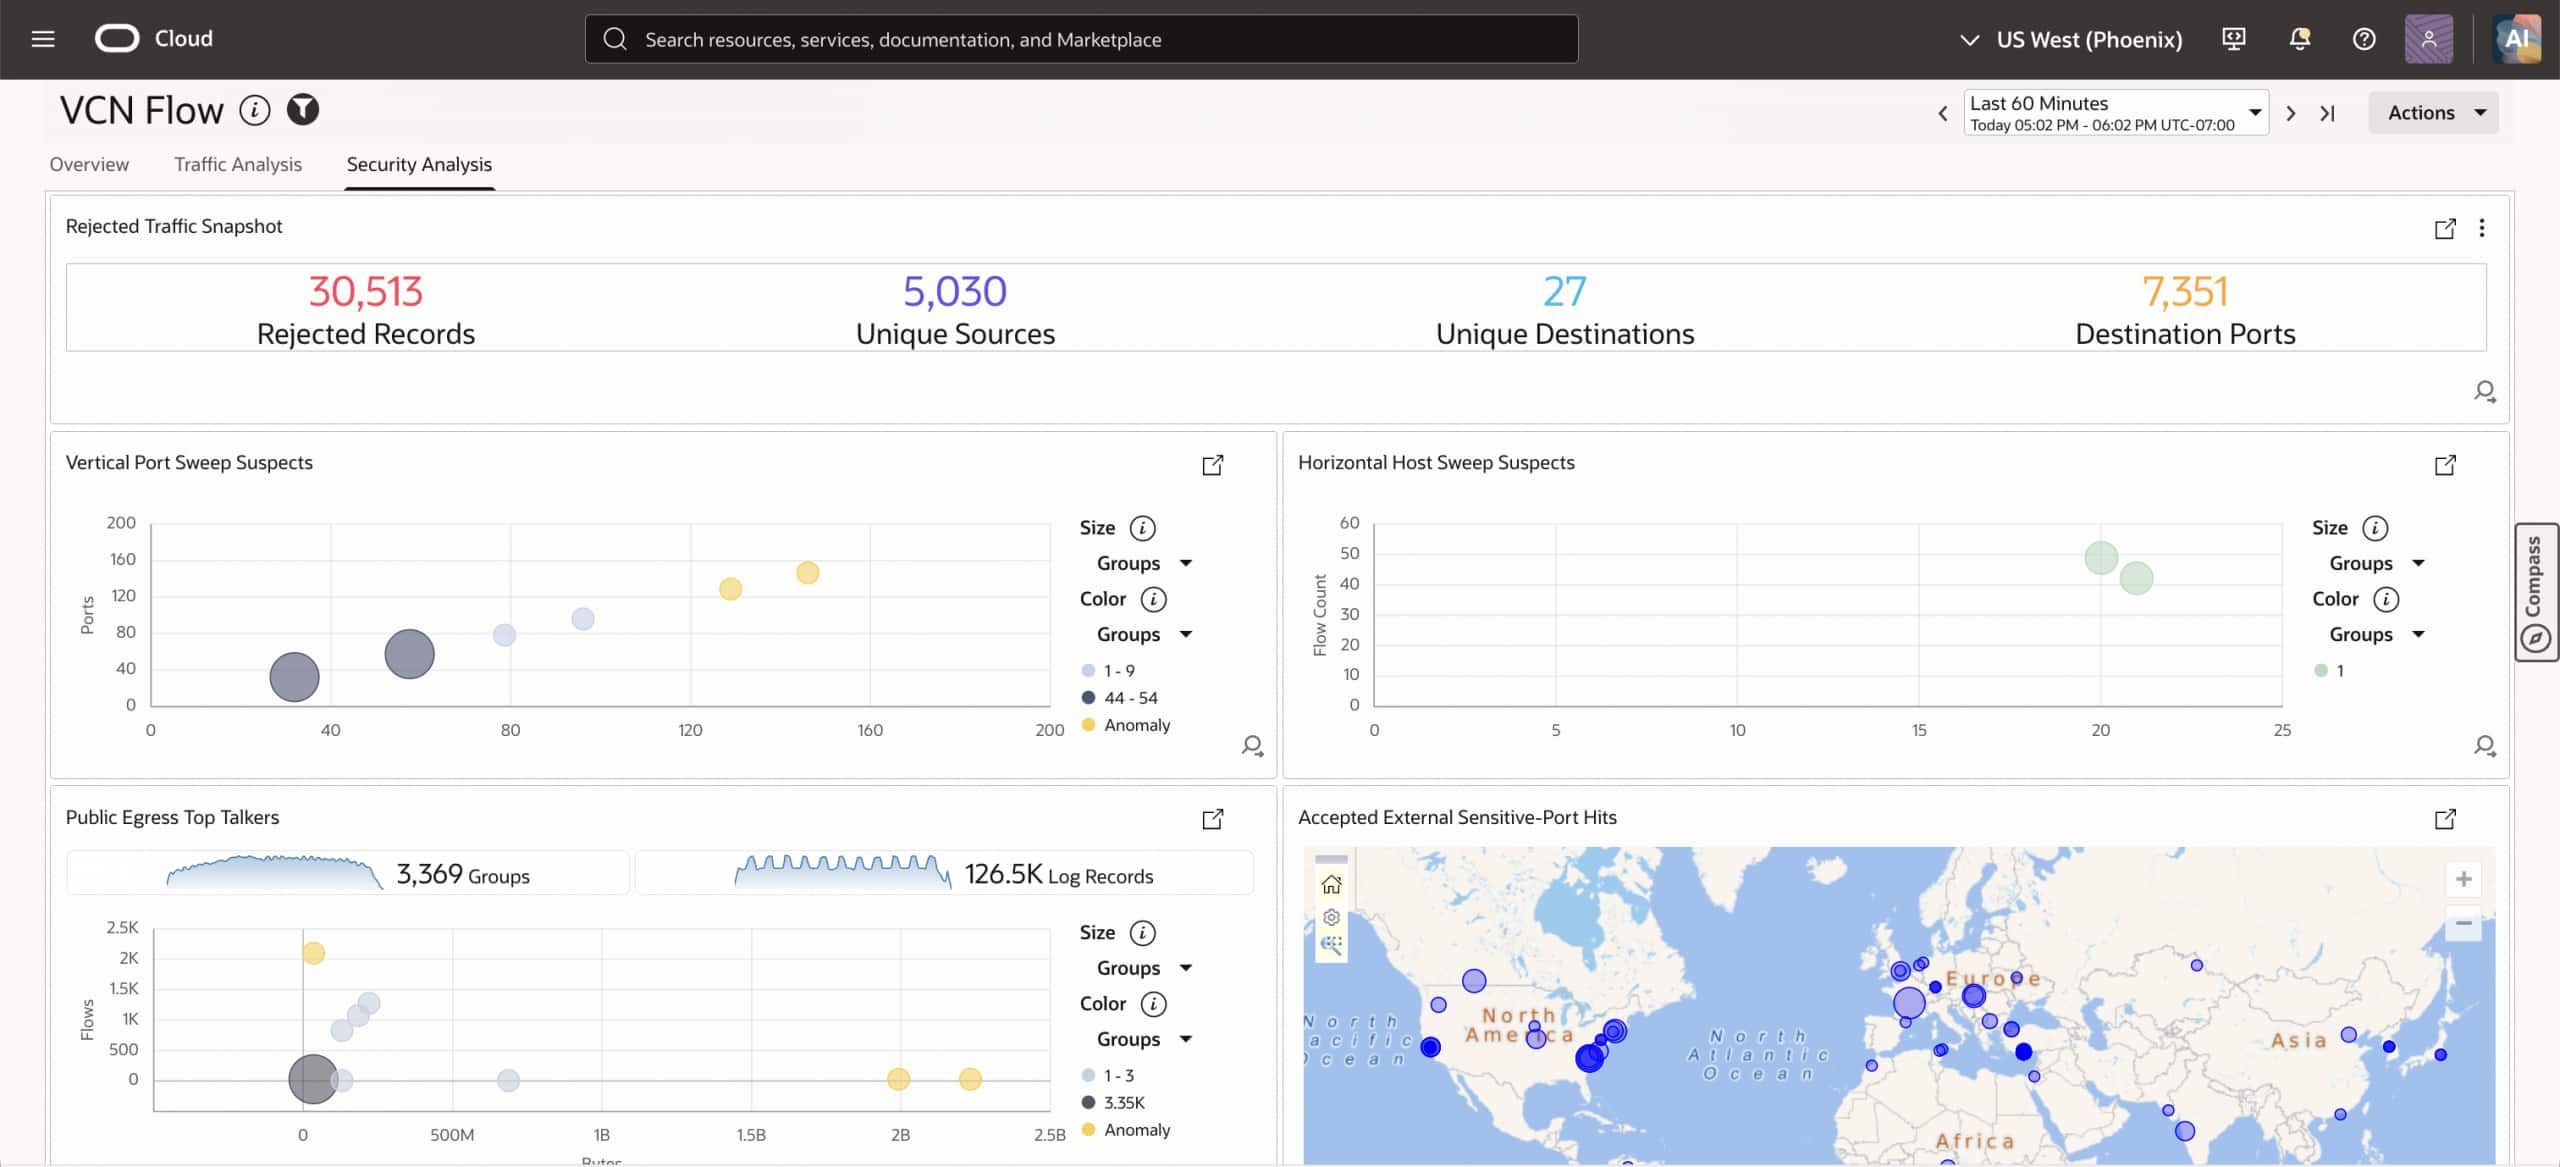
Use Security Analysis to determine whether activity is concentrated on the expected dependency or extends across other hosts and ports. Possible vertical port sweeps involve a source contacting multiple ports on one destination; horizontal host sweeps involve a source contacting multiple destinations on the same port.
The tab also supports reviewing recorded transfers to public destinations and accepted access to selected sensitive ports where the required location information is available. Compare these patterns with expected workload behavior and approved monitoring activity before deciding how to respond.
Use flow-log evidence to choose the next check
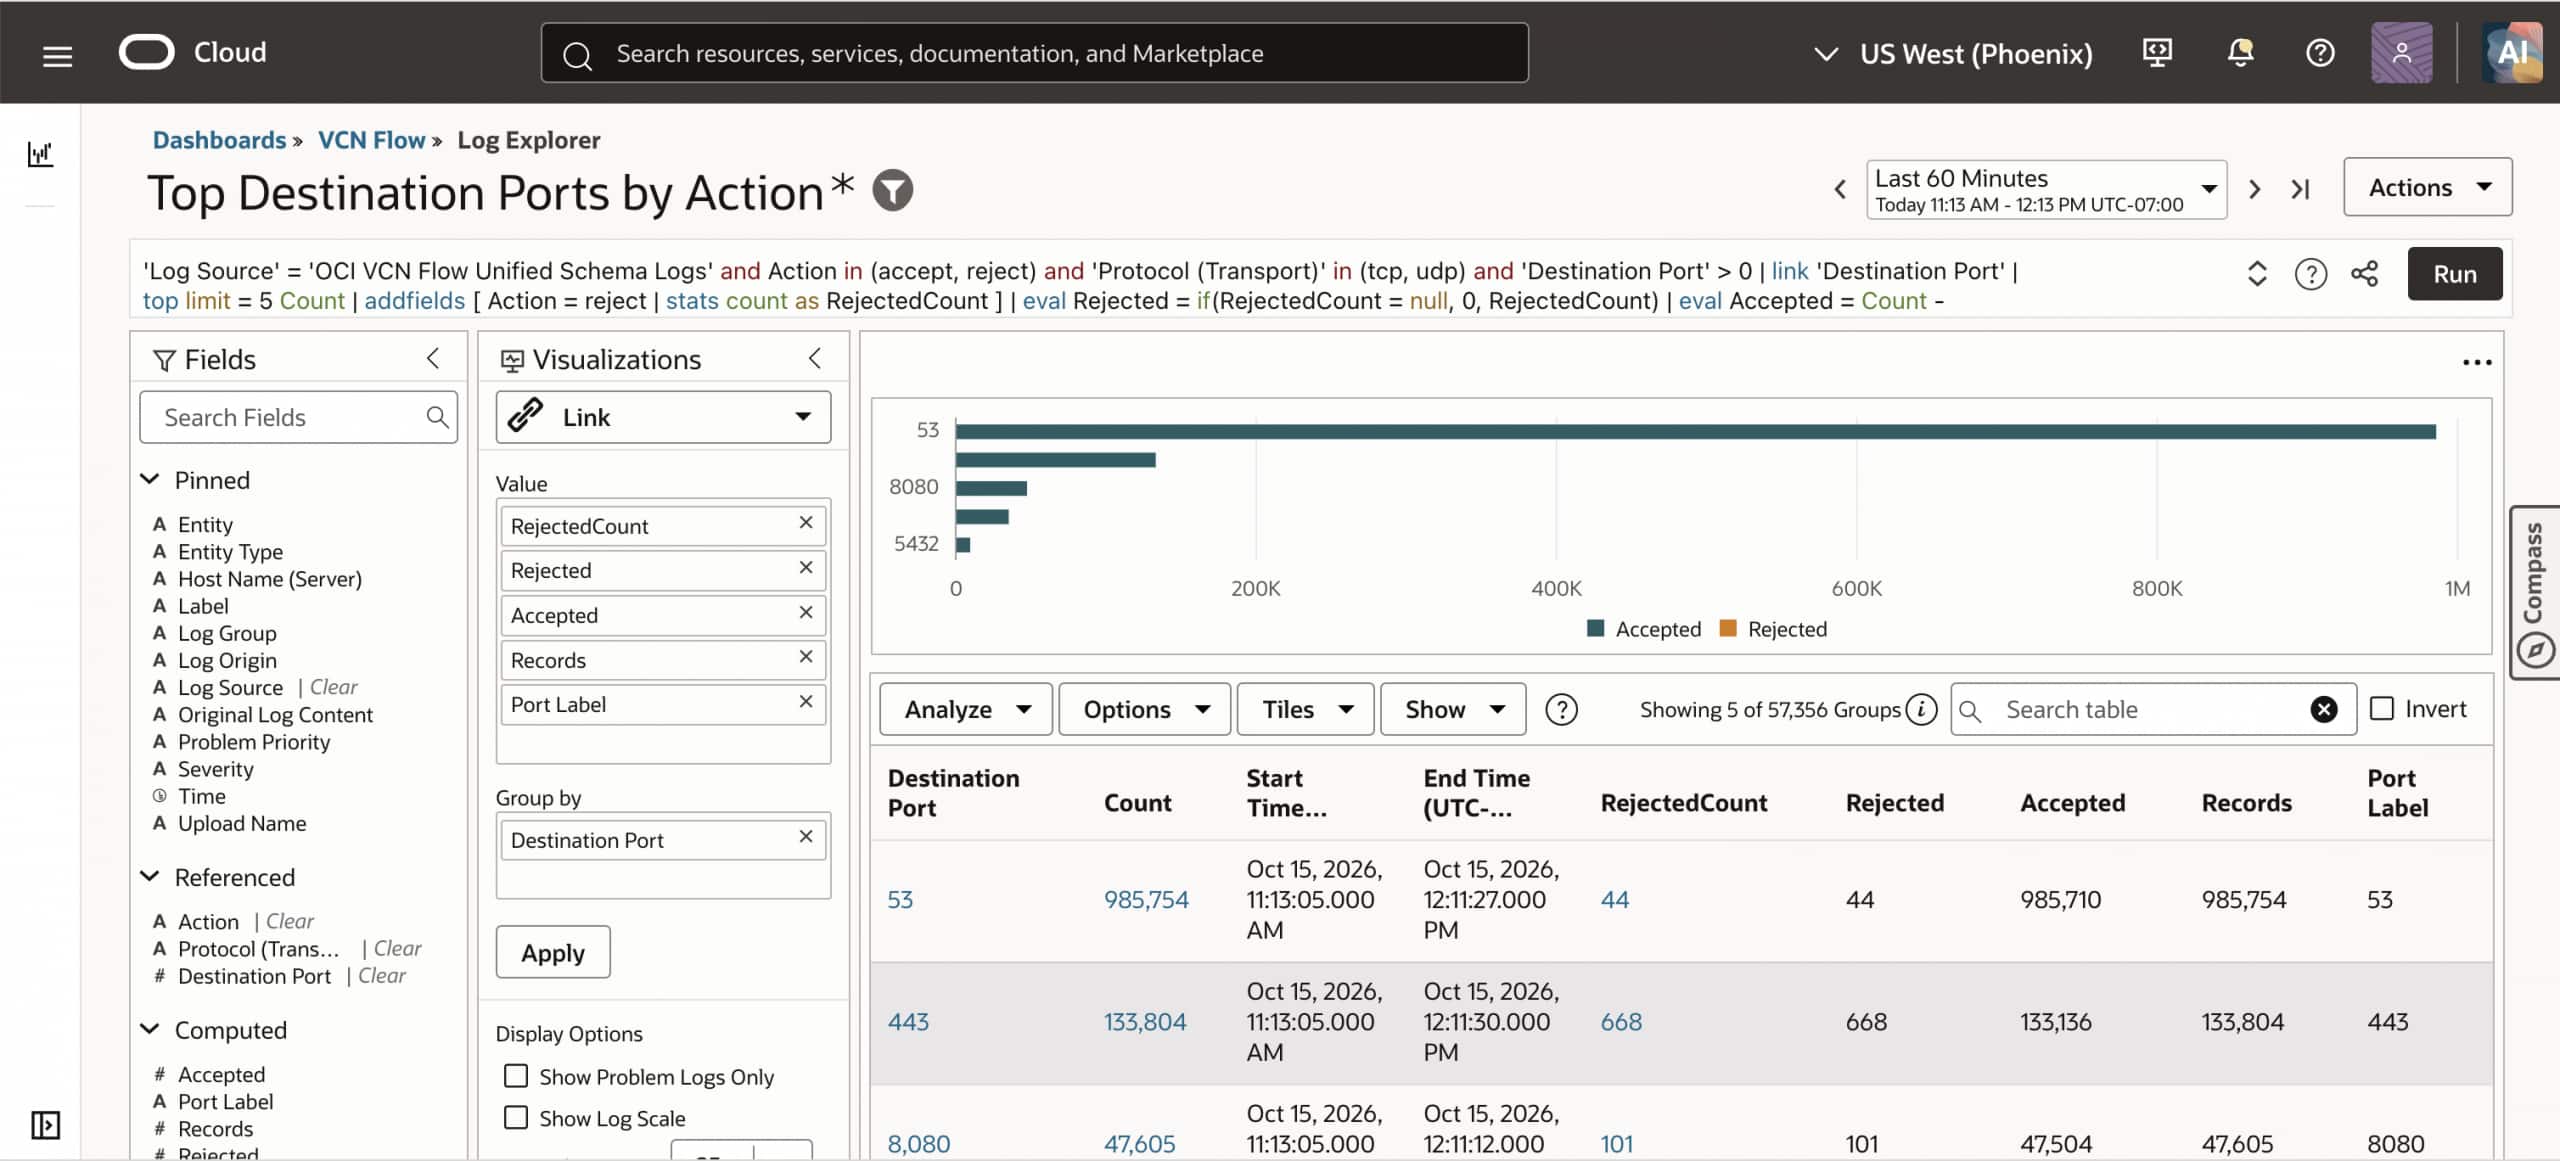
For the connectivity scenario, open Top Destination Ports by Action in Log Explorer. Confirm the investigation scope, compare the relevant port’s accepted and rejected counts, and continue by examining matching flow-log records for the dependency’s endpoints.
Review the addresses, ports, protocol, action, and capture timestamps. ACCEPT and REJECT describe the security-rule decision recorded for the observed traffic. An accepted record alone does not confirm that the entire network path worked or that the application received a successful response.
Use the evidence to guide your next check:
| Rejected records match the dependency’s endpoints and port after the deployment. | Compare applicable security lists and network security groups with the intended communication and recent configuration changes. |
| Matching records are accepted, but the application still fails. | Examine service health, listeners, application errors, and TLS or authentication evidence. Continue checking the remaining network path where needed. |
| Expected activity is missing from the selected logs. | Verify the time range, resource scope, capture filters, sampling, ingestion, and reported capture gaps. Missing records alone do not establish that no traffic occurred. |
If the investigation confirms that an unintended configuration change blocked the dependency, correct the configuration to match the intended access and repeat the application request. Validate both the network observations and the application result.
The VCN Flow dashboard in OCI Log Analytics brings traffic patterns and supporting records together to help your teams understand network behavior and guide their next troubleshooting step.