OCI Stack Monitoring provides unified health monitoring and alarm management for applications and their underlying tech stack running in cloud or on-premises. To avoid monitoring blind spots, it’s important to be able to monitor all parts of the tech stack including network devices. OCI Stack Monitoring’s integration with collectd and Telegraf enable monitoring of a wide range of infrastructure types. In this blog, we show how you can leverage collectd’s SNMP plugin to monitor SNMP devices such as a network switch.
SNMP Monitoring for Network Devices
Simple Network Management Protocol (SNMP) is a widely adopted standard for managing and monitoring network devices, including routers, switches, firewalls, and printers. By leveraging SNMP, organizations can obtain insights into device performance, uptime, and other critical metrics.
collectd has read plugins that collect metrics for various infrastructure types. This includes an SNMP read plugin that can collect performance metrics from SNMP-enabled devices such as switches and routers. Integrating collectd with OCI Stack Monitoring enables monitoring of these network devices or other SNMP-enabled devices.
Monitoring SNMP Devices is an Easy Four-Step Process
To monitor any SNMP device, follow these steps:
Step 1: Complete the prerequisites
Step 2: Configure the management agent to receive data from collectd
Step 3: Configure the SNMP plugin for collectd
Step 4: Configure availability status monitoring (optional, but recommended)
Now we will discuss these steps in more details.
Step 1 – Complete the prerequisites
Follow the documentation to ensure the management agent is of the appropriate version, collectd is configured and policies are in place.
Step 2 – Configure the management agent
This is a one-time step to enable the management agent’s metric receiver to receive metric data from collectd through its write_http plugin.
In Stack Monitoring, go to the Import resources page under the Resource management menu and click on “Import resources”. Choose Type “CollectD” and your management agent and start the process as shown below.

As part of enablement, a certificate will be generated at the agent directory (<agent_state_directory>/extension_state/StackMonitoringMetricReceiver/certs/clientCerts/stackmonitoring-ca.crt).
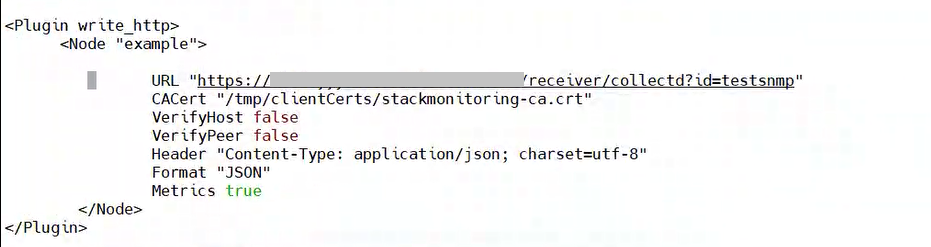
Copy this certificate to a directory that is accessible by collectd. In the collectd.conf, ensure the write_http plugin is loaded, and the metric receiver URL and location of this certificate are specified in the write_http plugin section of collectd.conf. This will enable collectd to send metric data to the metric receiver listening on the agent.
Step 3 – Configure SNMP Plugin for collectd
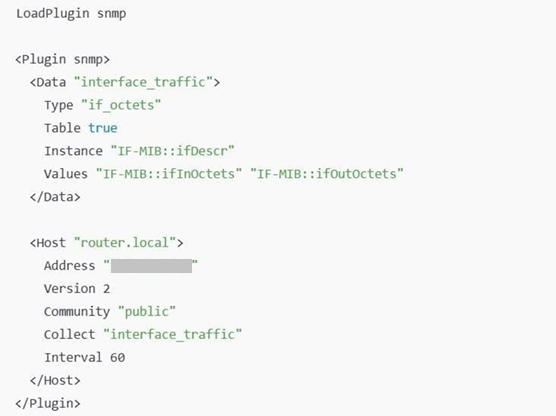
collectd has Read Plugins that collect metrics for various infrastructure types. To collect performance metrics for SNMP devices, configure the collectd.conf file to load the SNMP plugin and collect metric values from the specified device. An example configuration is shown below:
Next, run Import resources again to import the SNMP device as a resource in Stack Monitoring.
Note: All read plugins configured in collectd.conf will be imported in Stack Monitoring. You will not have to do this step for each plugin.

Step 4 – Configure availability status monitoring (optional but recommended)
If the device doesn’t include an availability status metric, you can use another metric as a proxy for availability status monitoring. To set this up, use the Configure resource types UI to specify the metric that will be used to determine availability status.

Then run Import resources again to set up the use of this specified metric to determine availability of the device.

Monitoring SNMP Devices with Ease
Upon completion of the import process, you can now monitor your SNMP-enabled device in Stack Monitoring. You can easily drilldown to the device’s built-in homepage to monitor its availability status and performance. You can enable the ML-based anomaly detection on any of its metrics to start calculating its baseline performance and flag anomalies if the performance is outside expected boundaries. From the homepage, you can also go to the Topology page and create associations with other resources dependent on that device, e.g. hosts. These associated resources will now automatically have visibility into the health of the SNMP device from their own topology views.

With the integration with collectd (and Telegraf), Stack Monitoring can monitor SNMP devices and a wide variety of infrastructure and application types. This enables you to have better end-to-end visibility into the performance of your application stack.
Get started with Stack Monitoring today!
Resources:
- Importing collectd-based Resources using the UI (documentation)
- Stack Monitoring Blog Home
- Stack Monitoring Videos