Diagnosing Java performance issues in production is a challenging task. Unlike controlled development stages, production environments are often sensitive to even minor interruptions. Traditional diagnostic methods require reproducing the problem in-house or restarting servers to add instrumentation, which can generate impacts to the application’s uptime and user experience.
Oracle JVM Diagnostics (JVMD), a feature of Oracle Enterprise Manager, offers a powerful, always-on solution for identifying and resolving these production problems in real time, without the need for code changes or server restarts.
Designed for Lightweight, Continuous JVM Diagnostics
At the core of JVMD is a lightweight engine deployed within the Enterprise Manager framework. JVMD Agents, installed on managed application servers, use a low-overhead Java thread sampling technique to collect runtime data. This information is securely transmitted to the JVMD Engine via SSL and displayed within the Enterprise Manager console for runtime and long-term analysis.
The architecture is designed for minimal impact on production systems, avoiding performance spikes. Because JVMD does not require instrumentation or downtime, it supports continuous diagnostics, even in mission-critical environments.
Visualize JVM Performance Activities with Java Workload Explorer
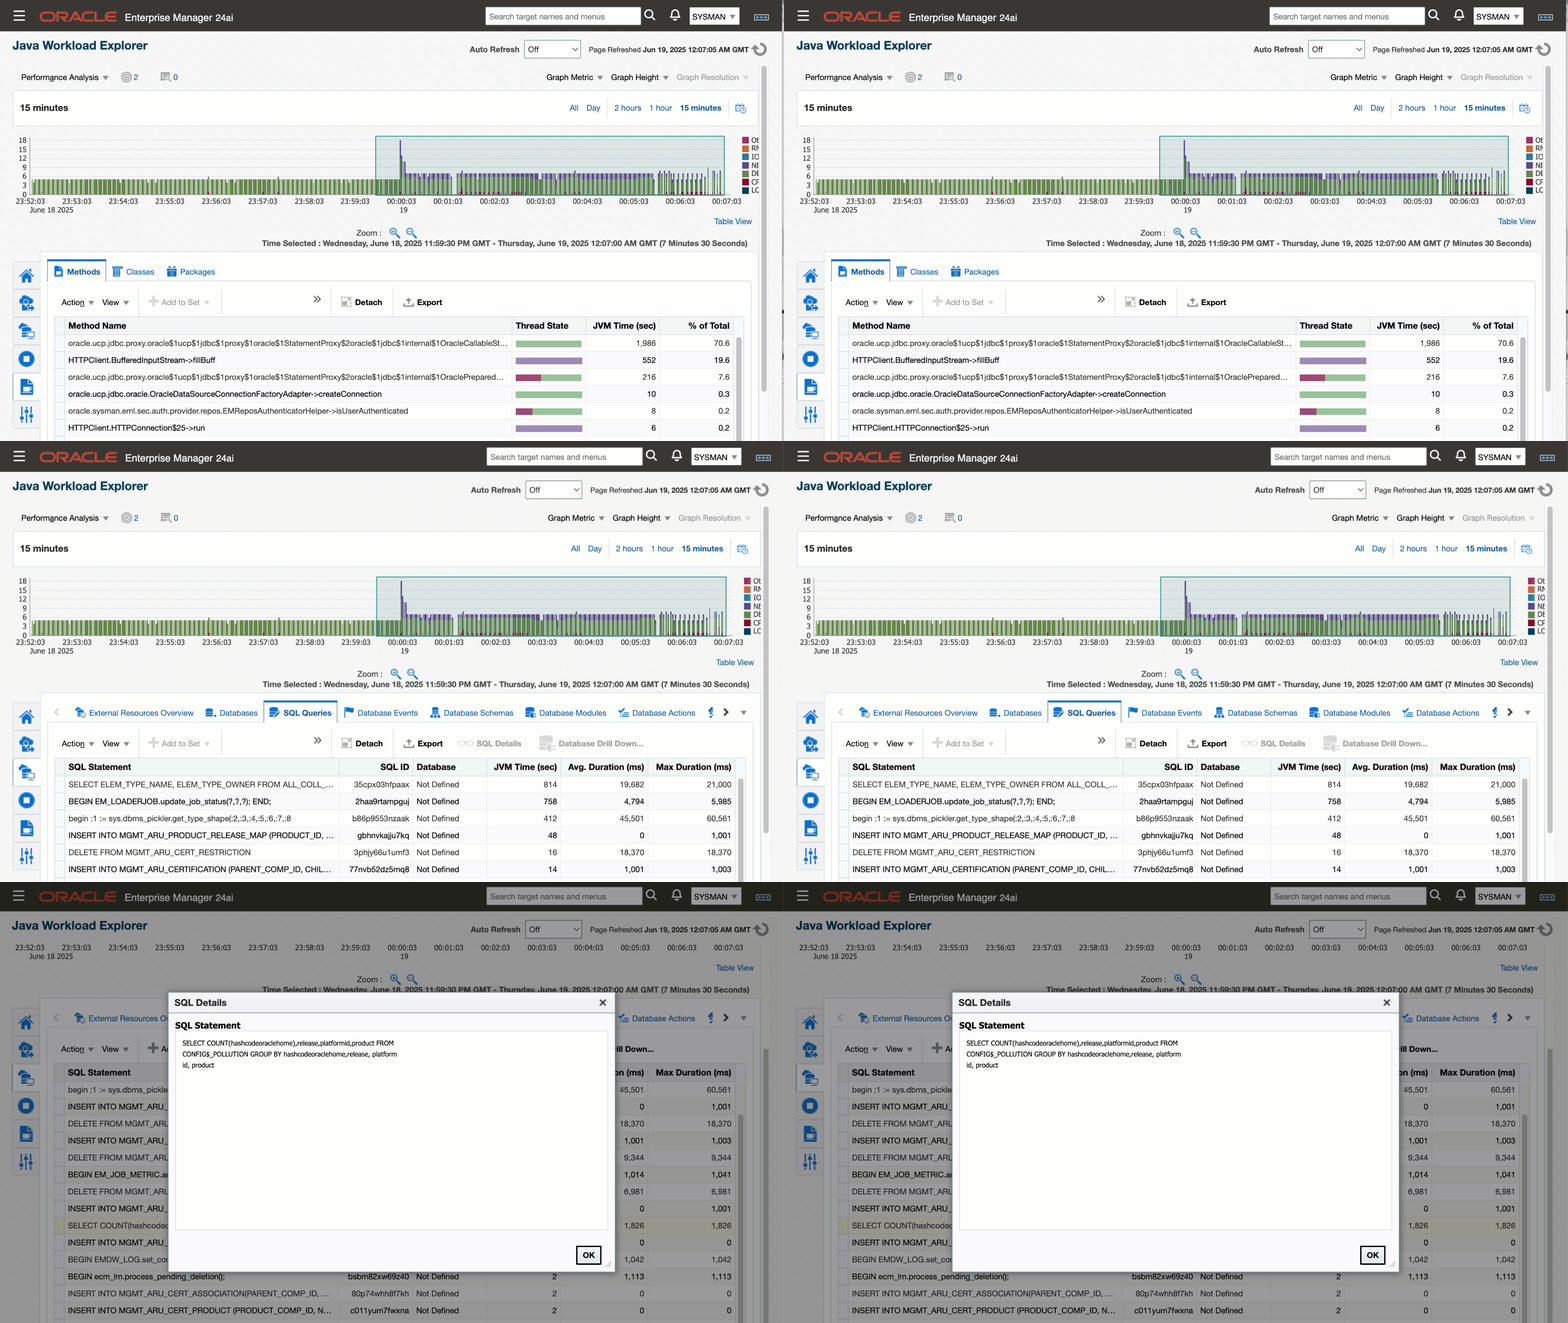
One of the noticeable features of JVMD is the Java Workload Explorer (JWE). This visual tool offers a centralized management console, allowing you to compare JVM stack datasets over time or across different servers. By comparing the problem set with a known good baseline, you can identify what changed, whether it’s a new method call, a longer execution path, or a specific SQL query causing delays.

Figure 1 : Oracle JVM Diagnostics Java Workload Explorer page
Key benefits of JVM Diagnostics
- JVMD offers continuous visibility by always-on diagnostics, enabling administrators to monitor Java workloads running in production without interrupting operations.
- It requires zero instrumentation. There’s no need to modify application code or reconfigure servers, making it quick to deploy and ideal for environments where stability is critical.
- It generates minimal overhead by using efficient sampling to reduce performance impact.
- The tool provides full-stack visibility, tracking user requests and thread activity to heap usage, garbage collection, and database interactions. This comprehensive view helps administrators correlate symptoms across the application stack.
- Java Workload Explorer offers intuitive visual analysis, such as easy to spot anomalies, compare different time periods, and contextual drill down into performance bottlenecks.
Oracle JVM Diagnostics provides high visibility into the JVM stack and helps administrators to stay ahead of performance issues, ensures application reliability, and better user experiences. To explorer more about Oracle JVM Diagnostics features, check out a 10-minute video demonstrating the feature: Diagnosing Java in Production with JVM Diagnostics
Resources
- Oracle Enterprise Manager Middleware Management Overview
- Introducing new non-Oracle middleware plug-ins in Enterprise Manager release 24.1
- Managing Oracle WebLogic Server with Oracle Enterprise Manager
- Monitor WebLogic on Kubernetes using Oracle Enterprise Manager
