OCI Ops Insights (OPSI) service, part of the Oracle Cloud Observability and Management platform, is a suite of solutions that help enterprises optimize Oracle cloud and on-premises capital expenditure and application performance.
- Capacity planning – enables customers to optimize current spend and plan for future capital expense on core datahase and host resources, including GPU
- SQL Insights – helps customers understand and optimize application workloads at the SQL level, including plan changes
- ADDM Spotlight – helps customer evaluate long-term strategic cost-benefit tradeoffs of taking complex performance advice from Automatic Database Diagnostic Monitor (ADDM), Oracle’s database performance expert system
Each of these features gathers and curates data specific to their use case. This data is analyzed using machine learning techniques to produce “insights” about incidents, trends, and patterns in the data specific to the feature.
Easily Analyze Database Performance with a New Application
The new Database Performance dashboard in Ops Insights features comprehensive fleet-level views of all databases that also centralizes and aggregates insights from each of the features above.
You can track the overall workload and identify top-performing databases by load. With customized insights based on Time Model, Wait Class, and ADDM Data, you can easily pinpoint actionable areas for optimization. Dive deeper into specific databases with more granular information on top activities and ADDM recommendations that help you make better informed decisions.
Use cases
- Track the overall workload and identify top-performing databases by load across the fleet
- Pinpoint actionable optimization areas with Time Model, Wait Class, and ADDM Data customized insights
- Dive deeper into specific databases within a fleet with granular information on top activities and ADDM recommendations to make better informed decisions
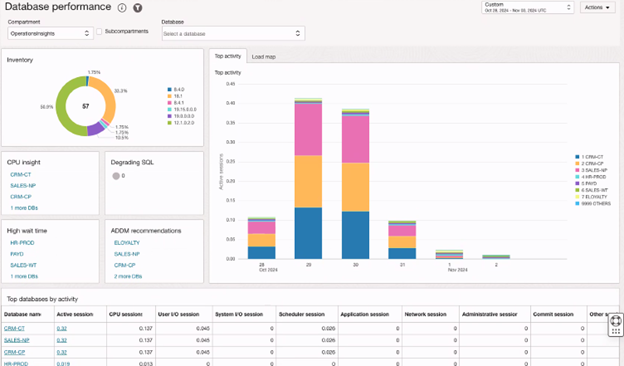
The Database performance dashboard allows you to view database inventory. The pie chart provides detail that identifies different types of database versions and the percentage breakdown of your environment. Below this graph the following insights are displayed:
- CPU insight: Databases shown having excess database time, and/or scheduler wait time exceeding 1% of total database time. This insight is indicative of databases with saturated CPU’s or the Resource manager CPU-limiting some consumer groups
- Degrading SQL: Databases having SQL with a degraded response time
- High wait time: Databases where non IO (Input-Output) wait time has exceeded 50% of the database CPU time
- ADDM recommendations: Databases having ADDM spotlight recommendations that will result in high performance improvement benefits
In figure 1, the main graph area shows two tabs, Top activity and Load map. The Top Activity chart details a breakdown of total fleet database time over the selected time period. It will show the top 7 busiest databases in units of average active sessions. The Load map displays a treemap of the total database time over the selected time period. The table at the bottom of the dashboard shows the Top databases by activity, providing a view of the list of top 10 databases by active sessions.
Get started!
Find OPSI under the Observability and Management menu in the Oracle Cloud Console. The service is accessible through the Console, CLI, and REST API. OPSI is available to use with HeatWave MySQL, on-premises MySQL, Autonomous Databases, external databases (Oracle Databases deployed on-premises), and Oracle Cloud Databases on bare metal, VMs, and Exadata Database Services on Dedicated Infrastructure and Exadata Cloud at Customer.
To test drive this feature and many other features in OPSI before even signing up for the service, try the demo mode using your tenancy or by signing up for Livelabs. Not yet a customer? Sign up for an Oracle Cloud Infrastructure trial account!
Resources
- Oracle Cloud Observability and Management Platform
- Explore Ops Insights
- Hands-on lab: Get Started with Oracle Cloud Infrastructure Ops Insights
- Ops Insights Videos
- Ops Insights Technical Content
For more blogs on OPSI, visit the Observability and Management – OPSI blog space.
OPSI customers can now use the newly launched OCI Generative AI powered Oracle Support Digital Assistant. The Digital Assistant eliminates the need to manually search through the O&M documentation, and provides with quick, accurate answers directly within the OCI console interface. In addition to the answering the query, it also provides references and links to exact sections of our comprehensive product documentation. Learn more about it here.