We’re excited to introduce the latest release of Stack Monitoring which now provides essential monitoring and alarm management for GPU infrastructure and their workloads. This new feature is designed to provide turnkey monitoring for your GPU fleet allowing you to focus on your GenAI projects instead of building monitoring UIs. Rich alarm management enables you to easily set up alarms at scale and manage these across the fleet.
Monitor GPU-accelerated infrastructure across large scale environments
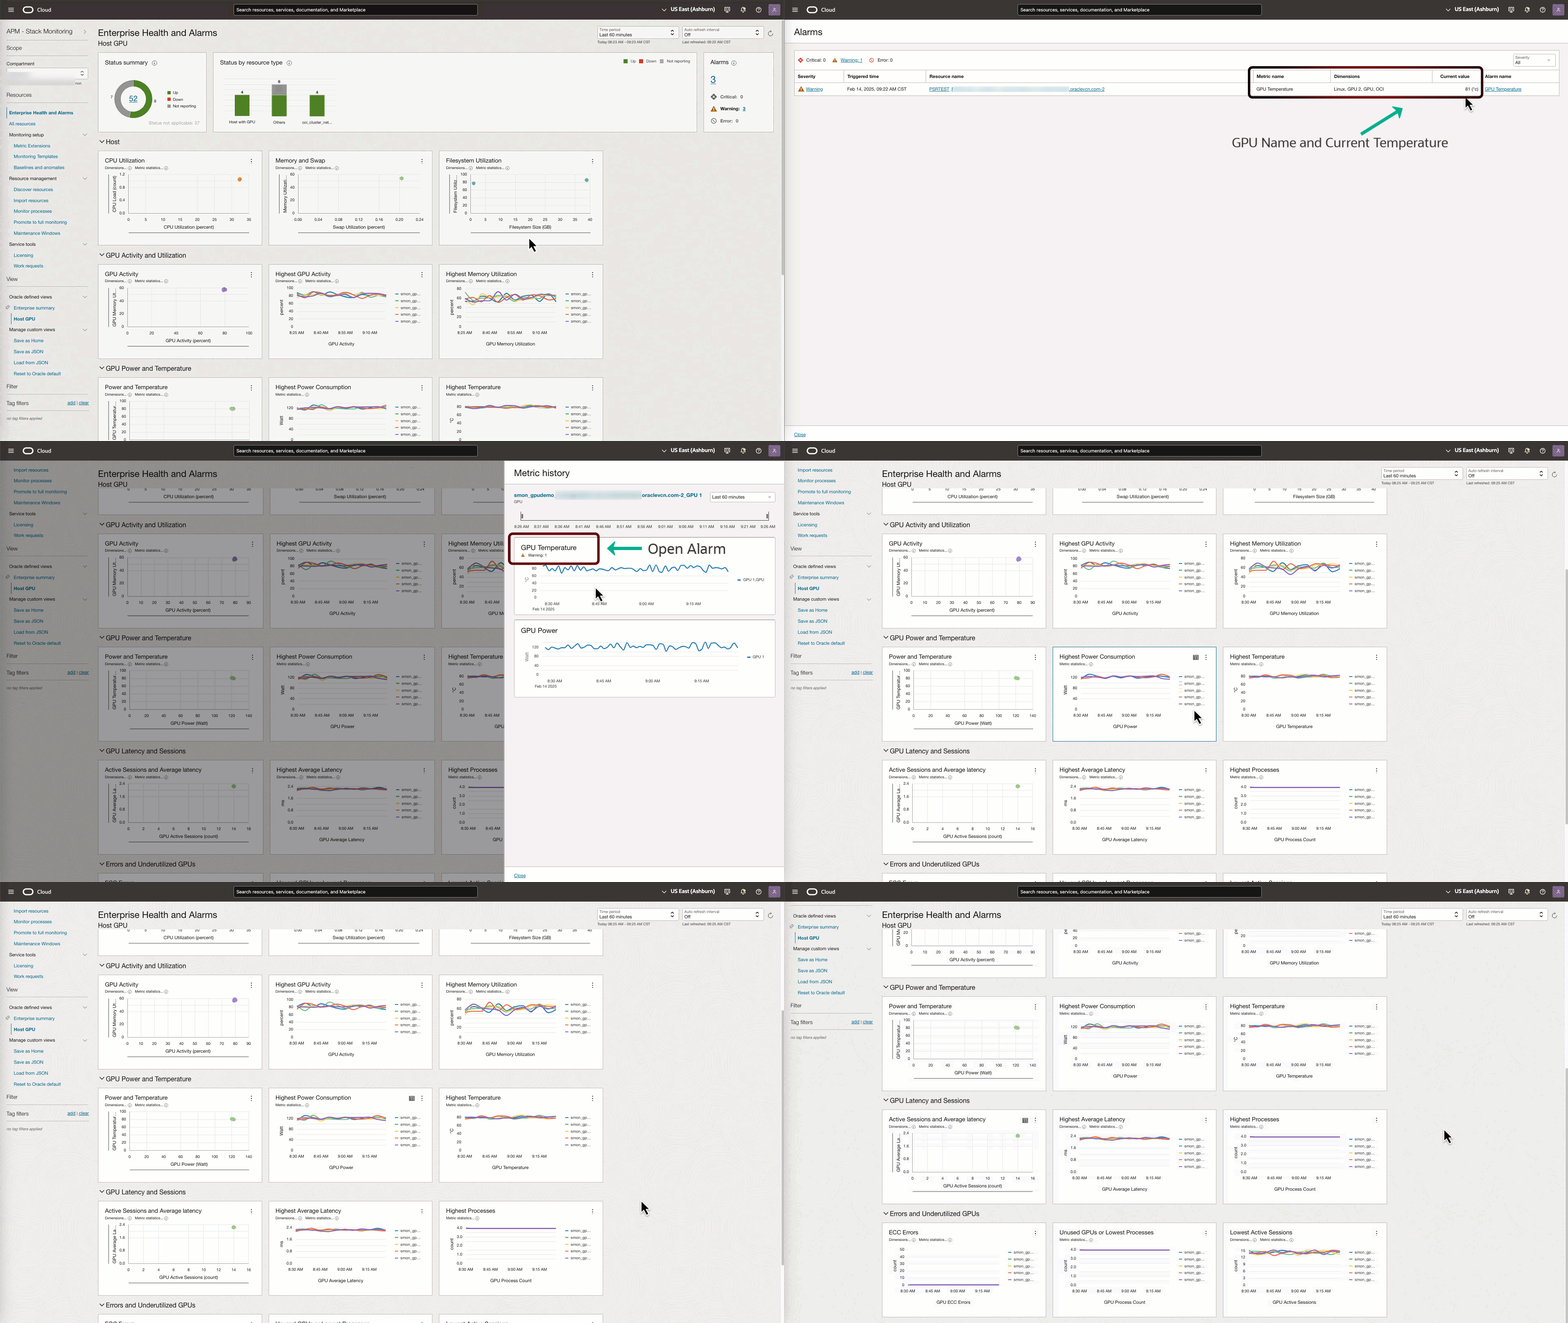
The Enterprise Health and Alarms for Host GPU provides visibility into your GPU infrastructure health with an interactive monitoring UI.
Designed for monitoring by exception, quickly assess the availability of hosts and open alarms:
- Identify at-a-glance the percentage of hosts that are up, and drill-down to hosts that are down or not reporting.
- Understand if all hosts within a Cluster Network are available and drill-down to investigate any outages.
- Triage any open alarm across your GPU infrastructure with drill-down into alarm details. The most current metric values are shown to help prioritize triage (e.g., GPU alarm shows GPU current temperature of 81°C).
When monitoring a GPU fleet focus on four key performance categories: response, load, error, and utilization. The Enterprise Health and Alarms UI is specially Curated to focus on these four categories and help correlate performance hotspots across the fleet:
- Determine the GPUs with the highest average latency resulting in slower jobs.
- Pinpoint underutilized GPUs that could be added to more demanding jobs.
- Identify the GPUs with the highest count of ECC errors.
- Correlate high GPU temperature and power usage across the fleet to help identify possible workload slowdowns.
In the performance charts, each plot point represents a unique resource (e.g., host, GPU, etc.). Clicking plot point provides drilldown to view performance over time. Metric charts provide details to open alarms on the current metric stream and navigation to resource’s homepage for further investigation.

Cluster Network home page summarizes host and GPU health and activity
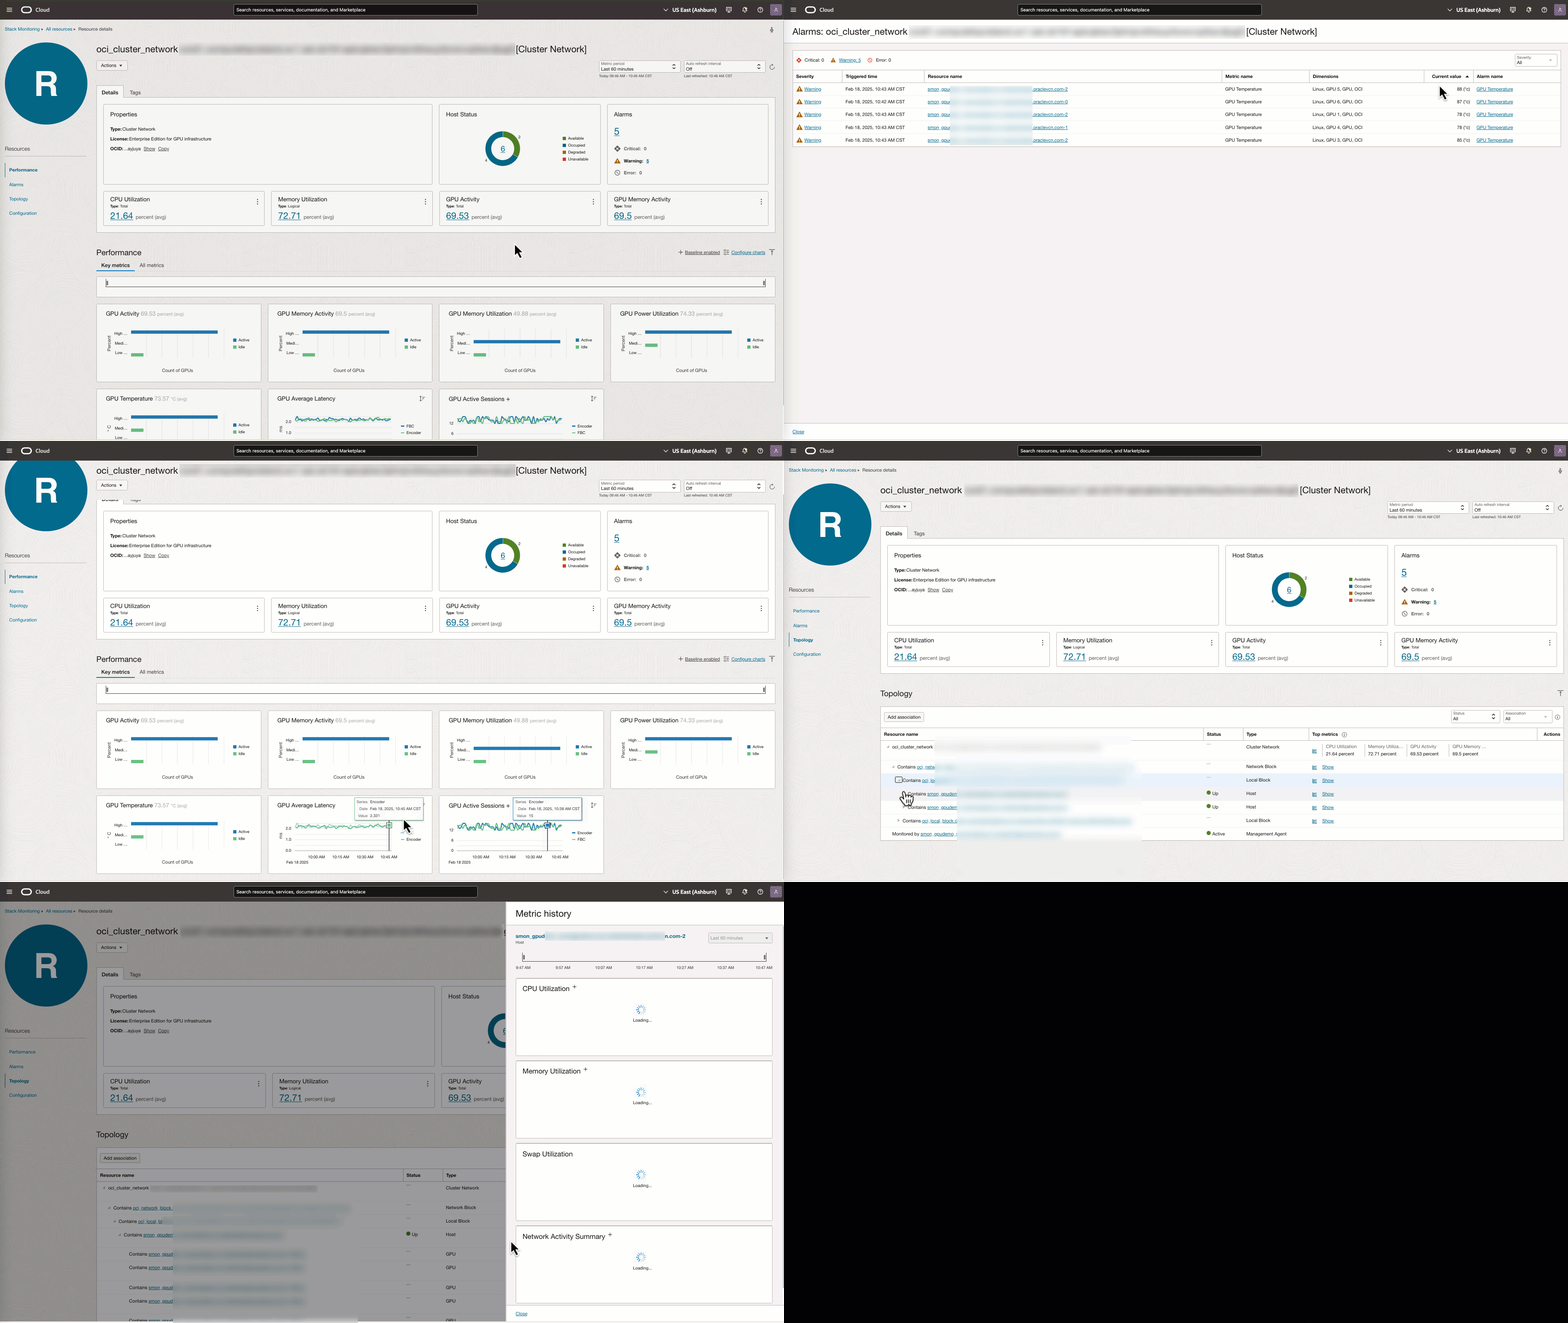
From the Enterprise Health and Alarms for Host GPU view, drilldown to the Cluster Network home page to assess compute (host) and GPU health and activity across the cluster.
The Cluster Network home page is designed for quick identification of compute health and open alarms across your entire cluster of GPU accelerated hosts.
- Determine the number of hosts that are available, unavailable, occupied, and degraded.
- Investigate any open alarm across your cluster with drill-down into alarm details.
Performance charts automatically categorize GPU performance and utilization into high, medium, and low. This categorization allows for quick analysis of all GPUs across the Cluster Network.
- Identify how many GPUs are not active.
- Determine the number of hosts that are using a high amount of memory and power.
- Single out any GPUs with high temperatures that could impact workloads.
- Review the average latency across the cluster.
Using the cluster’s Topology page, at-a-glance review detailed performance metrics for the entire Cluster Network and easily navigate throughout the cluster including Cluster Network, Network Block, Local Block, Hosts, and GPUs.

Compute home pages provide health and performance for GPU-accelerated computes
From the Cluster Network topology page, navigate to any host or GPU in the cluster to get to its home page. Host home page provides visibility into the health and performance of the host and its GPUs. A GPU accelerated compute homepage is enhanced to include GPU specific metrics (e.g. GPU active sessions, GPU ECC Errors). Stack Monitoring enables baselines with anomaly detection on several host and GPU metrics out-of-the-box.
Anomaly detection provides visual identification that the current performance is outside of the expected range. Additional baselines can be enabled on RDMA metrics such as RDMA transmit bytes to help determine if the amount of data being transferred has dropped unexpectedly while the job is still executing.
The GPU Performance tab summarizes GPU performance across all GPUs including activity, active session, memory usage, fan utilization, average latency, temperature, ECC errors, etc. The performance charts will highlight any open alarms related to these charts. This provides an at-a-glance view of overall health and helps performance correlation to triage common problems with drill-down to individual GPU home pages for further triage.
- Identify GPUs with high latency.
- Evaluate if any GPUs temperatures are nearing thermal throttling.
- Determine if the current GPU memory consumption is anomalous.
- Pinpoint a reduction in GPU clock utilization.

Workload Monitoring with Process Sets
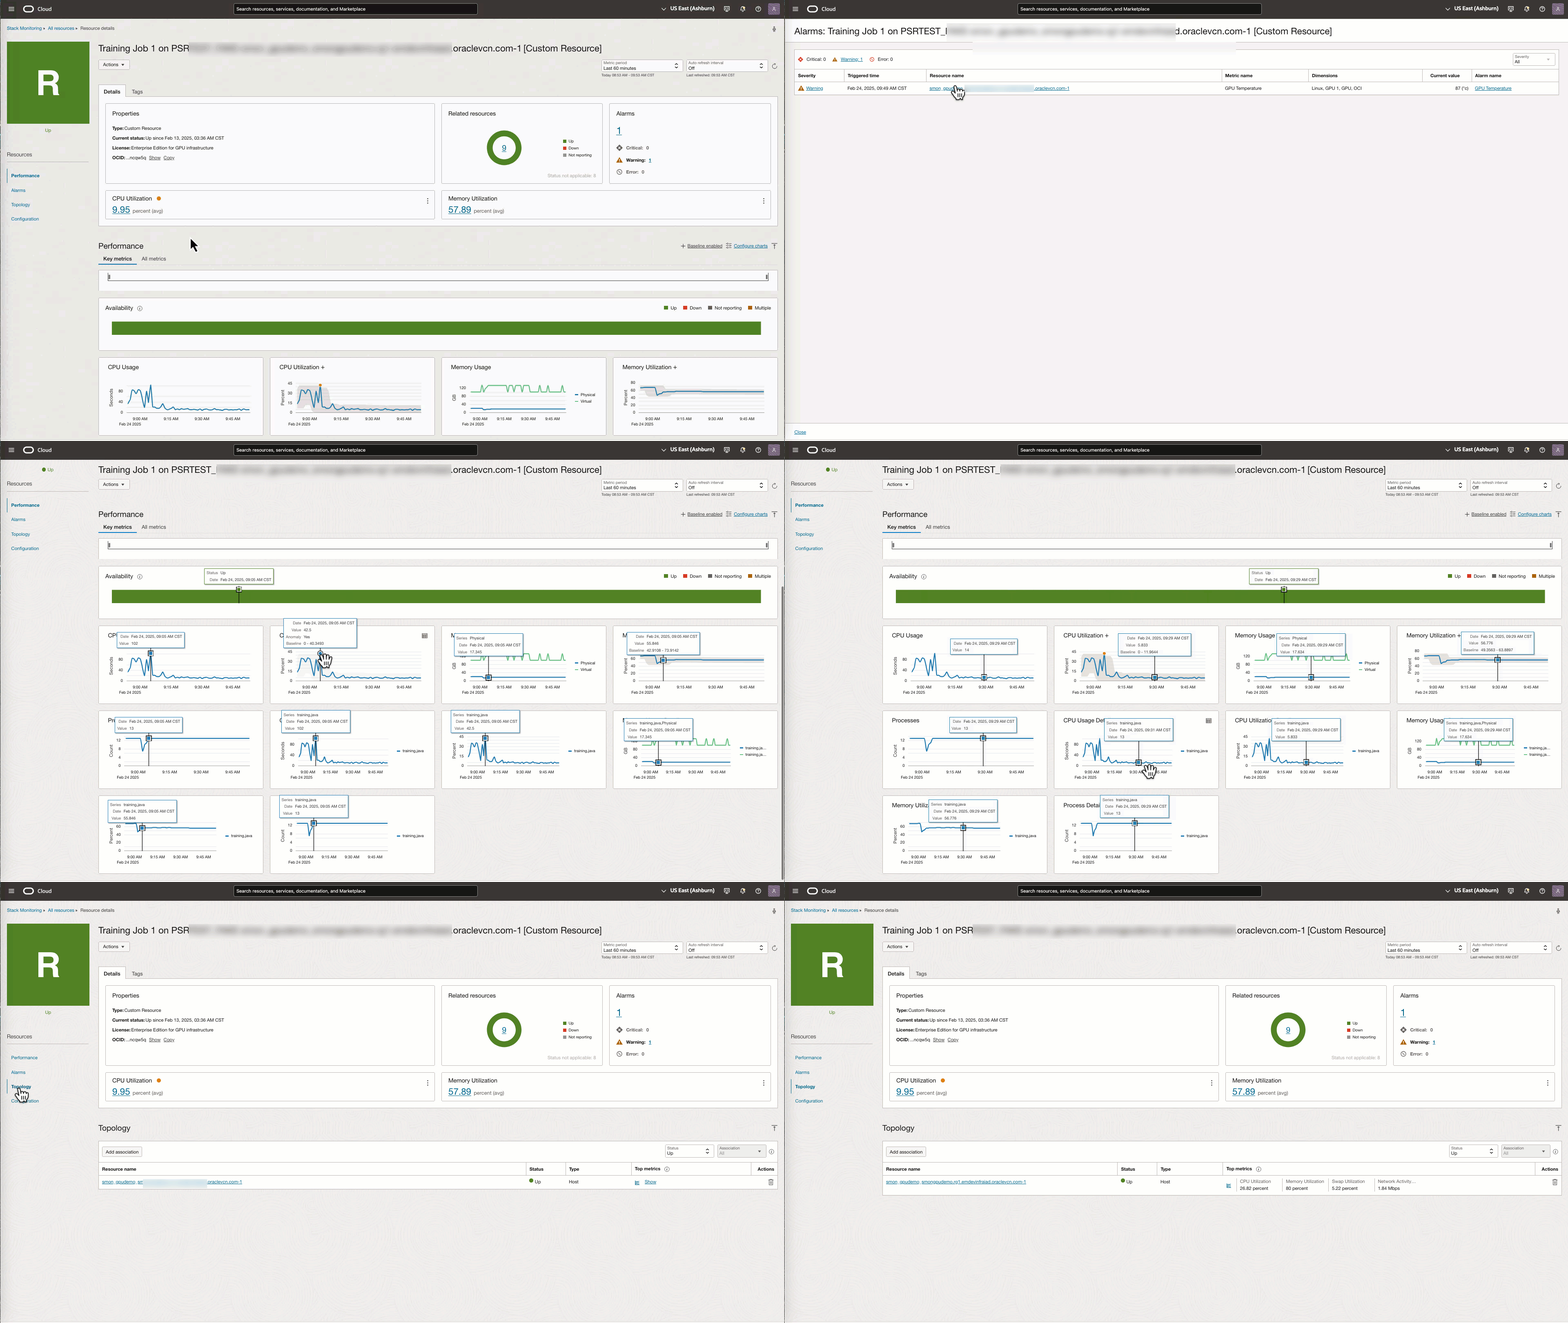
Monitoring of a GPU workload can be achieved using Process Sets. Process Sets are created by defining the unique processes that make up the GPU workload. Once created, Stack Monitoring will monitor the status, CPU, and memory utilization as well as the number of processes running on the host. Alarms can be created for these metrics such as number of processes to ensure the workload has enough processes to complete the workload. The Topology tab identifies the hosts where the workload is running.

Manage your GPU alarms at scale using Monitoring Templates
Creating individual alarms across your entire GPU-accelerated fleet can be time-consuming and error-prone. Monitoring Templates simplify this process by providing a single UI where you can create all the alarm rules for an entire GPU-accelerated fleet. This single template includes all the information required to create alarm rules on your hosts and GPUs and can be applied to the entire fleet in just a few clicks. When expanding your fleet, (e.g., adding hosts, GPUs, etc.), the newly added hosts and GPUs will automatically be applied with the Monitoring Templates alarm conditions. Changing any alarm threshold can also be done in the template, and such changes will be applied to all hosts. These templates save time in managing alarm conditions and ensure consistency across large-scale environments.
Gain visibility and alarm management of your GPU infrastructure and workloads with OCI Stack Monitoring.
