We’re excited to introduce the availability of Oracle Cloud Infrastructure (OCI) Database Management and Ops Insights services to monitor the on-premises (External) MySQL DB systems!
Today, efficient database management is essential to deliver highly performant, reliable, and scalable applications. Database Management in OCI offers a cloud-native, comprehensive database monitoring solution which brings the capabilities of MySQL Enterprise Monitor (MEM) and Enterprise Manager to the cloud. Through advanced diagnostics and performance management tools provided in the service, you can quickly identify and resolve resource bottlenecks, troubleshoot SQL performance issues, and ensure your database systems are performing optimally. From detailed CPU, memory, and storage utilization to granular SQL performance metrics, administrators can detect and resolve issues before they can impact the application’s performance.
With simple onboarding steps, you can easily set up monitoring for your External MySQL DB systems, gaining real-time visibility into their status and performance within your tenancy. This powerful solution ensures you stay ahead of potential issues, supporting a reliable and responsive database environment. OCI Database Management and OCI Ops Insights services deliver advanced capabilities to simplify the monitoring of External MySQL databases, offer detailed granular insights, and reduce the burden of managing infrastructure resources. Additionally, as a cloud-native, managed solution, these services eliminate the need to maintain the monitoring solution itself.
Feature overview of the Database Management service
The Database Management service in OCI offers a unified user interface that simplifies the monitoring and management of MySQL DB systems. Key features include:
- Providing a seamless interface for managing and monitoring multiple External and HeatWave MySQL DB systems in OCI
- Tracking CPU, memory, storage utilization, and overall system health for all DB systems
- Setting alerts for specific MySQL DB systems to track performance thresholds with timely notifications
- Monitoring key performance and configuration metrics for External MySQL DB systems across your fleet
- Offering visibility into SQL statement latency, disk throughput, and database connections
- Identifying and resolving SQL performance issues quickly which helps pinpoint root issues across a fleet of MySQL DB system using Performance Hub
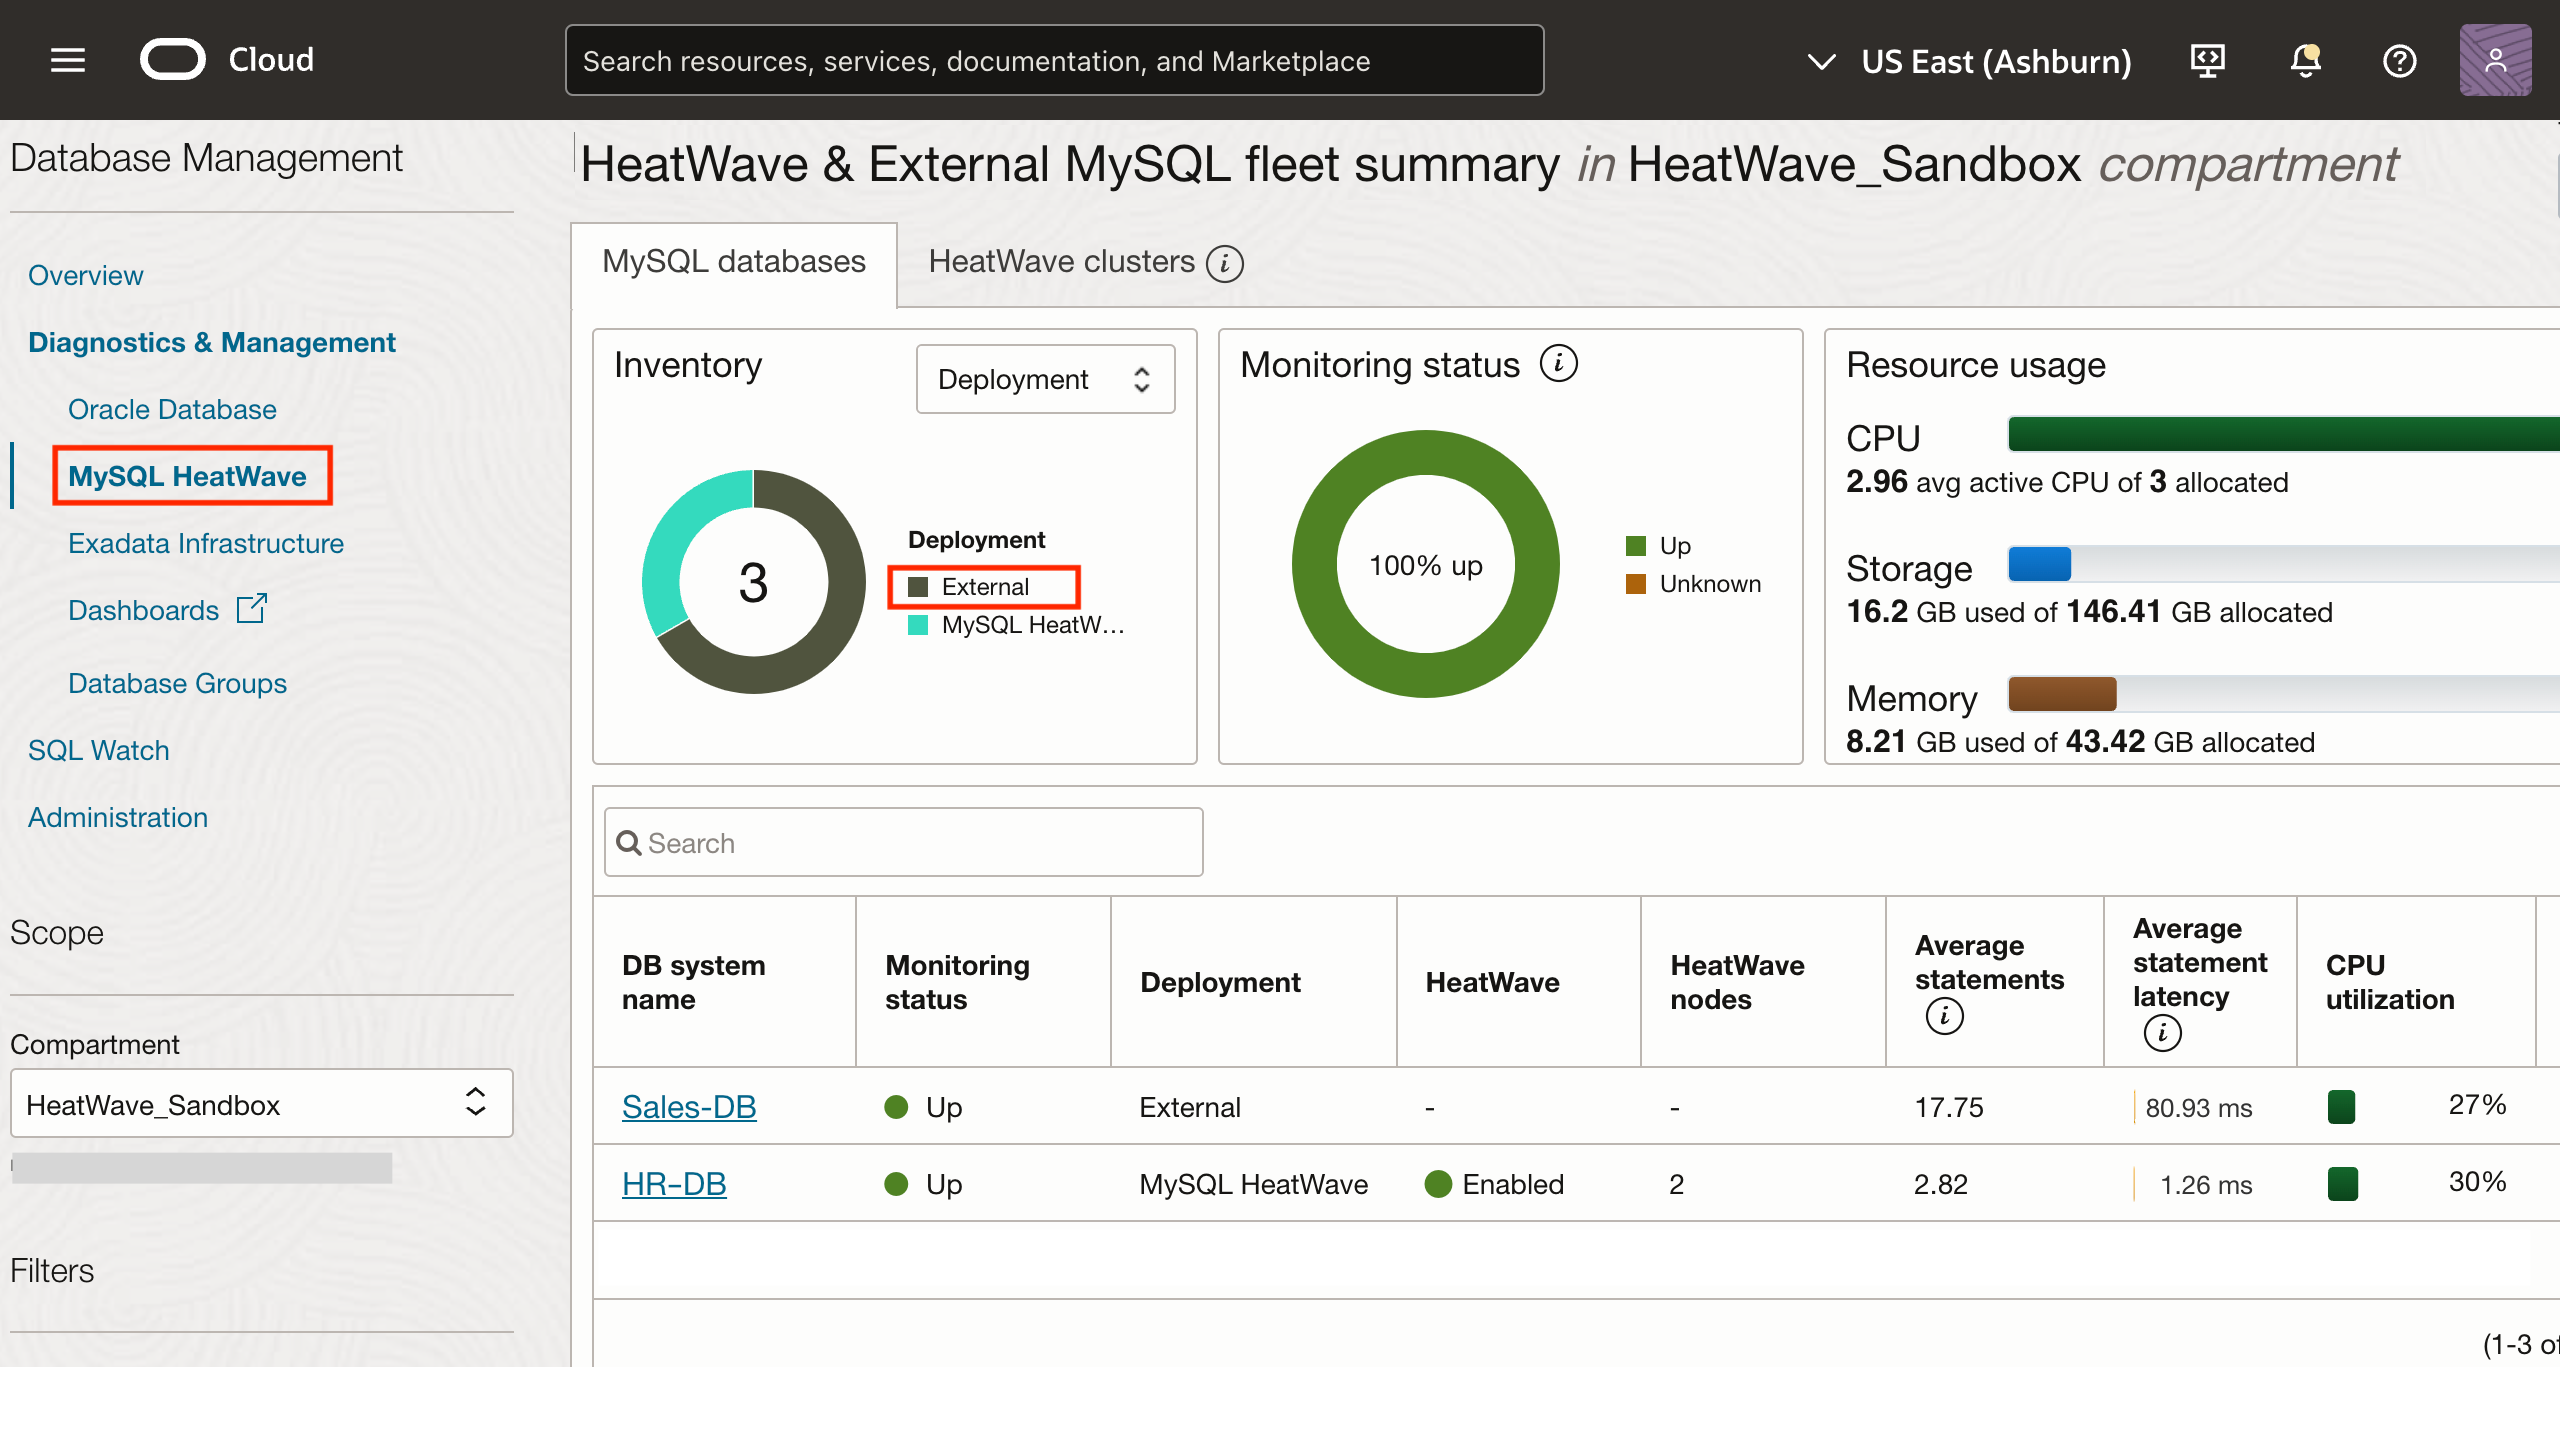
HeatWave & External MySQL DB system fleet monitoring in OCI
Database Management provides the following fleet monitoring capabilities for MySQL DB systems in OCI, including:
- Monitoring multiple External and HeatWave MySQL DB systems within a fleet on Oracle Cloud Infrastructure through a unified interface
- Displaying a visual overview of CPU, memory, and storage allocation and utilization across the entire fleet
- Categorizing alarms by severity, allowing prioritization of critical issues
- Listing all MySQL DB systems in the fleet, highlighting their monitoring status, deployment, top resource consumers (CPU, Storage, Memory) and average SQL statement latency to further drill down to a specific database, enabling easy tracking and management
Monitoring of a single MySQL External DB system
Drill down from the HeatWave & External MySQL fleet summary page by selecting a DB system with the External deployment type to monitor the following key metrics in the Summary section:
- Monitoring status of the MySQL DB system
- Resource Utilization (CPU, Memory, and Disk utilization)
- Database connections
- SQL statement latency
- Disk IO and Throughput
- Alarm Visibility
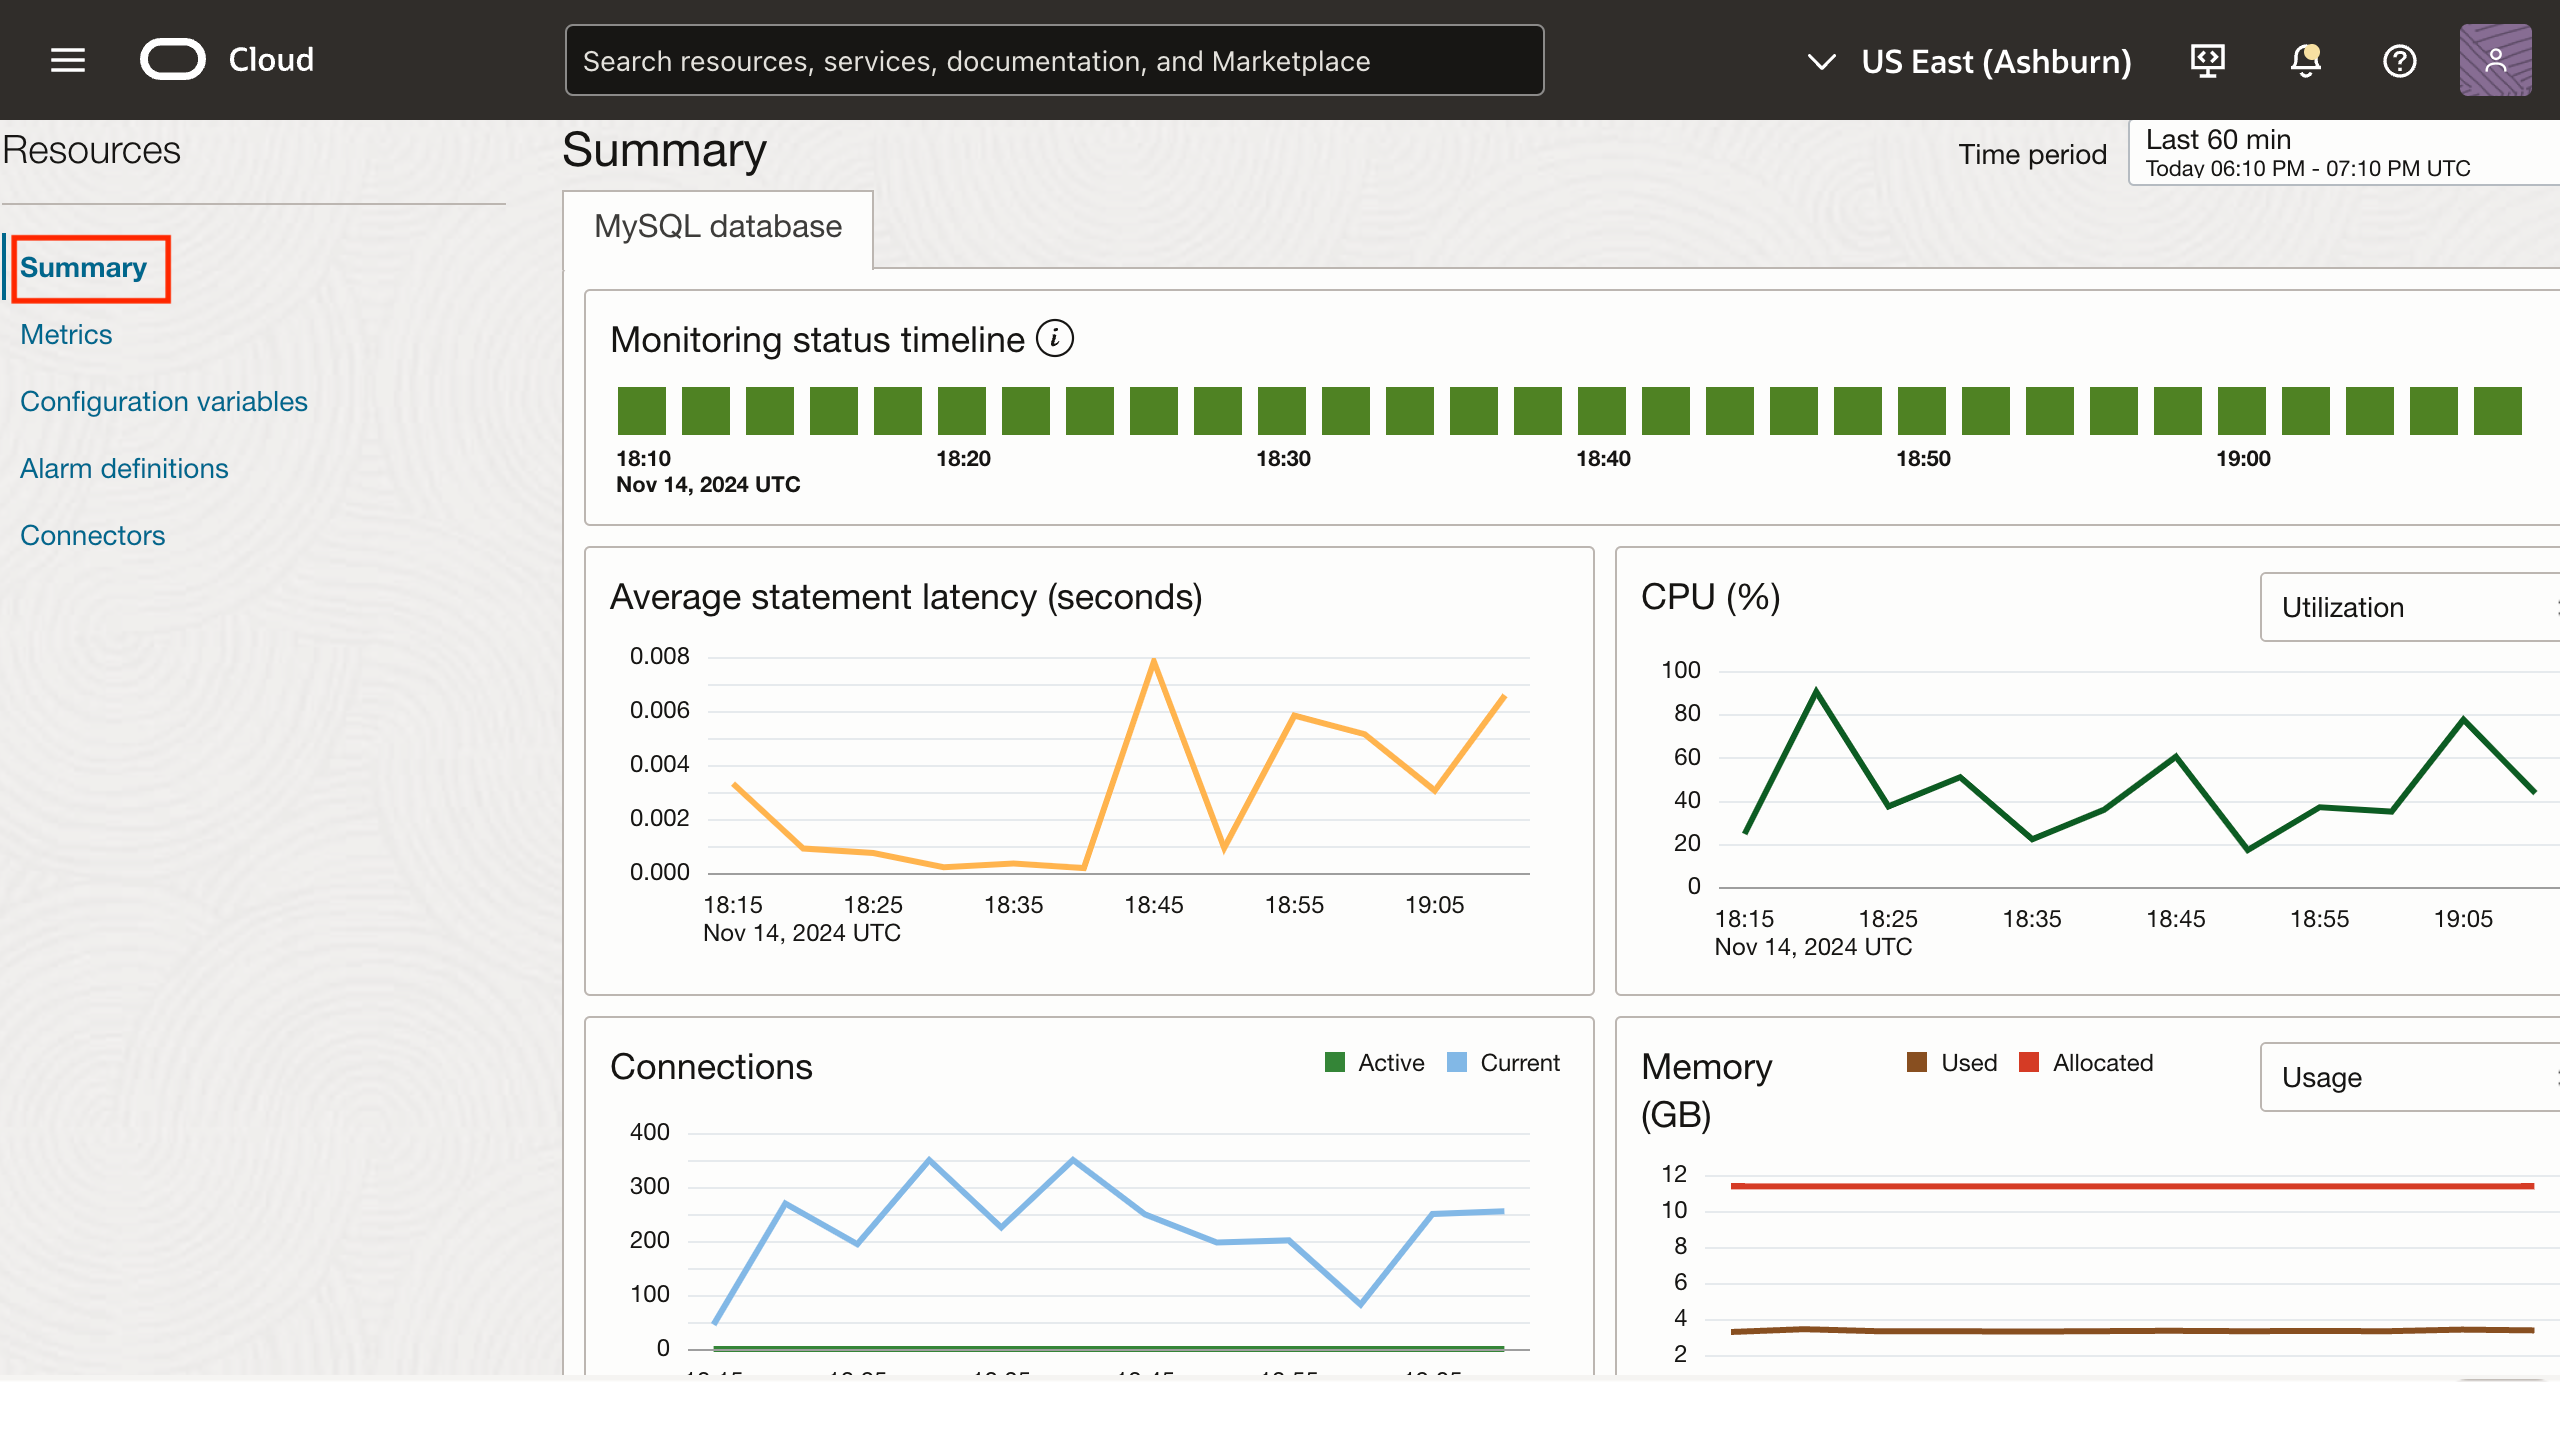
Gain access to a wide range of other metrics and current configuration variable settings for further optimization and fine-tuning of MySQL DB system performance by accessing Resources on the left pane of the menu.
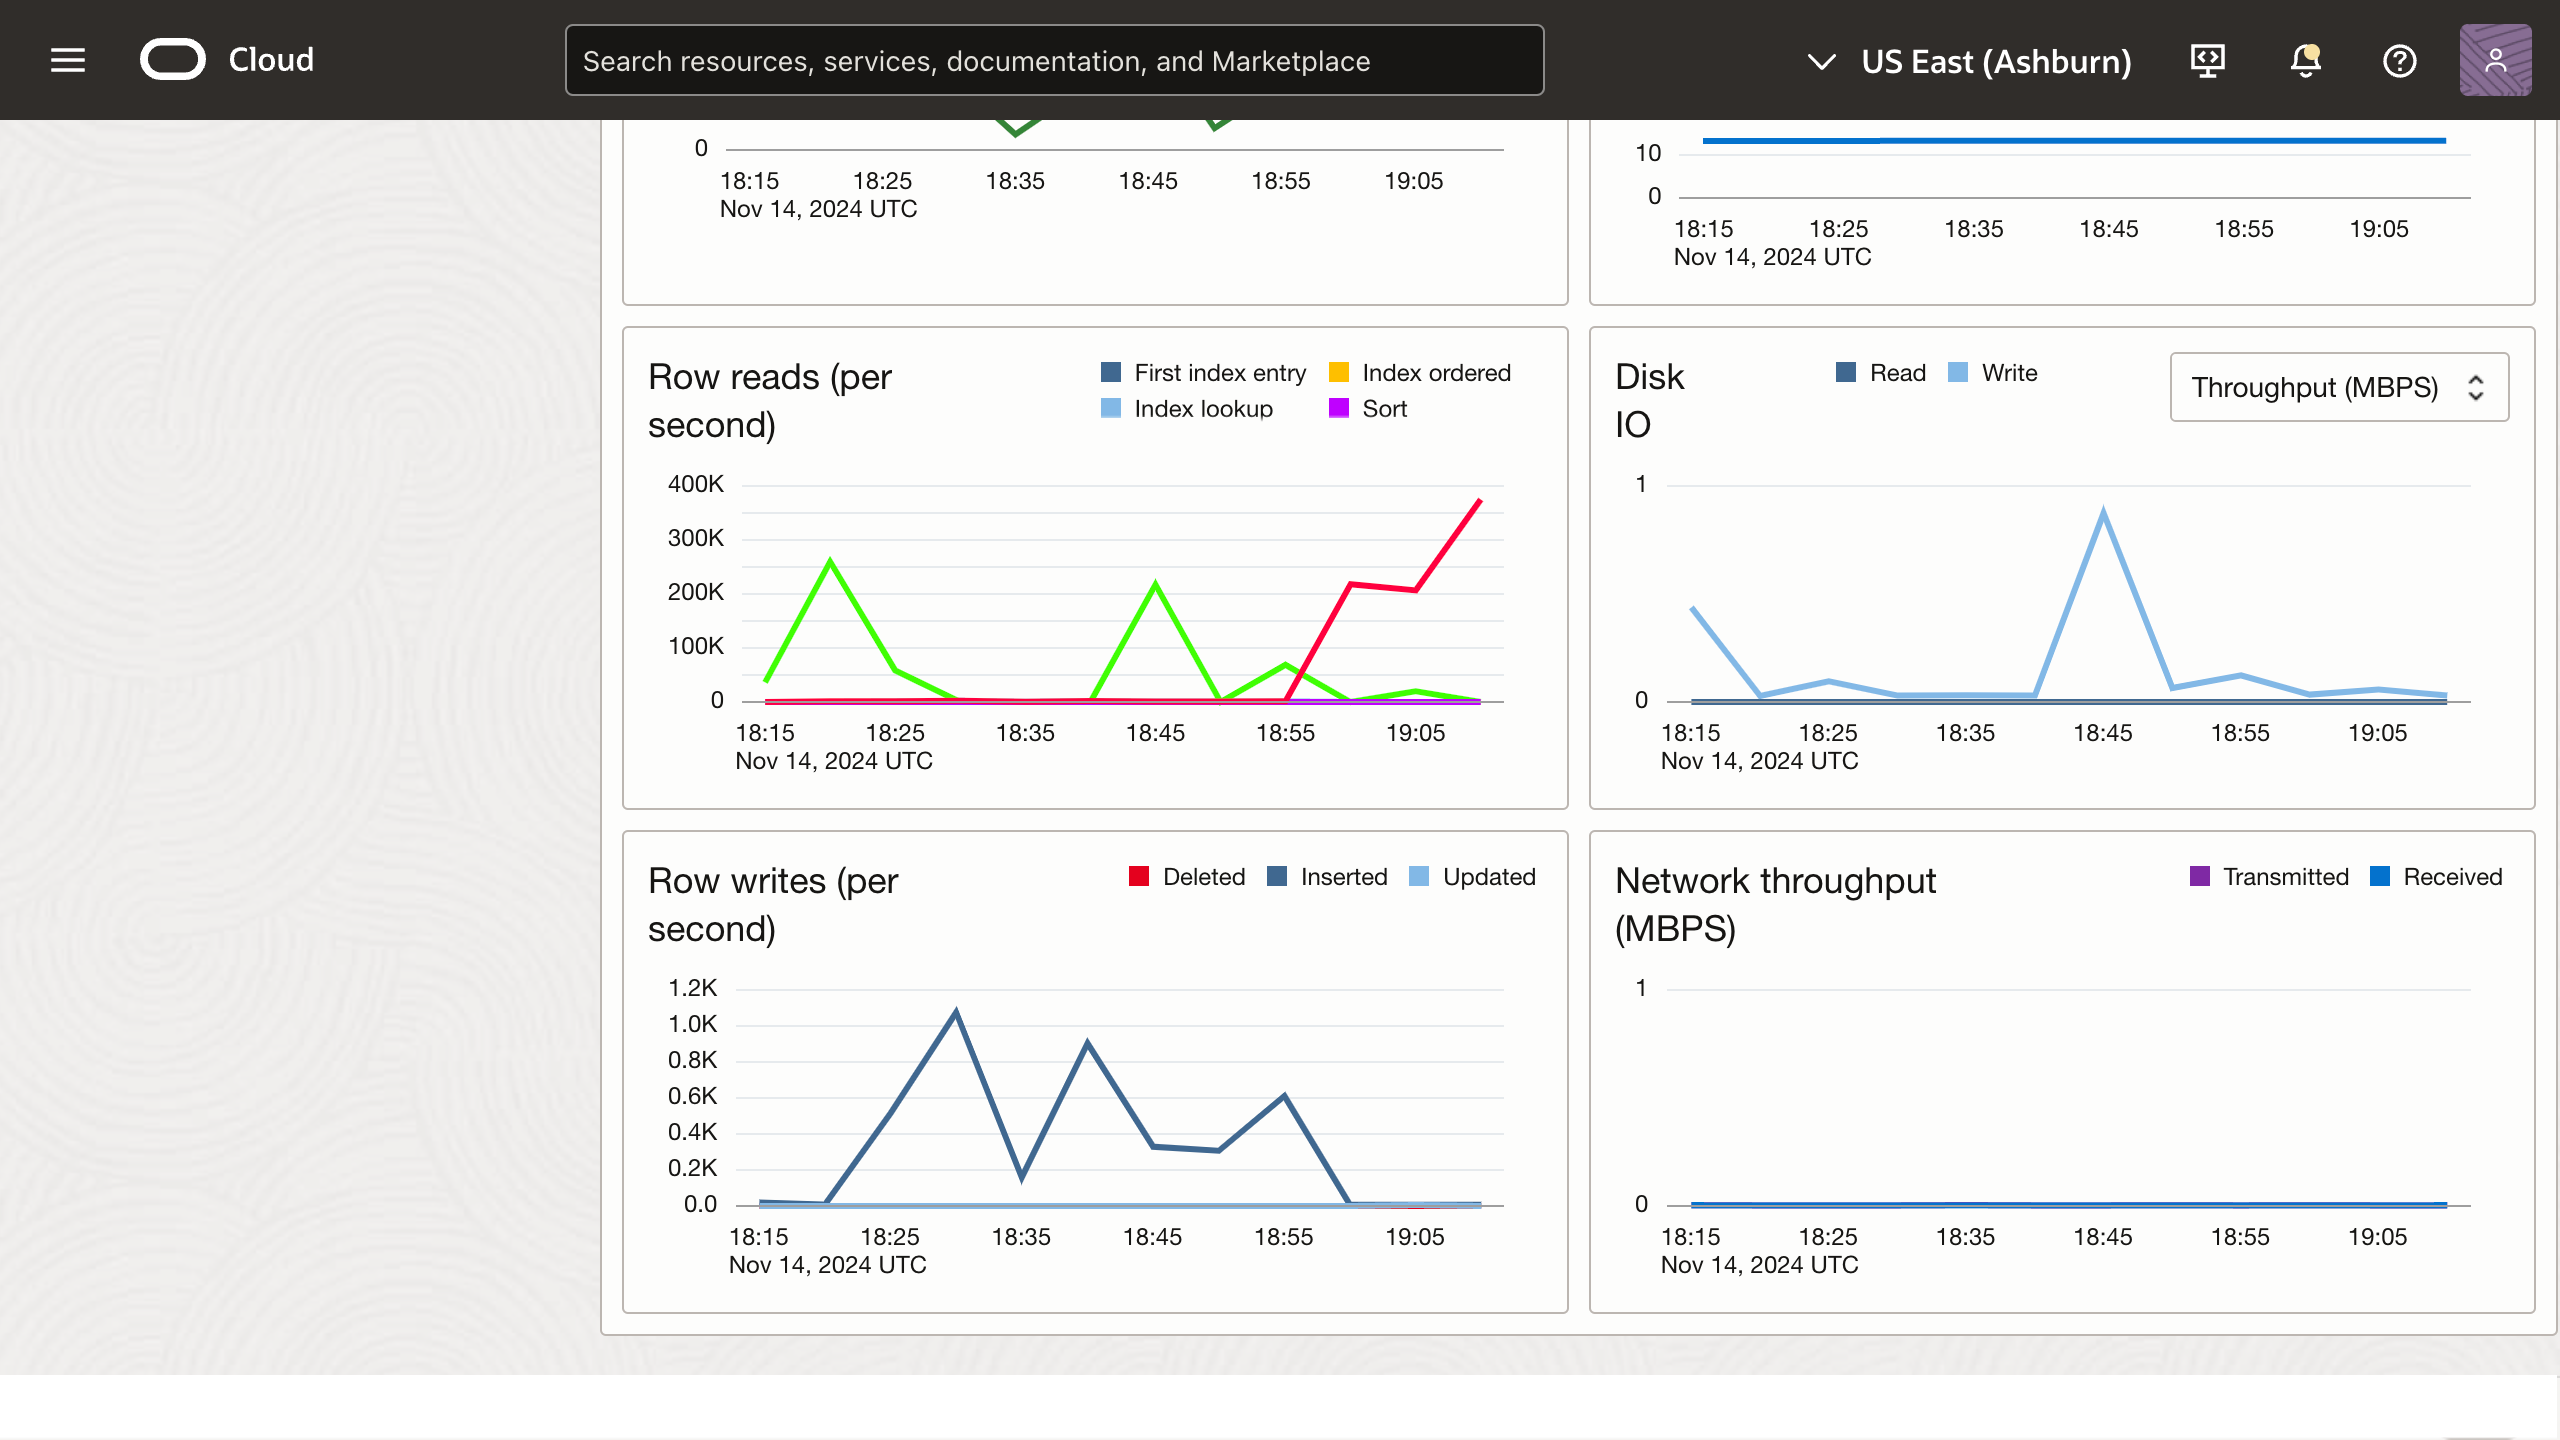
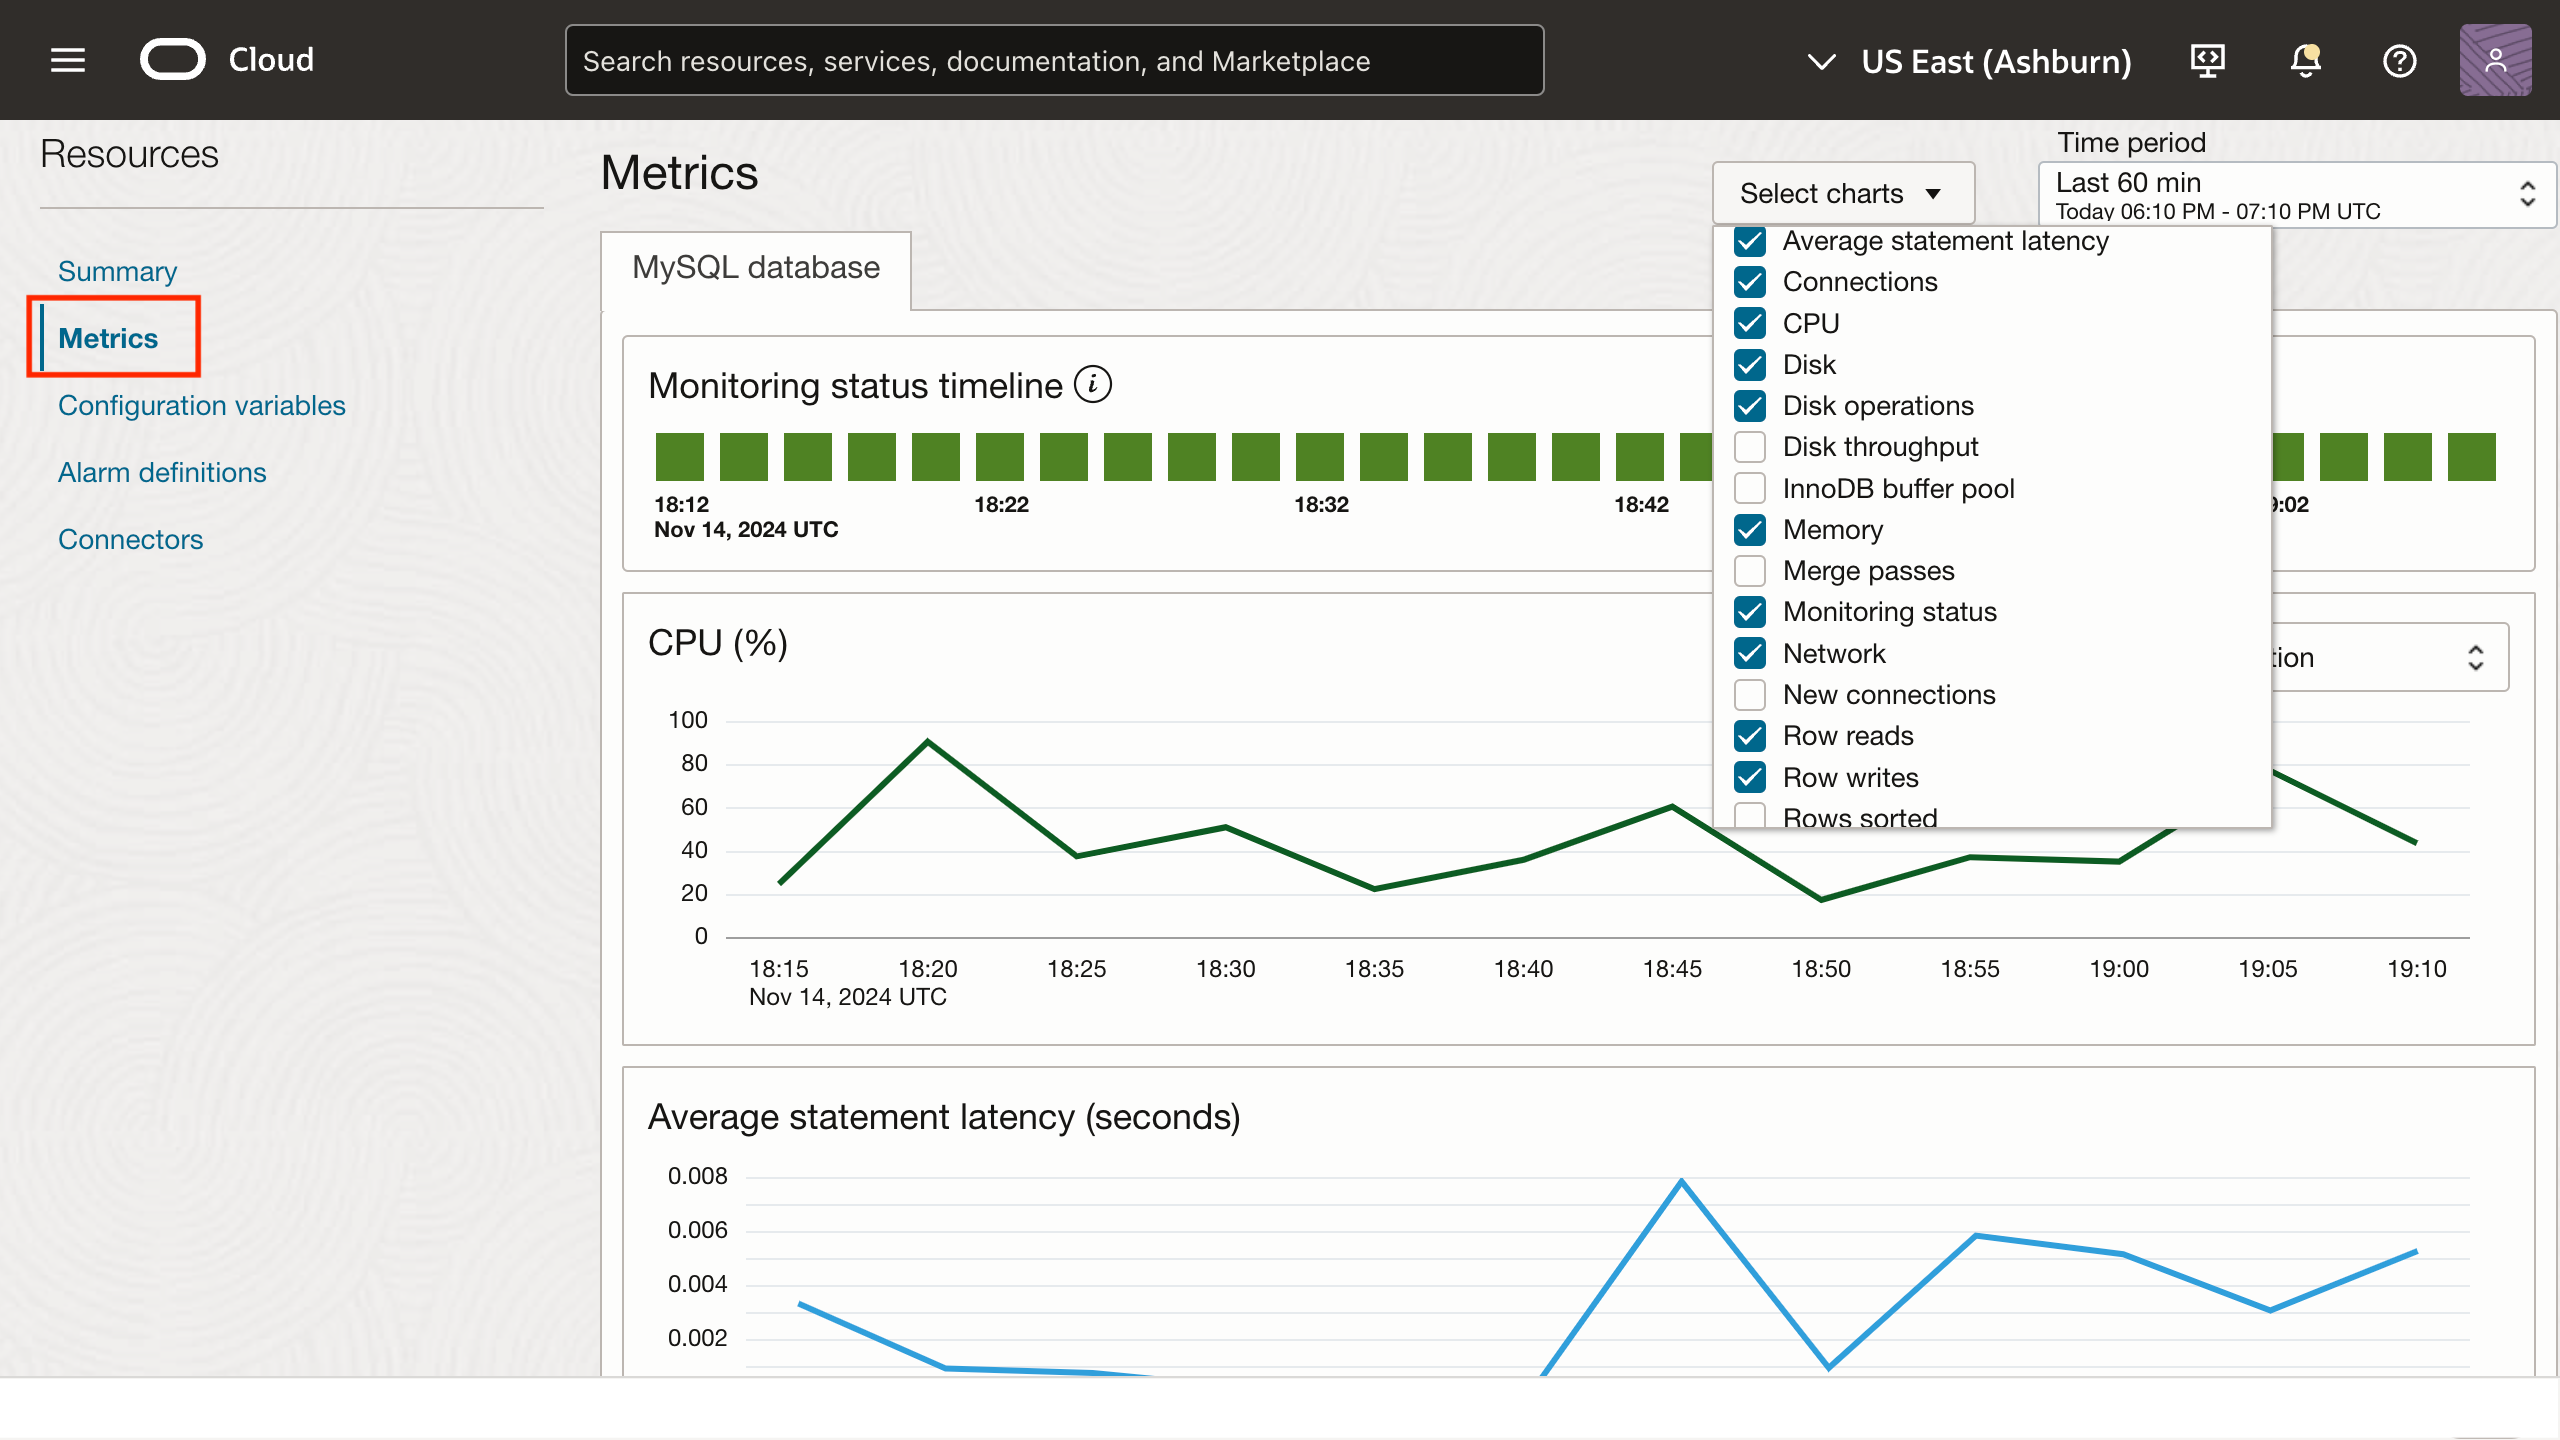
Metrics
In the Metrics section, a variety of essential MySQL DB system metrics can be accessed to help proactively identify and resolve performance issues. This section not only includes the charts from the Summary section but also offers additional metrics for a deeper analysis. Select different charts from the Select charts drop-down list to explore various indicators for a more detailed examination.
Monitoring MySQL Connections to Identify and Remediate Connection Issues
When a MySQL DB system experiences performance issues, one common area to investigate is the number of new connections. Monitoring the Connections metric in MySQL can reveal potential bottlenecks, resource exhaustion, or connection leaks, which could lead to slow queries, timeouts, or overall system instability.
Now, let’s analyze the issue of new connections and explore the necessary remediation steps to address it effectively.
Problem
High numbers of new connections may indicate that:
- Too many client applications are opening connections without closing them, causing a “connection leak.”
- An increase in application traffic or misconfiguration in the connection pool might be overwhelming the database.
- Insufficient connection pool limits could result in the MySQL server being unable to handle incoming requests efficiently.
Analysis
Connection Pooling Misconfiguration: If Max_used_connections is consistently high but within the limit, this may indicate suboptimal configuration of connection pooling in the application.
Remediation Steps
Increase max_connections: Temporarily raise the max_connections limit in the MySQL configuration if the server is being overwhelmed by a spike in traffic. However, this is might be a short-term solution and should be paired with other optimizations. - Optimize thread_cache_size: Adjusting the the thread_cache_size parameter may help in reducing the overhead of thread creation and thereby improve the connection pooling efficiency.
- Fix Connection Leaks: Identify and resolve application-level connection leaks where connections are not being closed after use. This can be done by auditing the application code to ensure proper connection closure or by utilizing tools like APM that track open connections in the application layer.
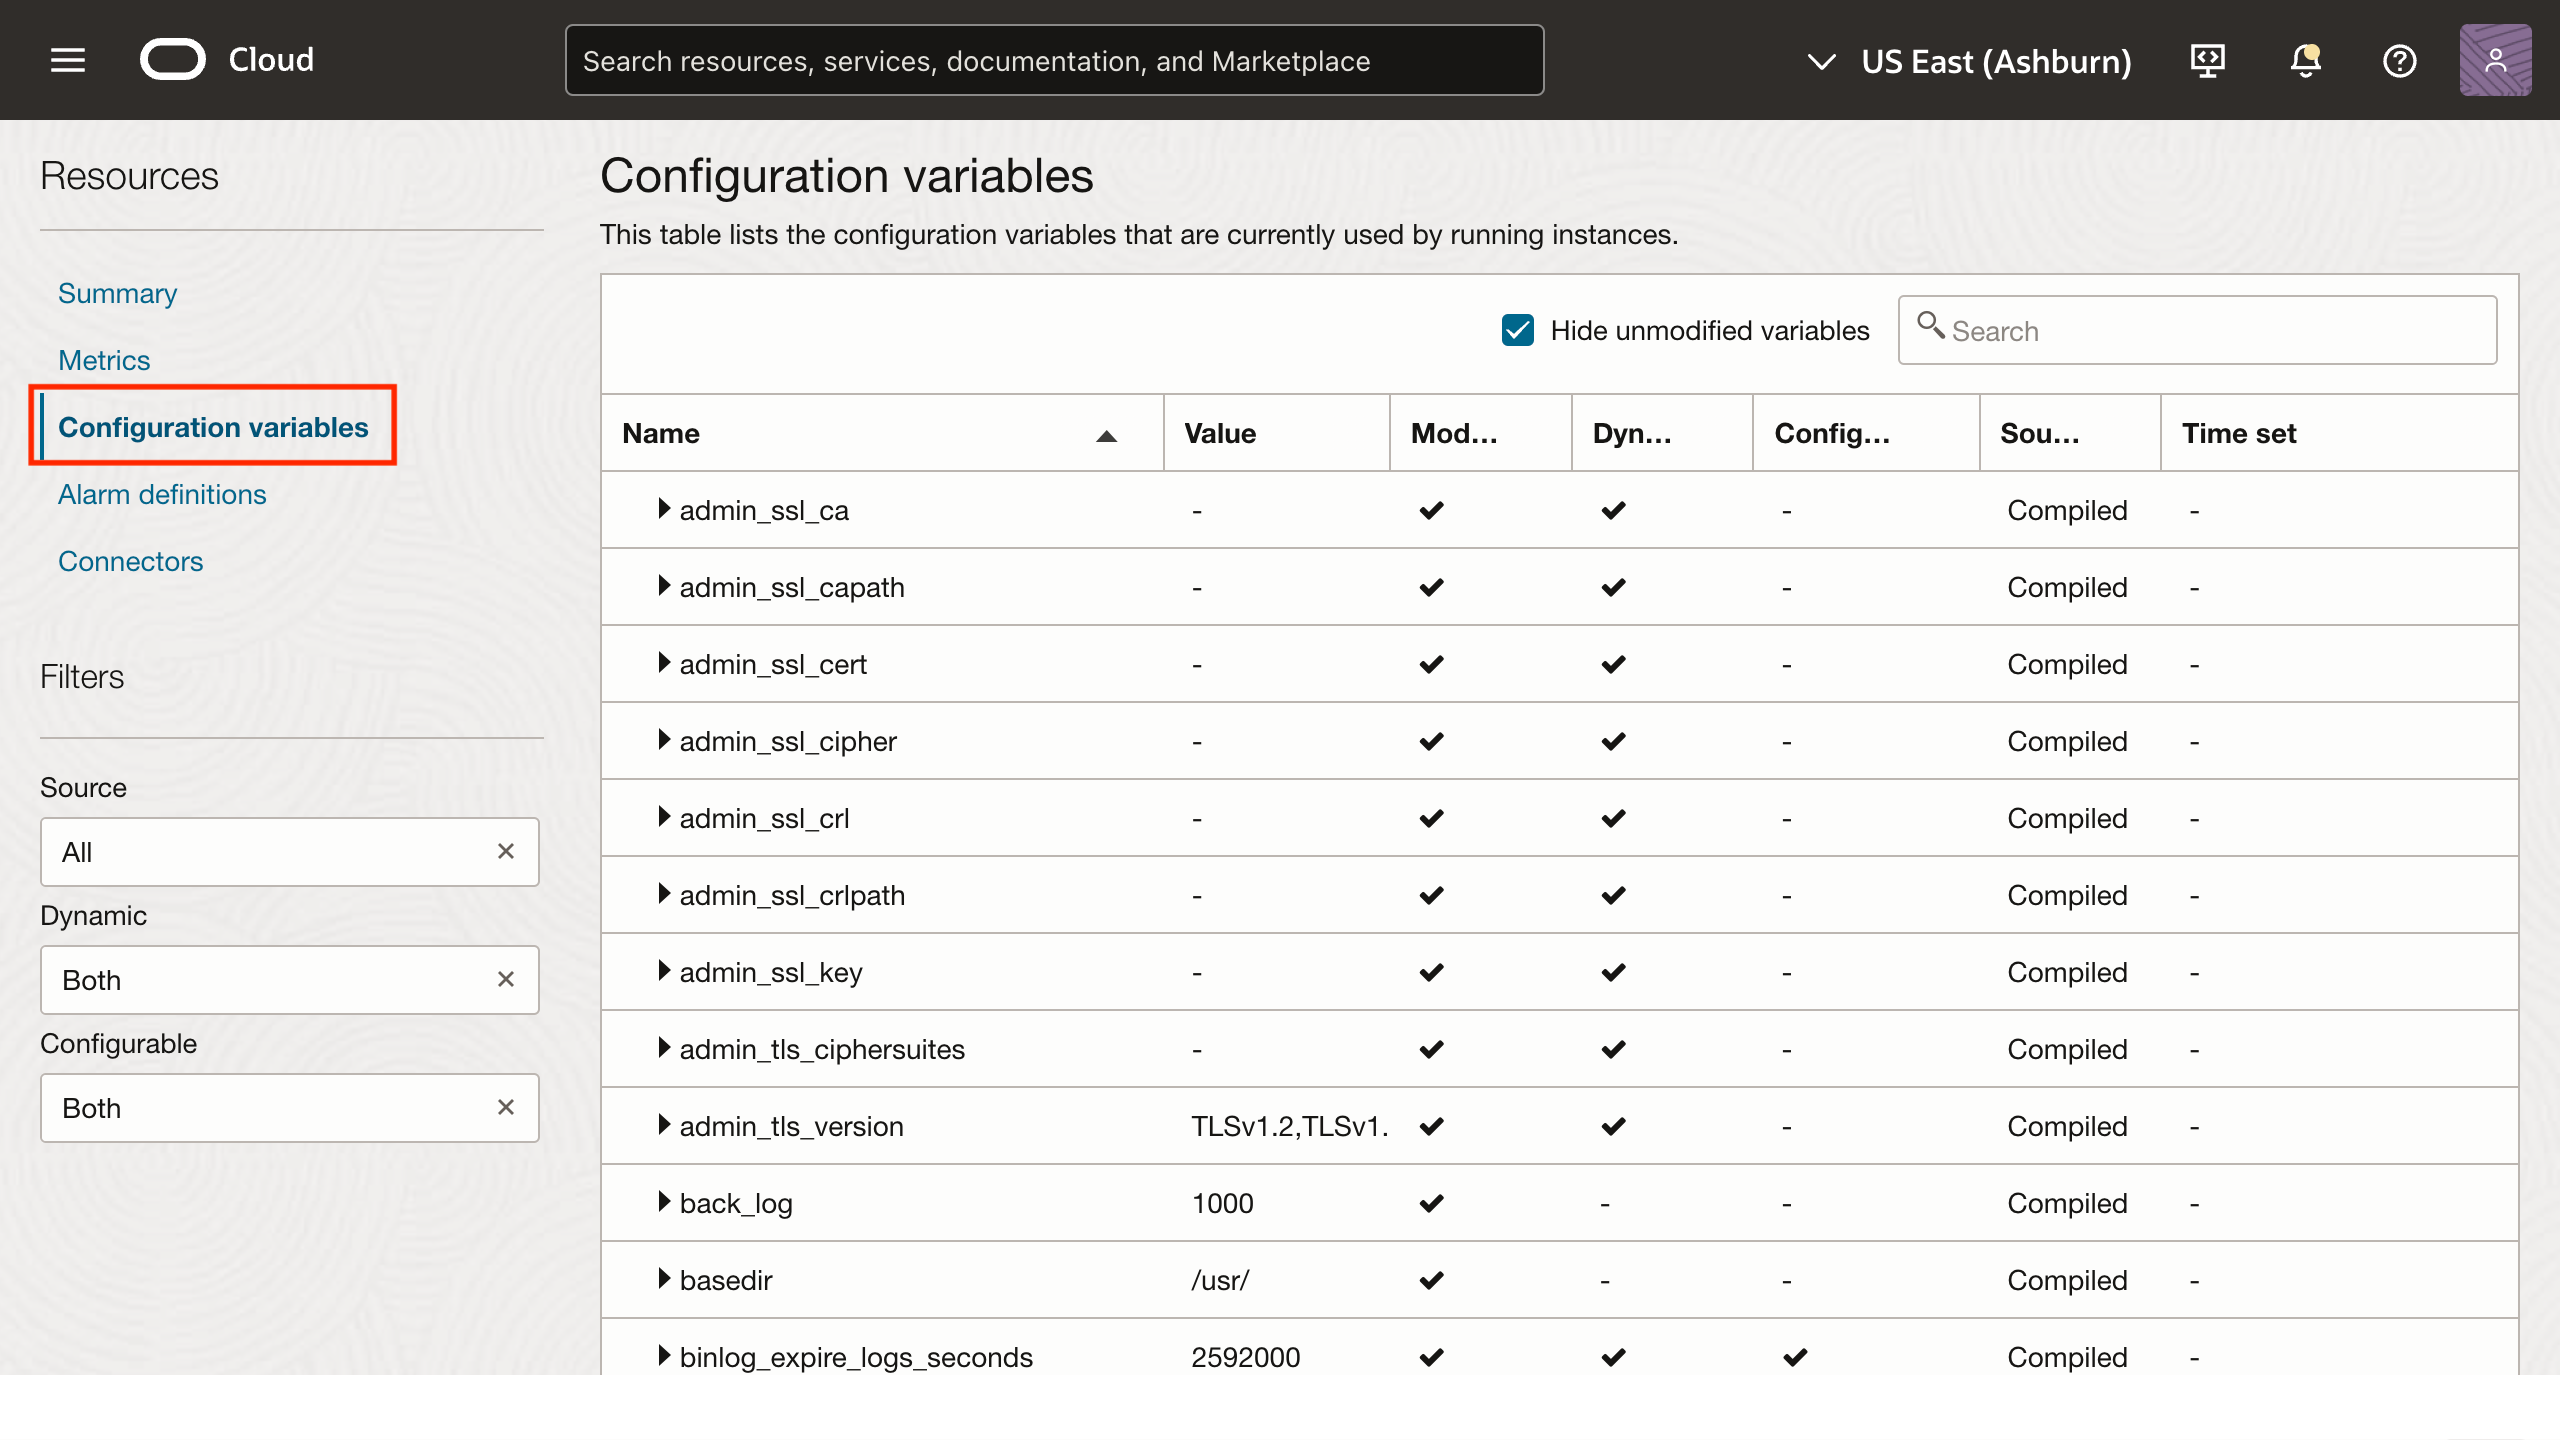
Monitoring Configuration variables of MySQL DB system
In the Configuration variables section, you can monitor and manage the configuration variables currently used by your MySQL DB system. These variables are the user, system, initialization, or service-specific variables that define the operation of a MySQL DB system.
Earlier in the Metrics section, we discussed the New Connections chart (Connections metric) and a possible solution for mitigating issues related to new connections. One such solution could be modifying system variables like max_connections and thread_cache_size.
The Configuration variables section allows you to view and edit these variables as needed. You can use the various filters on the left pane to quickly search for specific configuration variables.
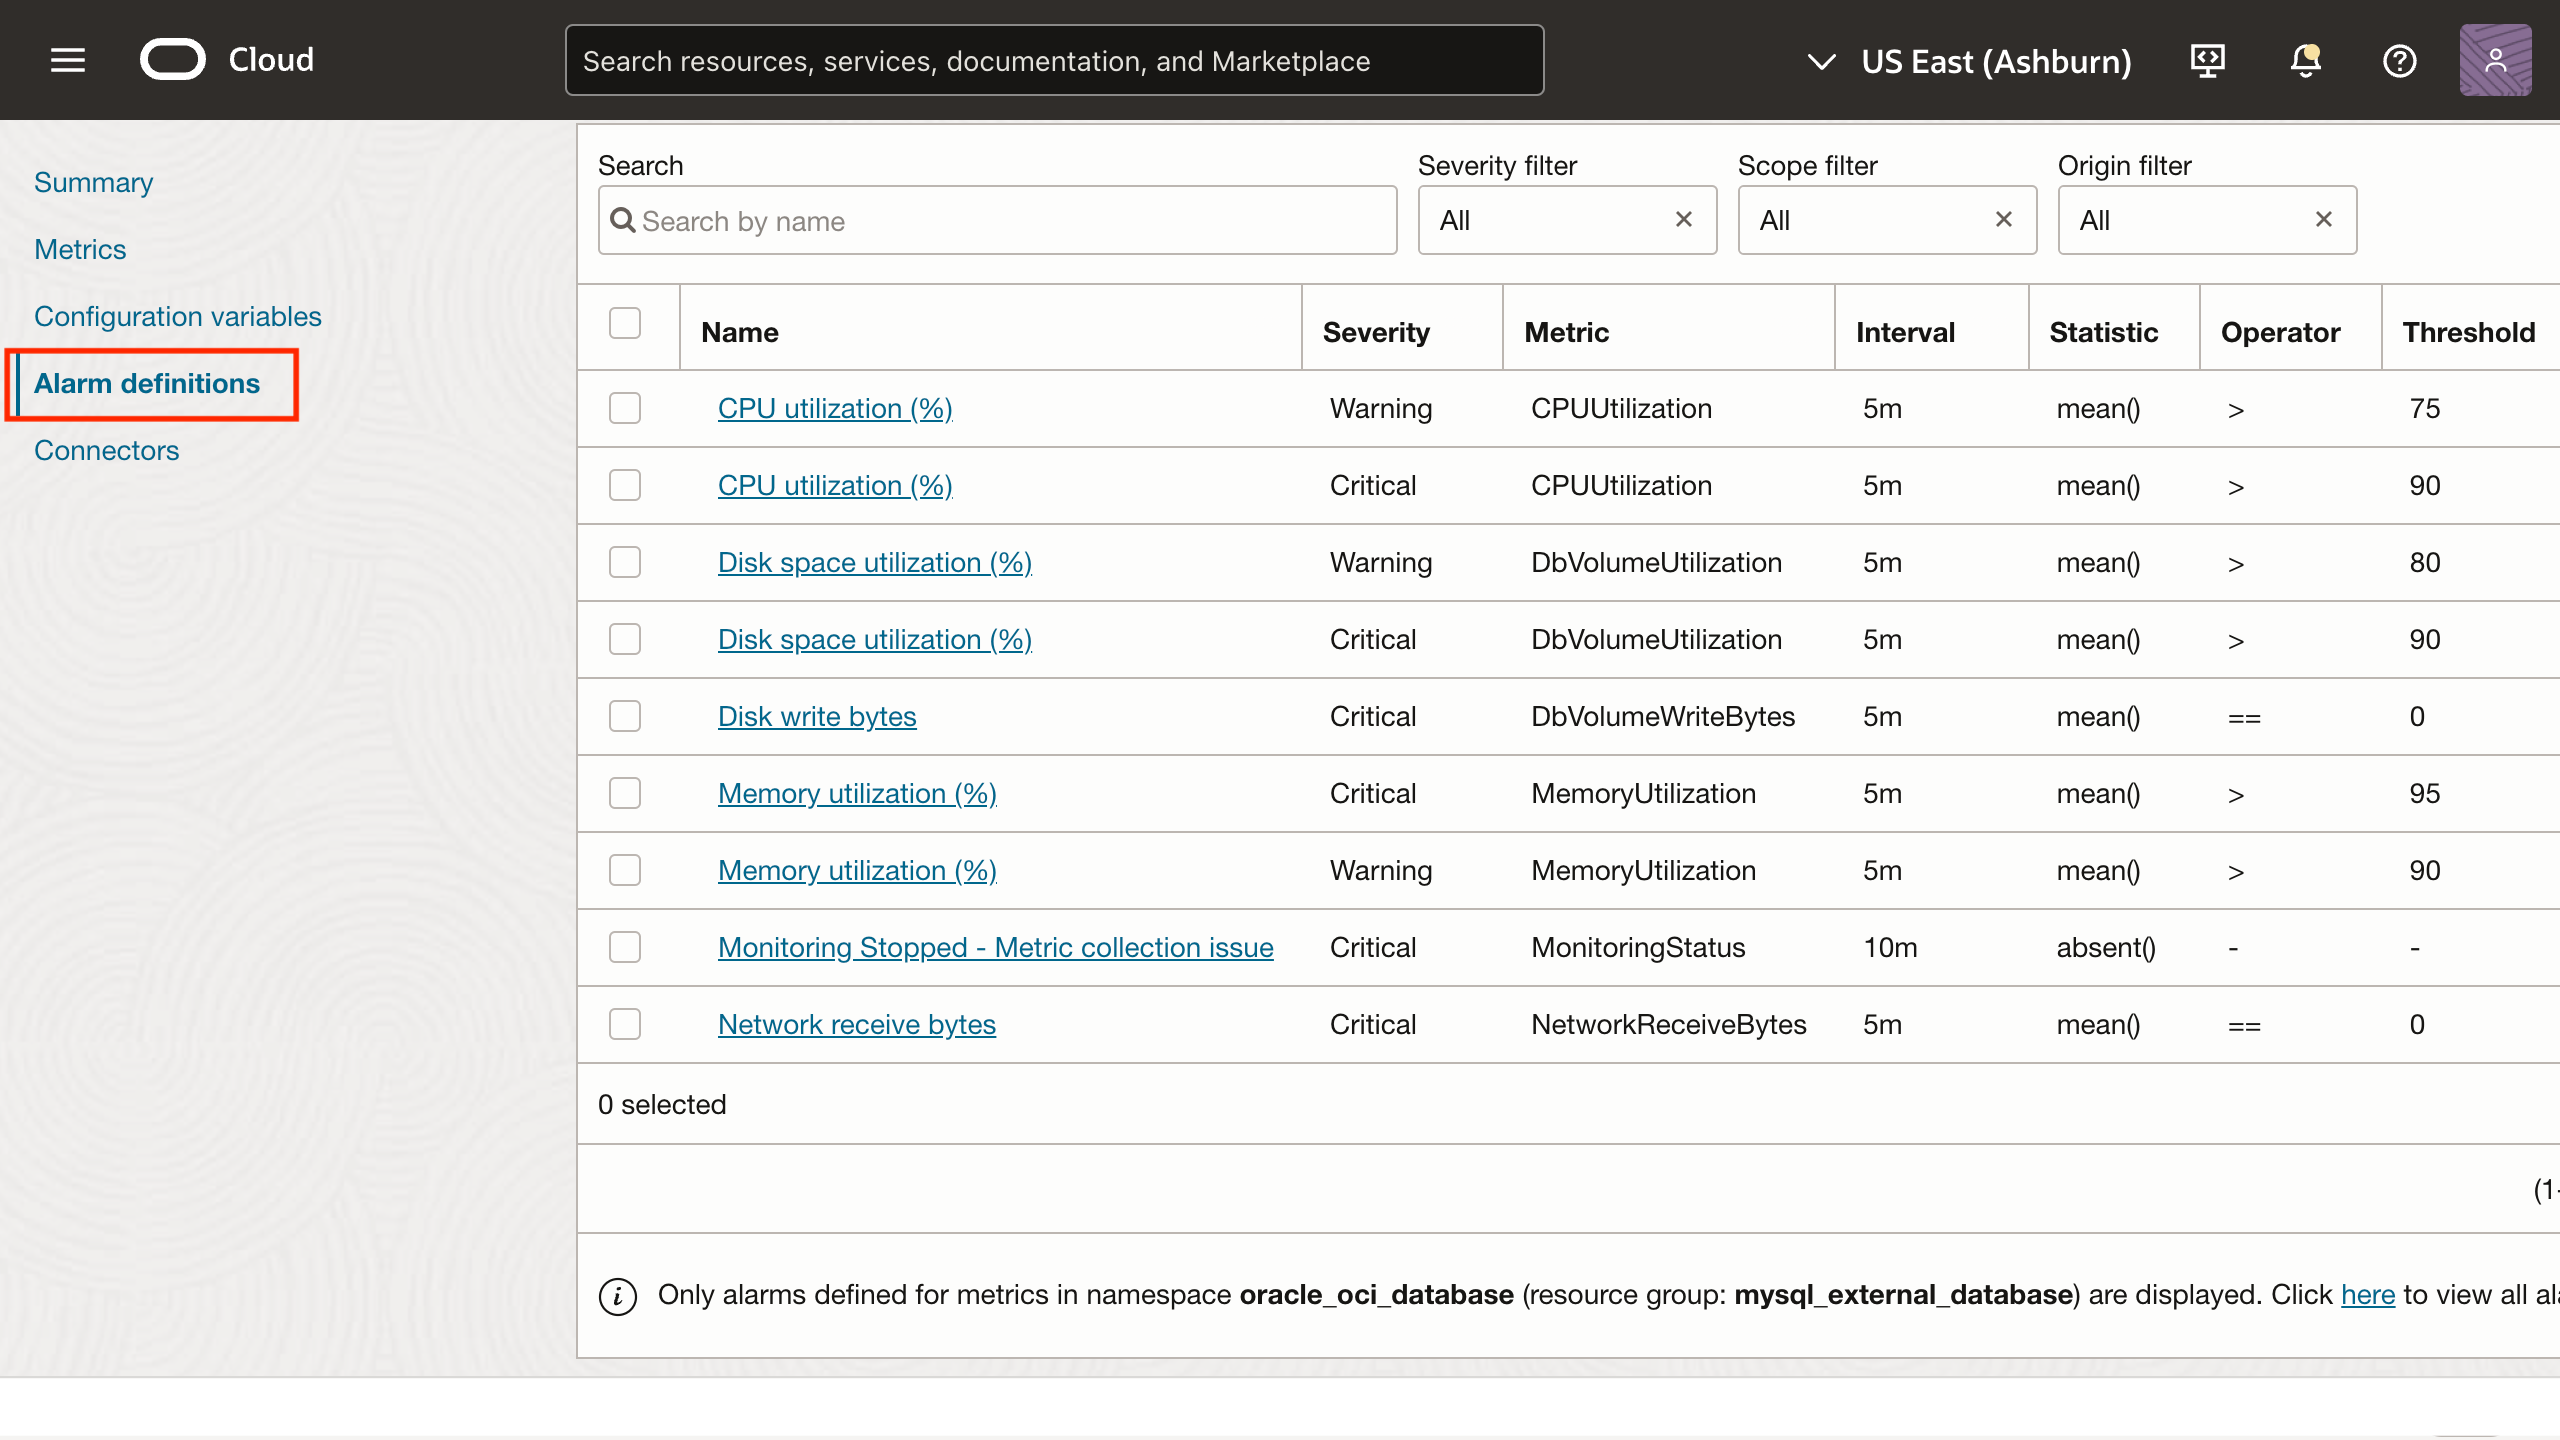
Alarm definitions of MySQL DB system
In the Alarm definitions section, you can easily implement Oracle-recommended alarms with predefined rules, thresholds, and conditions to monitor your DB systems effectively. These configurations help detect potential issues or deviations from the recommended (gold standard) settings. Proactively monitoring alarms ensures that your MySQL DB systems run efficiently, securely, and in line with Oracle’s best practices for database management.
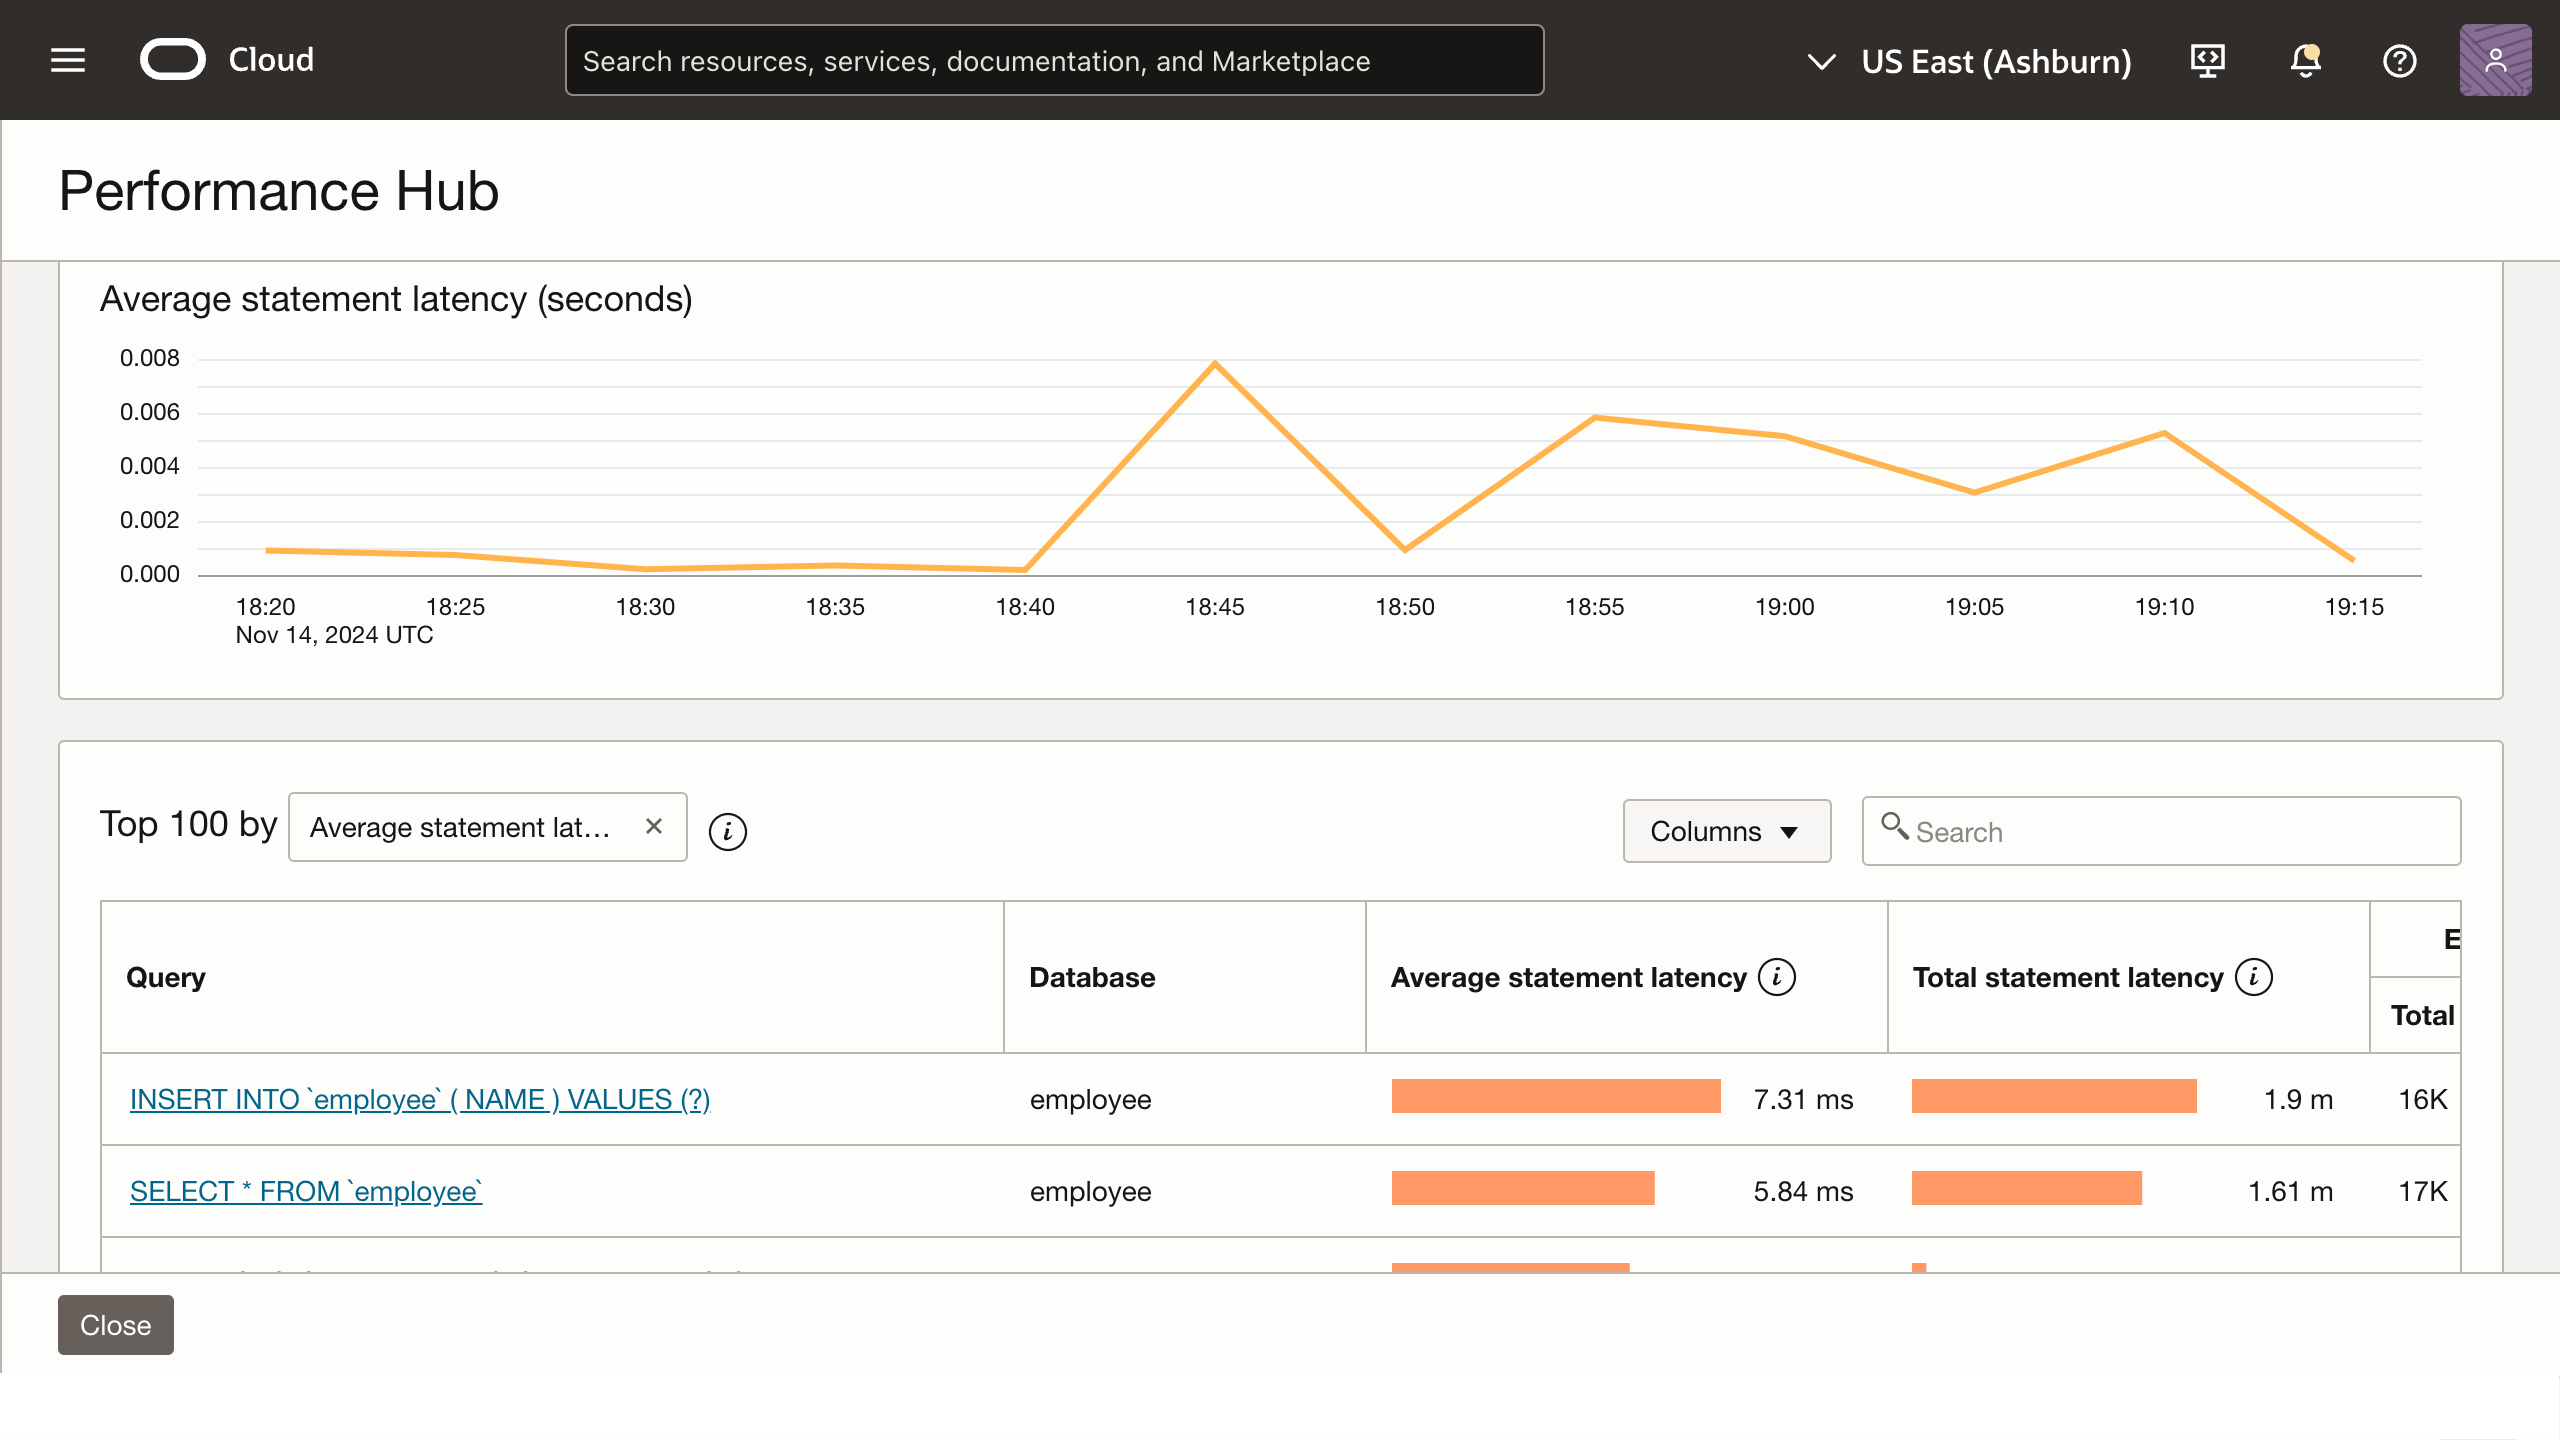
Performance Hub for MySQL DB systems
Performance Hub provides developers and DBAs with a powerful tool to quickly enhance database application performance by monitoring query performance. It provides detailed monitoring into both well-performing and inefficient SQL code, allowing you to identify and address specific performance issues. With Performance Hub, developers can optimize SQL code during active development and in production systems, ensuring smoother and faster operations.
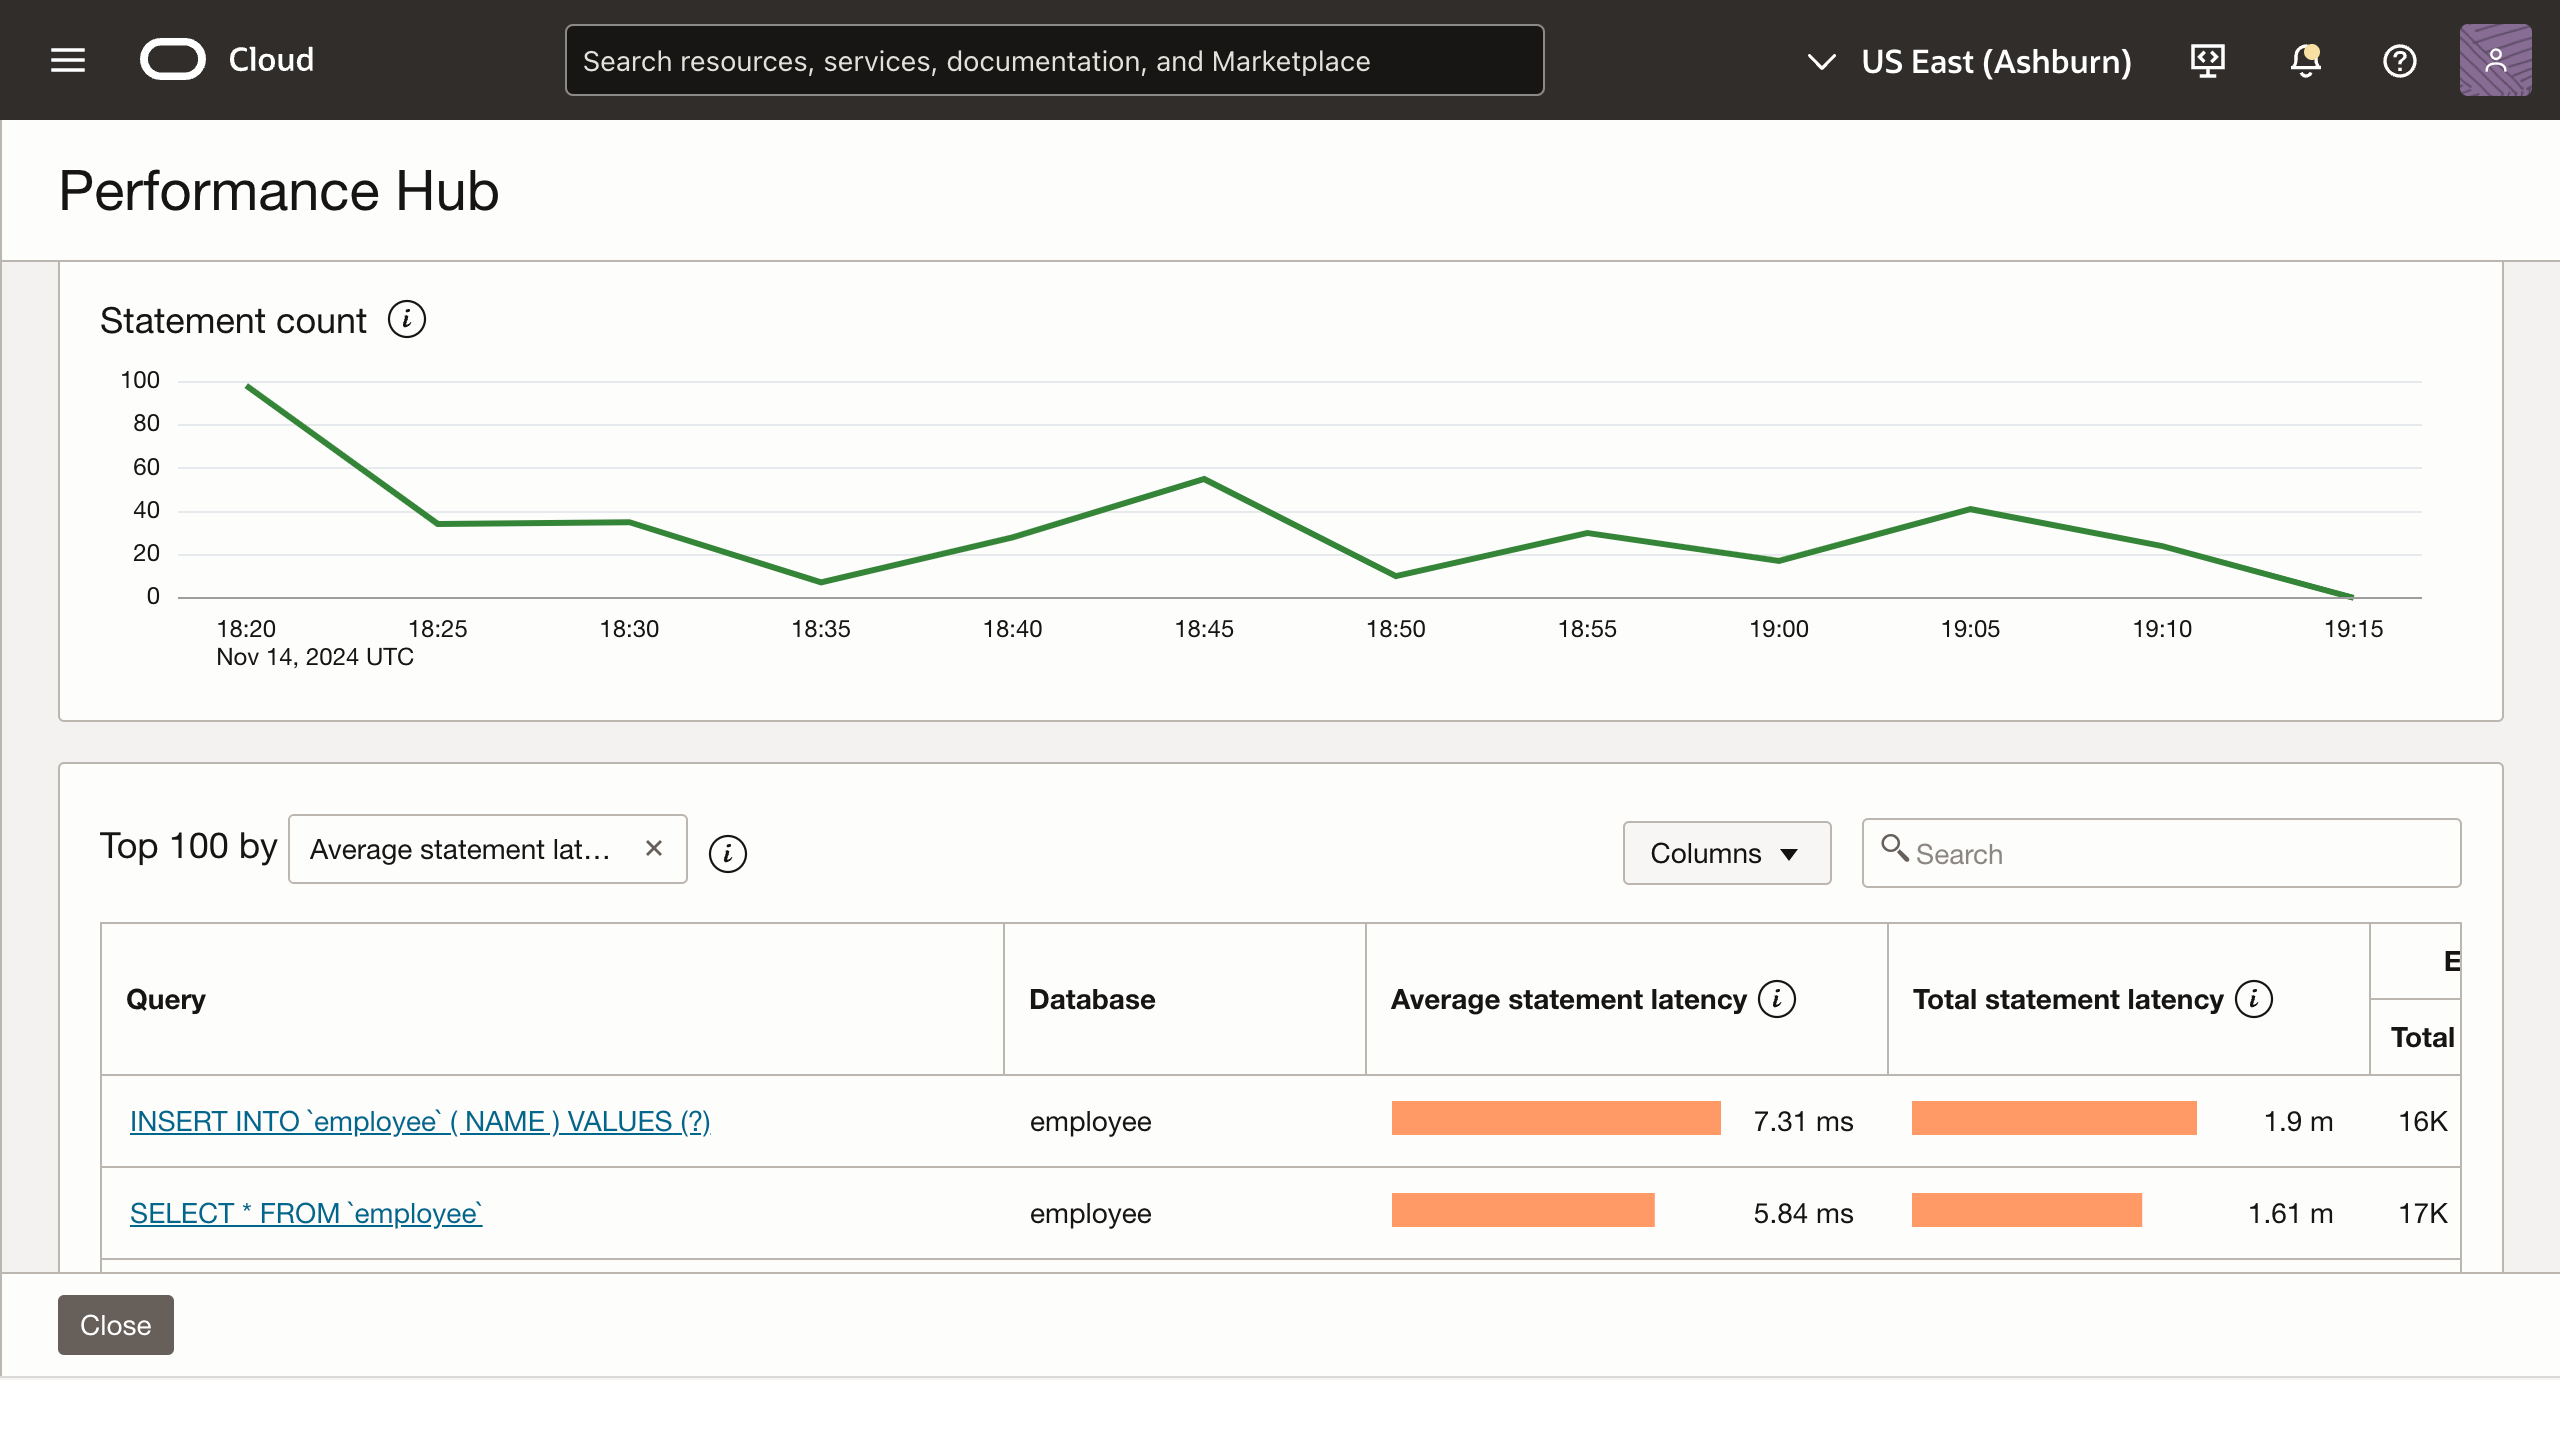
Key features of Performance Hub for MySQL DB systems include:
- Identifying expensive and resource-heavy queries that impact application performance
- Using advanced search options to pinpoint specific query issues, such as full table scans and inefficient indexes
- Visualizing query activity to gain deeper insights into performance beyond query statistics
- Analyzing post optimization results to confirm improvements in the query execution
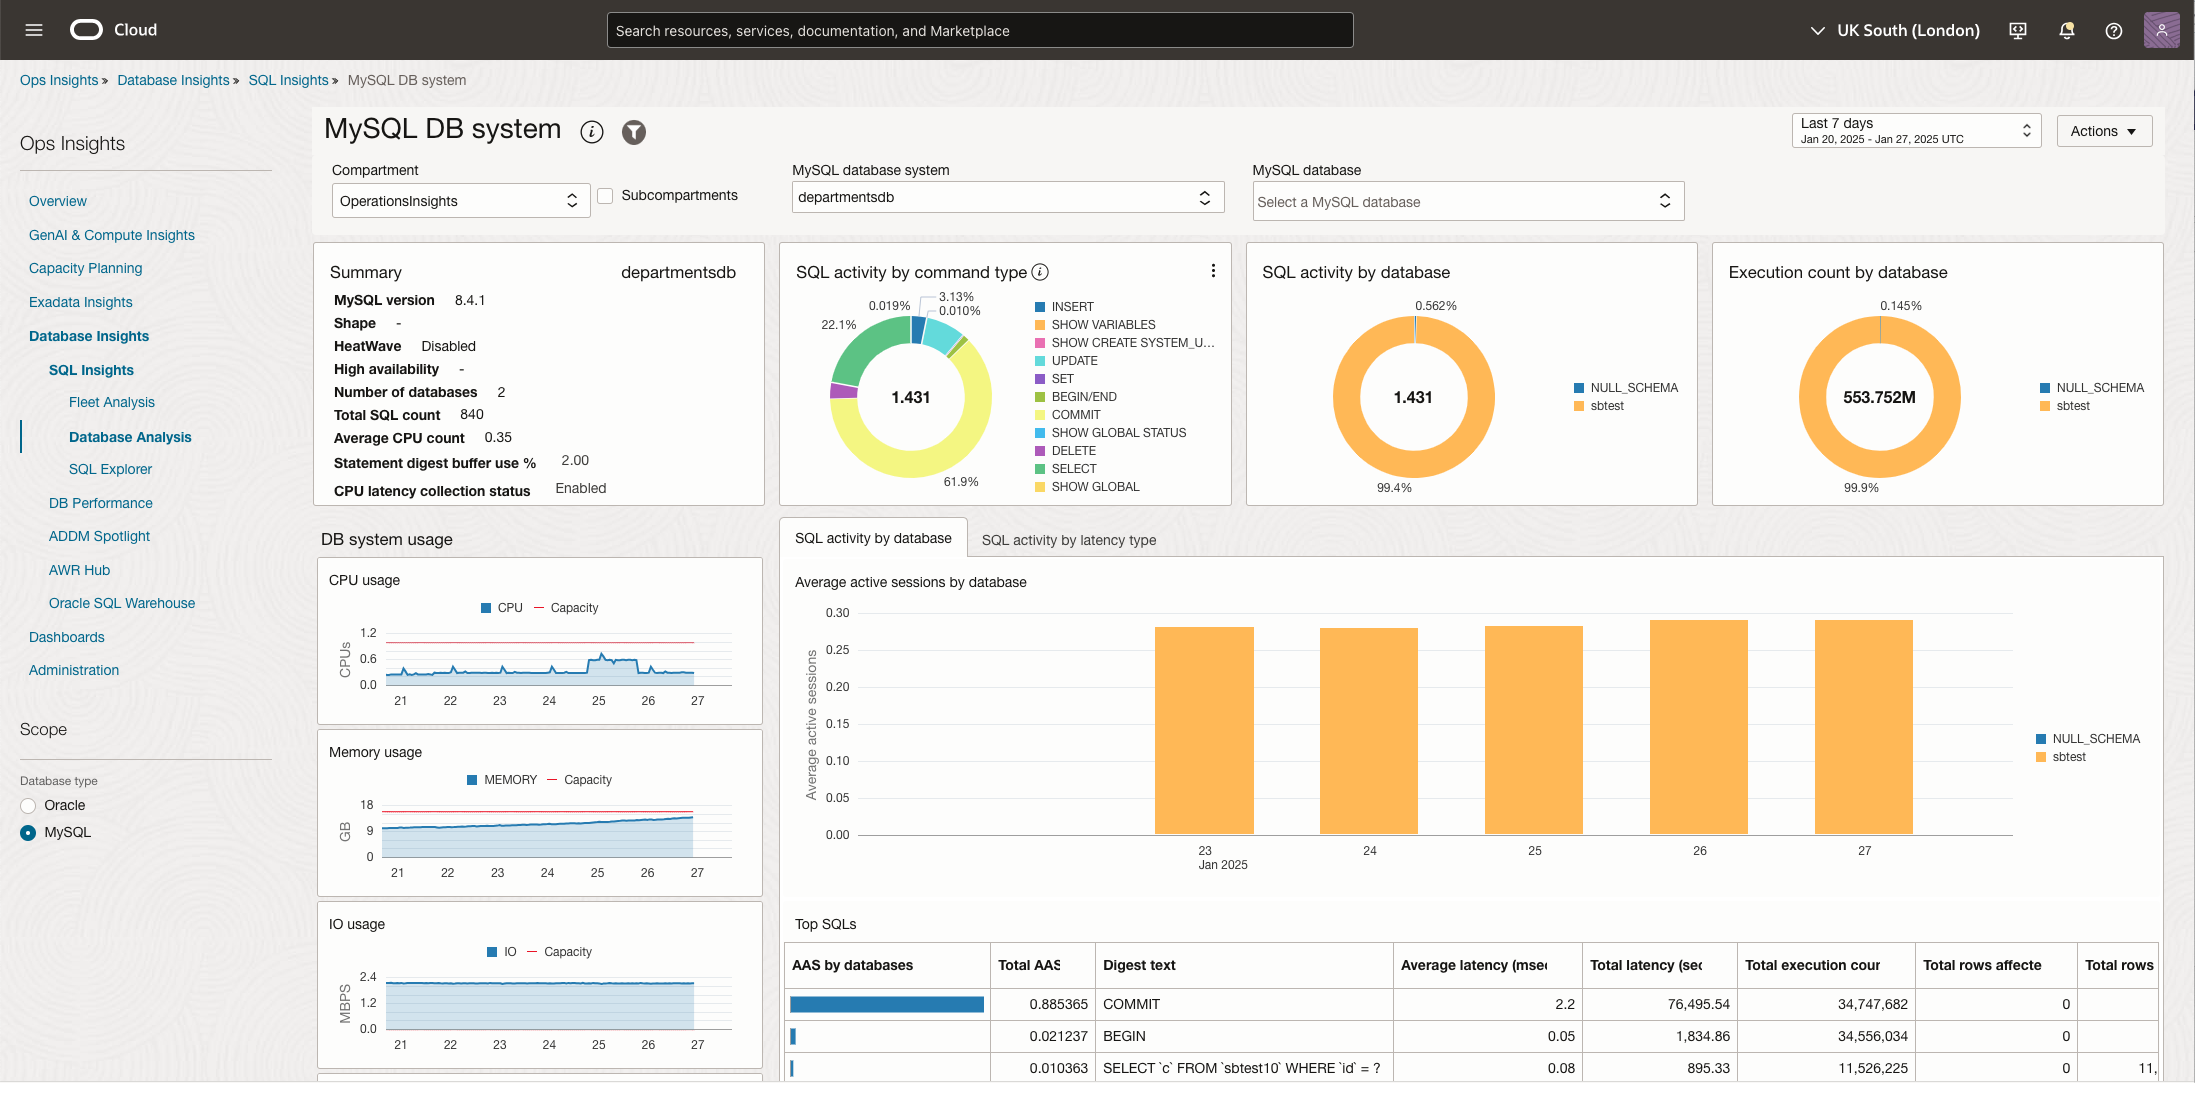
OCI Ops Insights feature summary and benefits
- Analyze resource usage of External MySQL and databases/hosts across the enterprise
- Forecast future demand for resources based on historical trends
- Compare SQL Performance over time in a single database or across databases
- Identify SQL performance patterns, and trends across enterprise-wide databases
- Utilize MySQL Data Objects to author custom SQL queries and explore database performance using dashboard framework
Get started today!
Oracle Cloud Infrastructure’s Database Management and Ops Insights services are designed to support on-premises (External) MySQL DB systems, offering robust features for monitoring, managing, and optimizing your MySQL DB systems. These services supports MySQL 8.x and later versions, ensuring compatibility with the latest features. Database Management service is a mandatory pre-requisite for enabling Ops Insights.
Take advantage of the OCI Database Management and Ops Insights services today to enhance the reliability and efficiency of your on-premises (External) MySQL DB systems.
Watch this video series to quickly get started onboarding for Database Management and Ops Insights.
Access Database Management and Ops Insights through the Observability and Management menu in the Oracle Cloud Infrastructure Console. The service is accessible through the Console, CLI, and REST API. Database Management and Ops Insights is available in all OCI commercial regions. For more details and availability in US and other government regions, please check the OCI service availability page.
For more information on how to use them, see the documentation for Database Management and Ops Insights.