Monitoring applications that vary in stack components can often be challenging. A unified approach to monitoring these components allows for end-to-end visibility and insight into issues that may arise. OpenTelemetry is an industry standard for collecting trace, metric, and log data for most programming languages. It can provide powerful insights when combined with OCI Observability and Management services such as OCI Application Performance Monitoring and OCI Logging Analytics. In this article, we outline how to monitor an application with OpenTelemetry.
OpenTelemetry standards for collecting application data
OpenTelemetry is an open-source framework for sending traces, metrics, and logs to your monitoring tools. It has various implementations for different programming languages and is constantly being updated/developed. The purpose of using this framework is to have a unified and standardized way to collect and send monitoring data. In this blog, we discuss how to instrument an application with OpenTelemetry and export the collected data to OCI services such as Application Performance Monitoring and Logging Analytics.
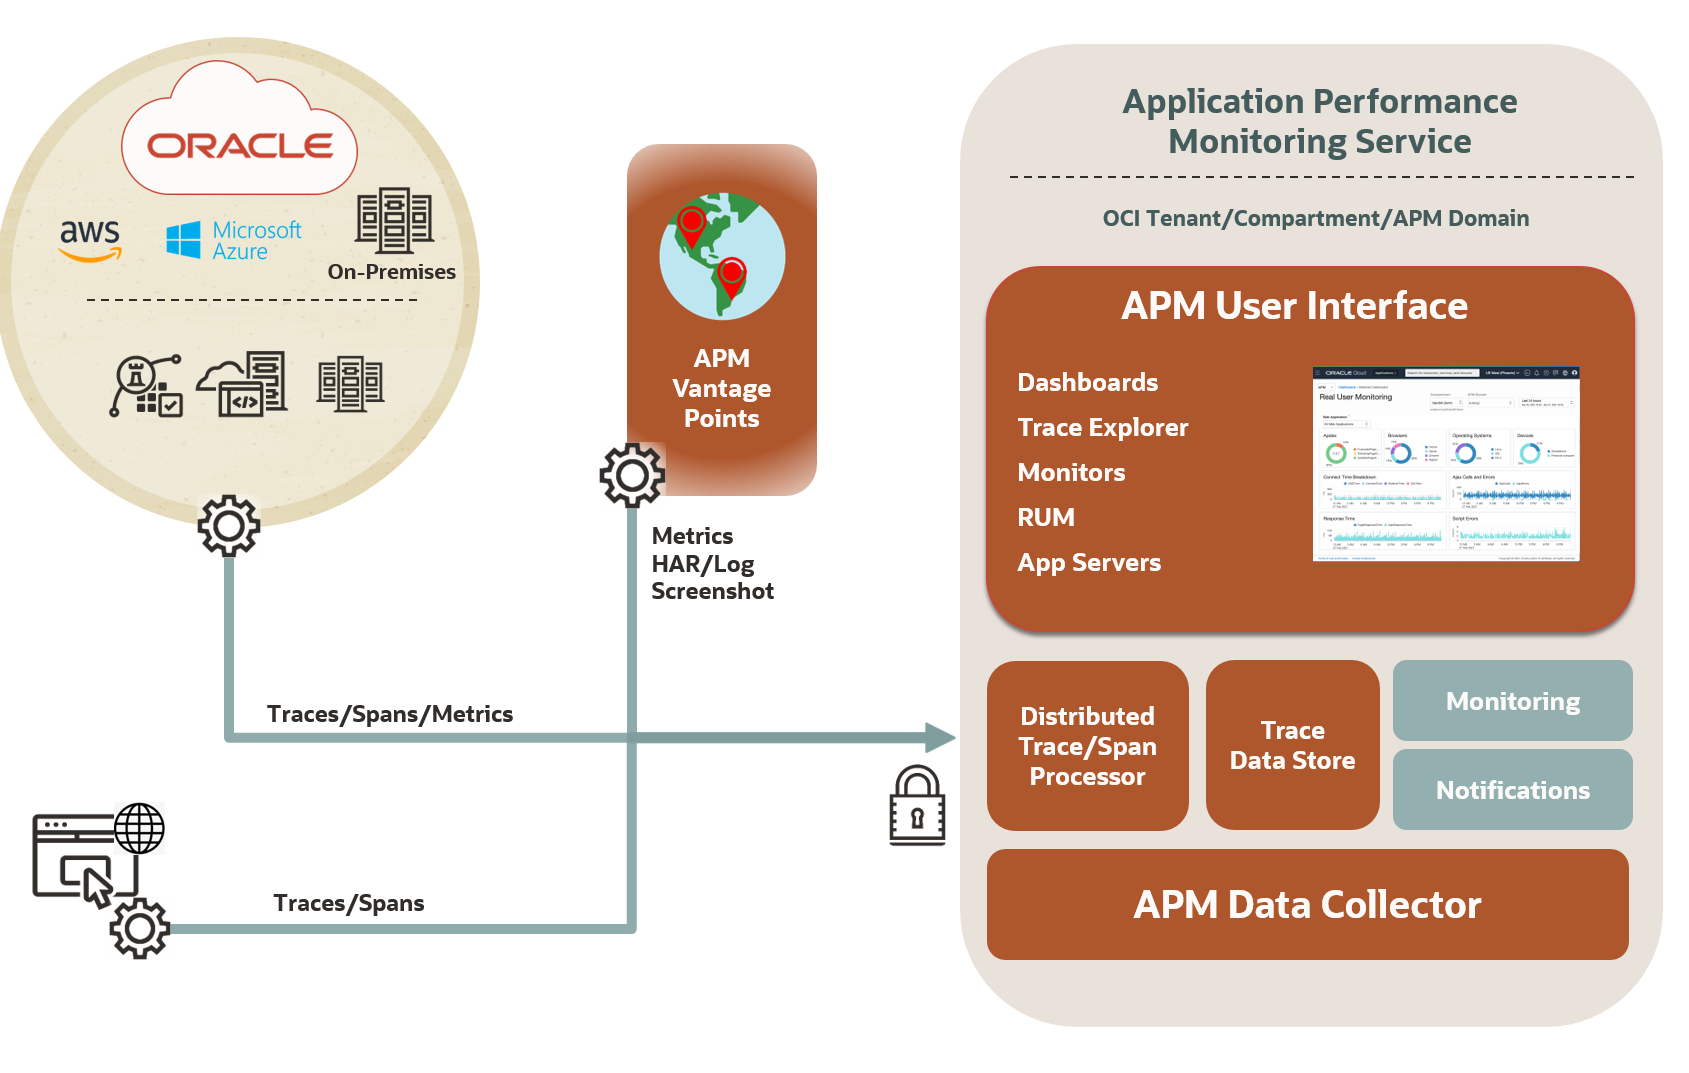
OCI Application Performance Monitoring for diagnosing and delivering consistent service levels
Application Performance Monitoring (APM) provides deep visibility into the performance of applications and provides the ability to diagnose issues quickly to deliver a consistent level of service. This includes the monitoring of the multiple components and application logic spread across clients, third-party services, and back-end computing tiers, on-premises or on the cloud.
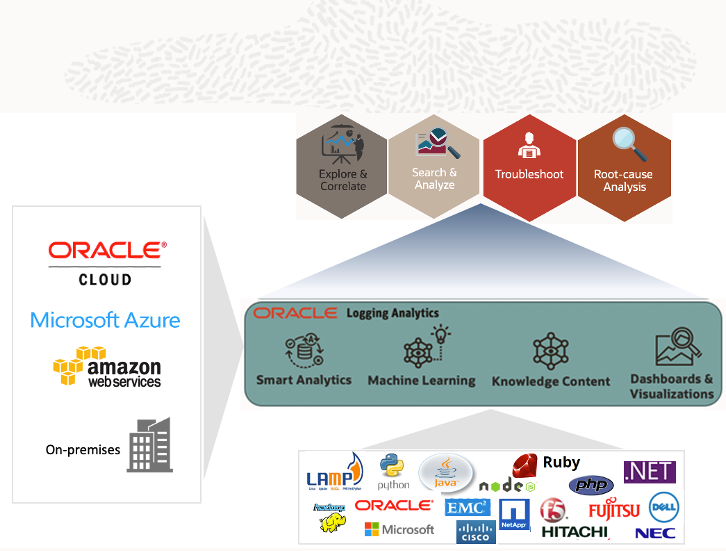
OCI Logging Analytics for gaining key insights into log data
Logging Analytics is a cloud solution in Oracle Cloud Infrastructure that lets you index, enrich, aggregate, explore, search, analyze, correlate, visualize, and monitor all log data from applications and system infrastructure. Gain powerful insights from log data using curated AI/ML models built within Logging Analytics.
GitHub example
If you would like to implement monitoring for MERN/MEAN/MEVN application(s), use the GitHub repository below:
This repository includes:
- Files to instrument the application’s frontend and backend.
- A file to send custom metrics to APM.
- A file to send log messages to Logging Analytics
- A sample application to experiment with the OpenTelemetry implementation.
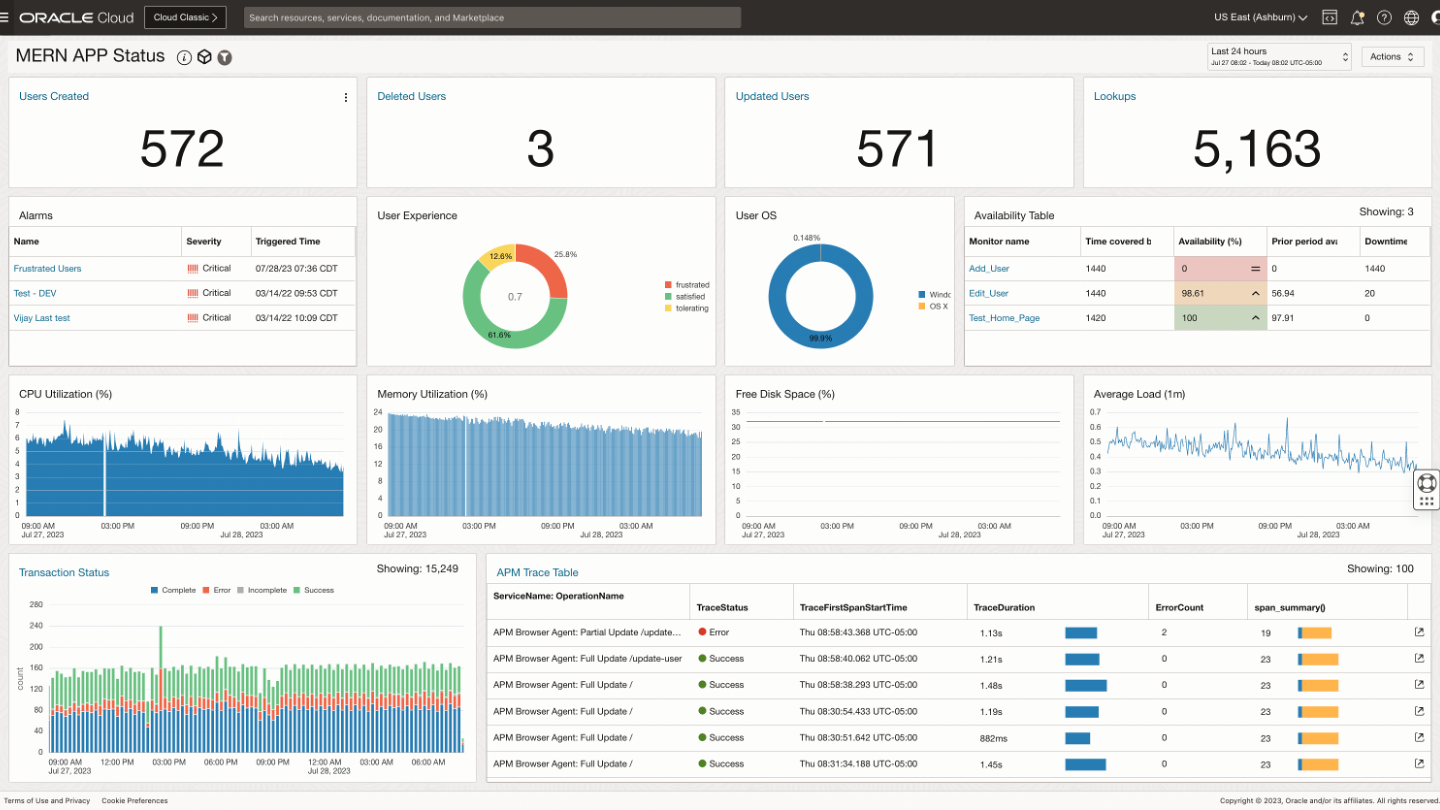
Sample use case
We utilized the tracing, metric, and logging scripts from the GitHub example to monitor a user management web application (built on a MERN stack). The goal was to create a dashboard that consists of trace data along with business, user experience, and custom host metrics.
Getting started
It is important to recognize that the OpenTelemetry implementation can be stable, experimental, or not yet developed for metrics, traces, and logs in different programming languages. View stack compatibility below:
Create an APM domain
Review the OCI documentation to create an APM domain
- Go to the APM Administration page (Main OCI menu –> Observability & Management –> Application Performance Management –> Administration)
- Click on “Create APM Domain” and provide a domain name.
-
Take note of the following (found in the APM domain page):
- Data upload endpoint (URL for sending data to APM)
- Public data key (to be used with the APM browser agent)
- Private data key (to connect with data collectors such as OpenTelemetry)
Create an API signing key
- Login to OCI console → User → User settings
- Select API Keys under Resources
- Click on Add API Key → Generate API Key Pair → Click on Download Private Key & then Add.
- Copy the content from Configuration File Preview & Close
Create a configuration file
Create a directory (.oci) and a config file with content from configuration file preview and path to private key file. Below is an example of what the configuration file should look like:
[DEFAULT]
user= [User OCID]
fingerprint= [API Key Fingerprint]
tenancy= [Tenancy OCID]
region= [Region]
key_file= [Path to Private Key File]
Create a log parser
- Observability & Management → Logging Analytics → Administration
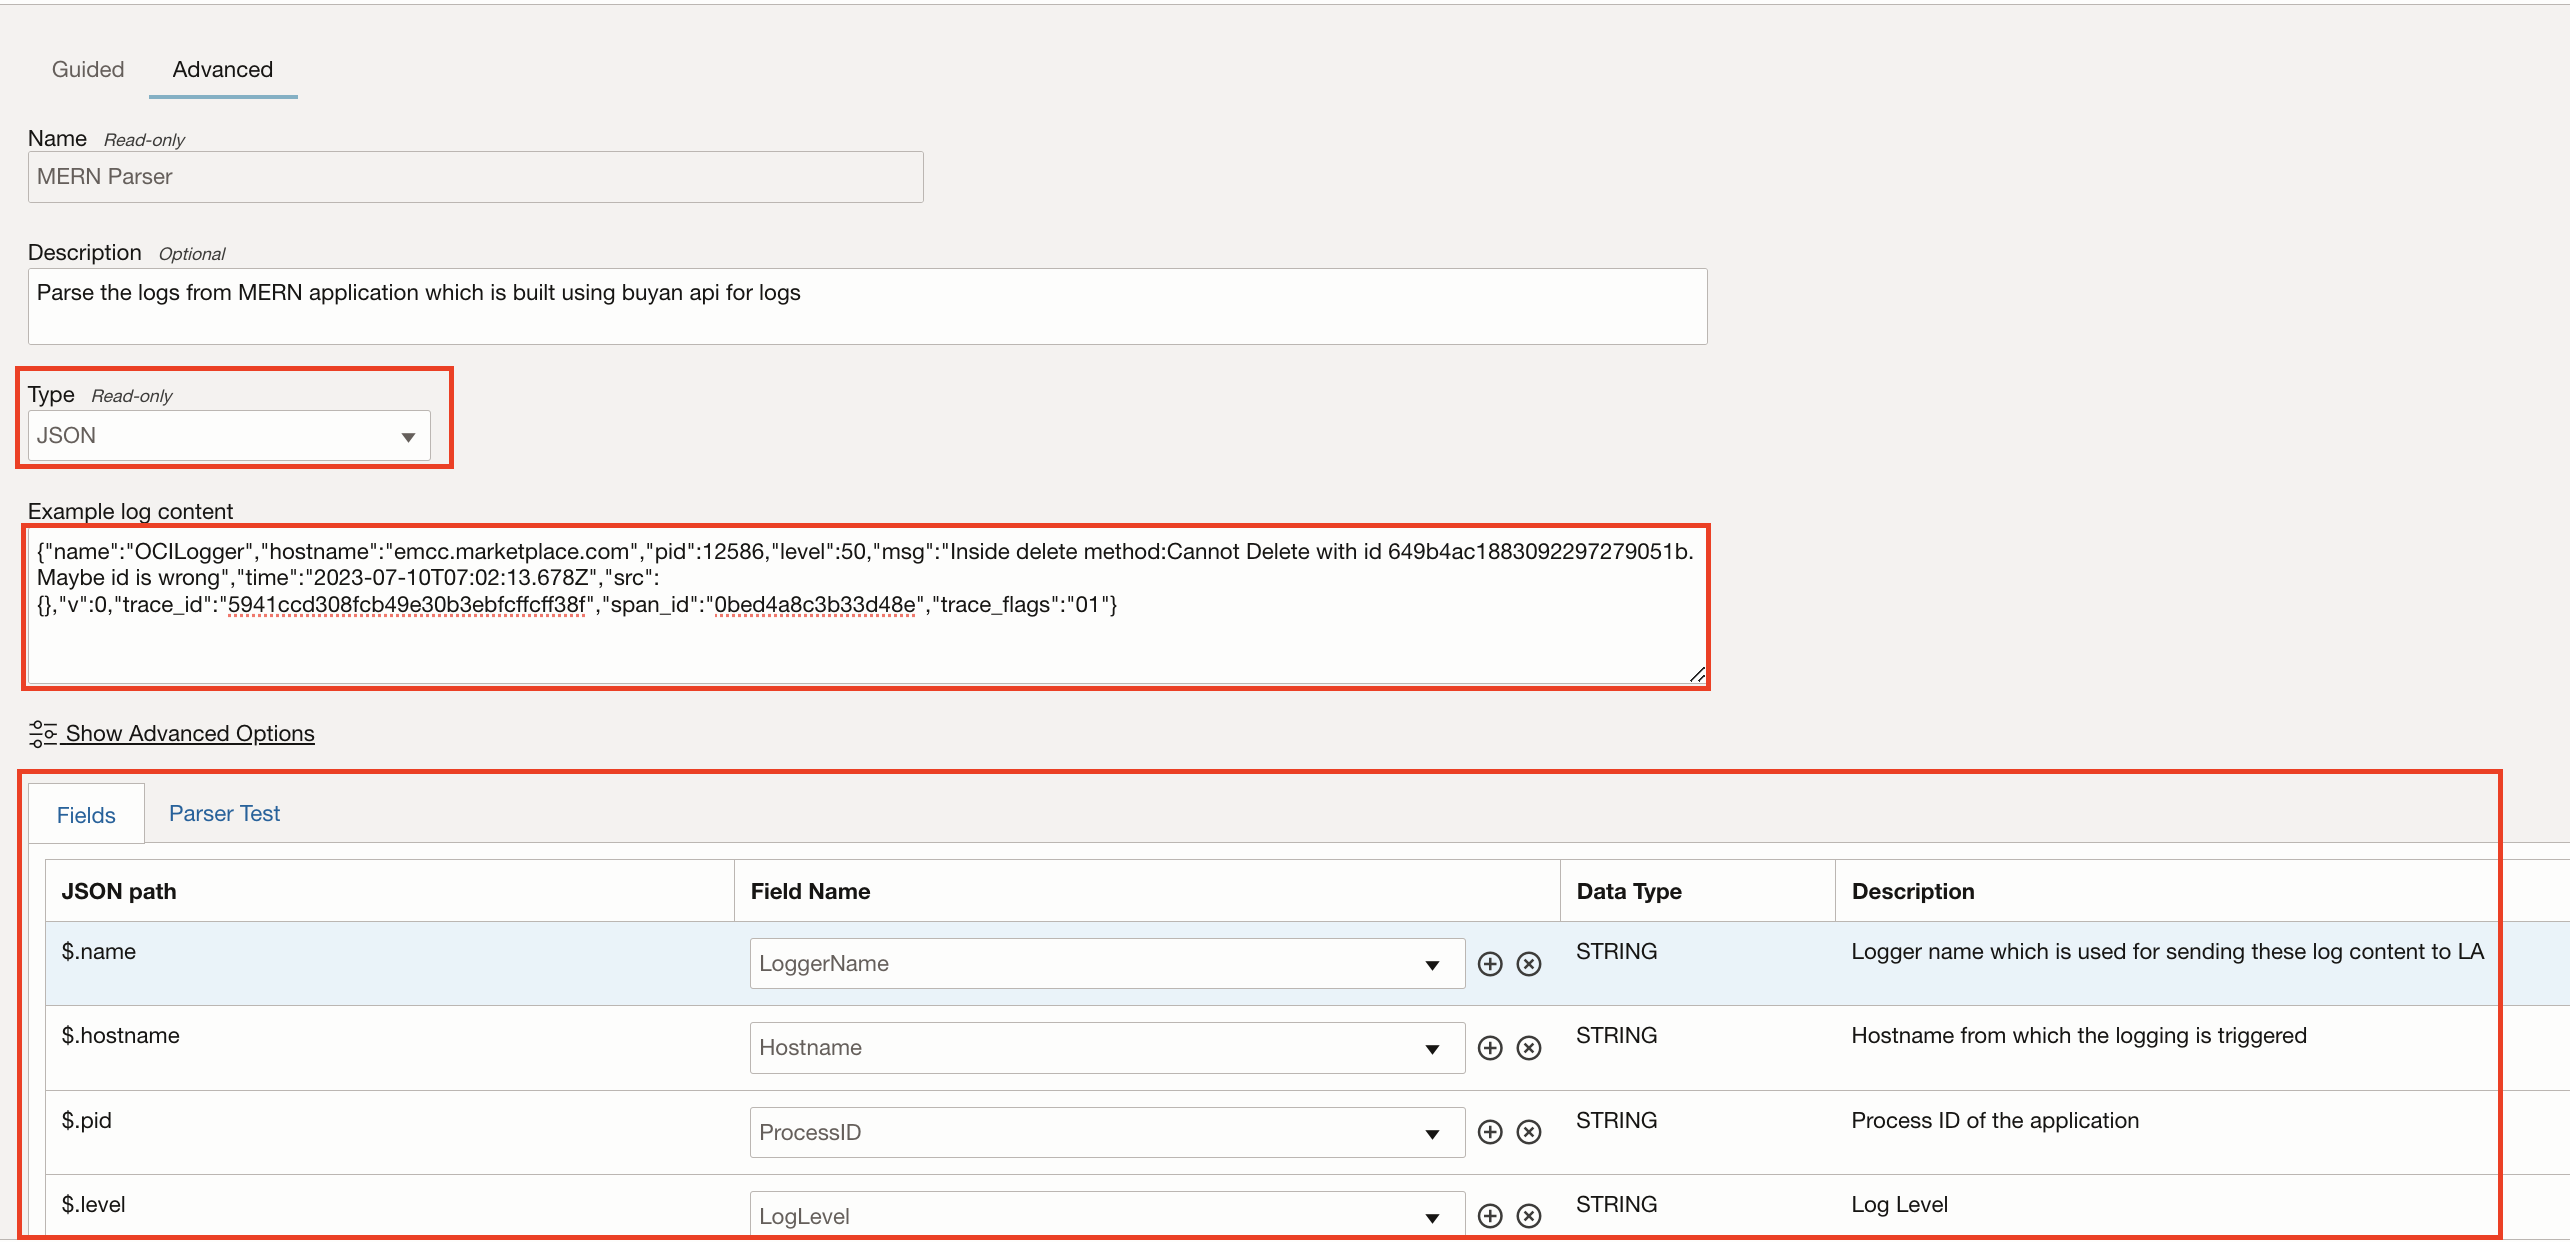
- Click on Parsers → Create Parser → Choose JSON type
- Enter example JSON log content it will parse and extract fields and map it to specific field names as needed and click save changes.
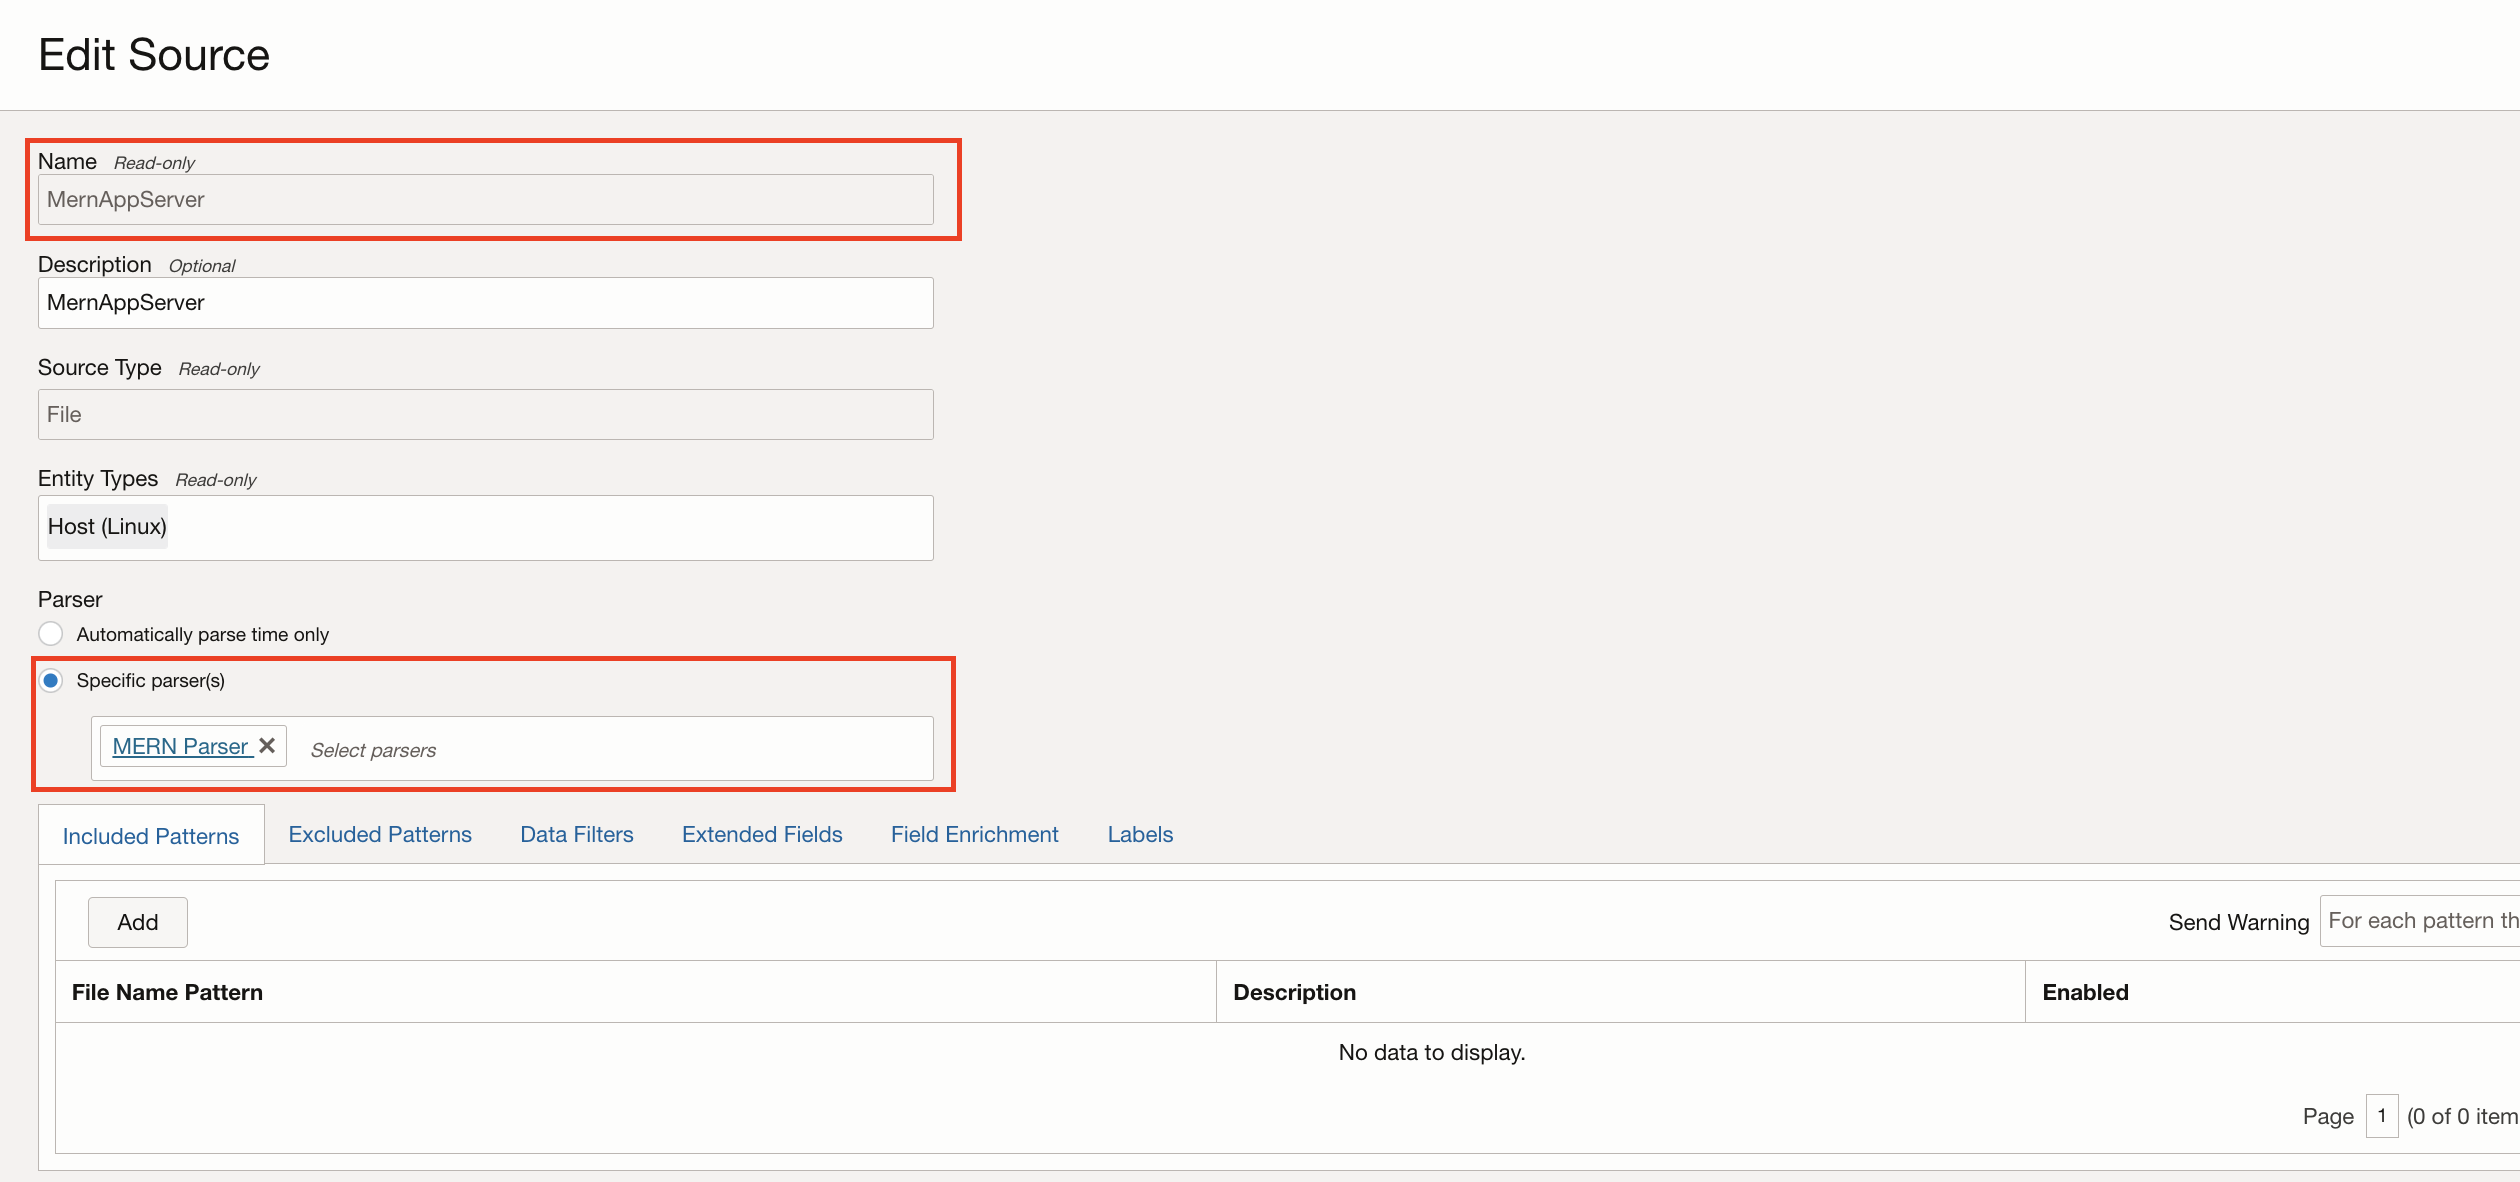
Create a log source
- Go to Logging Analytics → Administration → Sources → Create Source
- Source Type → File
- Entity Types → Host (Linux)
- Select Specific Parser → Select the parser created.
- Click on Create Source
Create a log group
- Logging Analytics → Administration → Log Groups → Create Log Group
- Provide Log Group Name and description → click create.
- Make a note of OCID of Log Group which will be used later.
Get the namespace details
- Go to Identity → Compartments → Click on compartment where the log source is created → Copy OCID of the compartment
- Now launch cloud shell and execute below command to get the namespace execute below mentioned command.
oci os ns get -c compartmentID
Implementation
Instrumenting an application
To monitor an application’s frontend, instrument the APM browser agent. Find the steps here:
Server instrumentation:
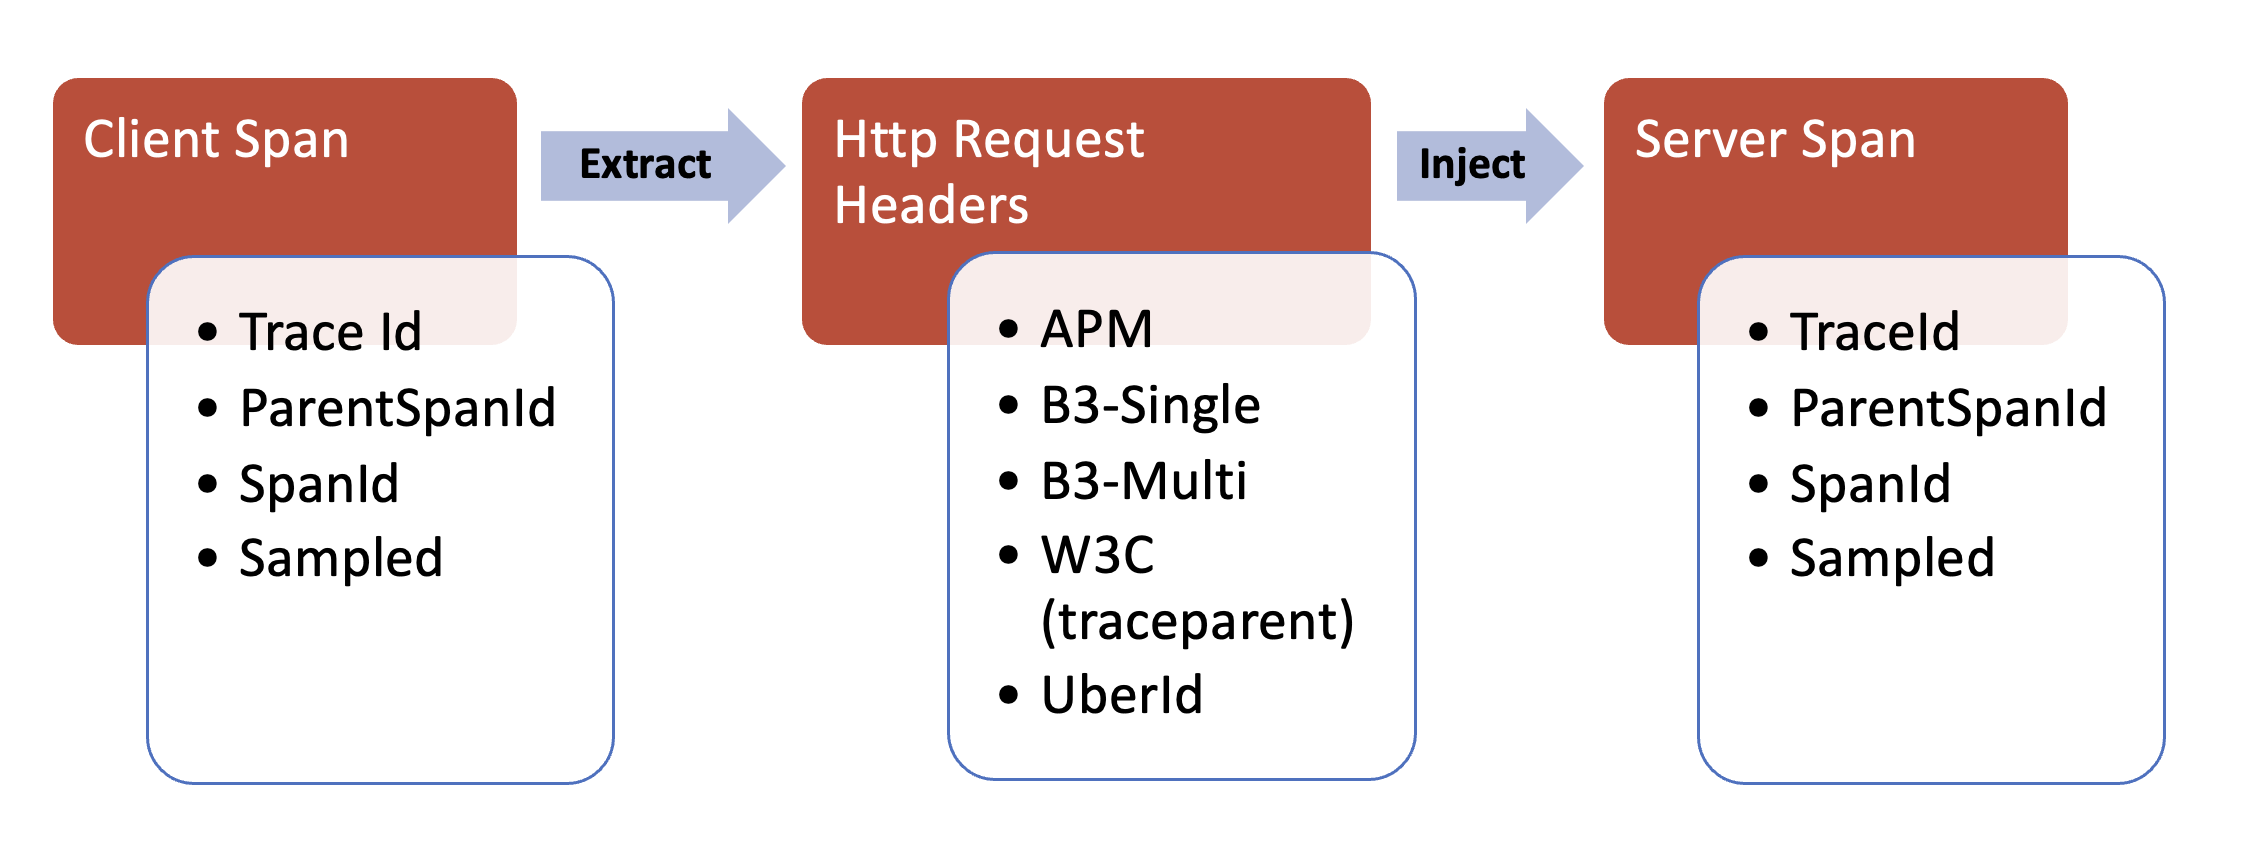
- To get end-to-end traces, context propagation is needed from the front-end traces of a browser/client to the server. One thing to keep in mind when doing so is ensuring there are HTTP headers to provide the context. By default, OpenTelemetry uses W3C (traceparent) to automatically propagate the context. There are other header types which can be used but would need to be account for it the application code.
- Be sure to add the following code with the snippet of JavaScript that runs the browser/client instrumentation:
- window.apmrum.traceSupportingEndpoints = [ { headers: [ ‘W3C’], hostPattern: ‘.*’ } ];
- Follow the steps for your programming language to instrument the backend (automatic instrumentation or manual – depending on what is available.
- Examples in GitHub:
Sending application logs
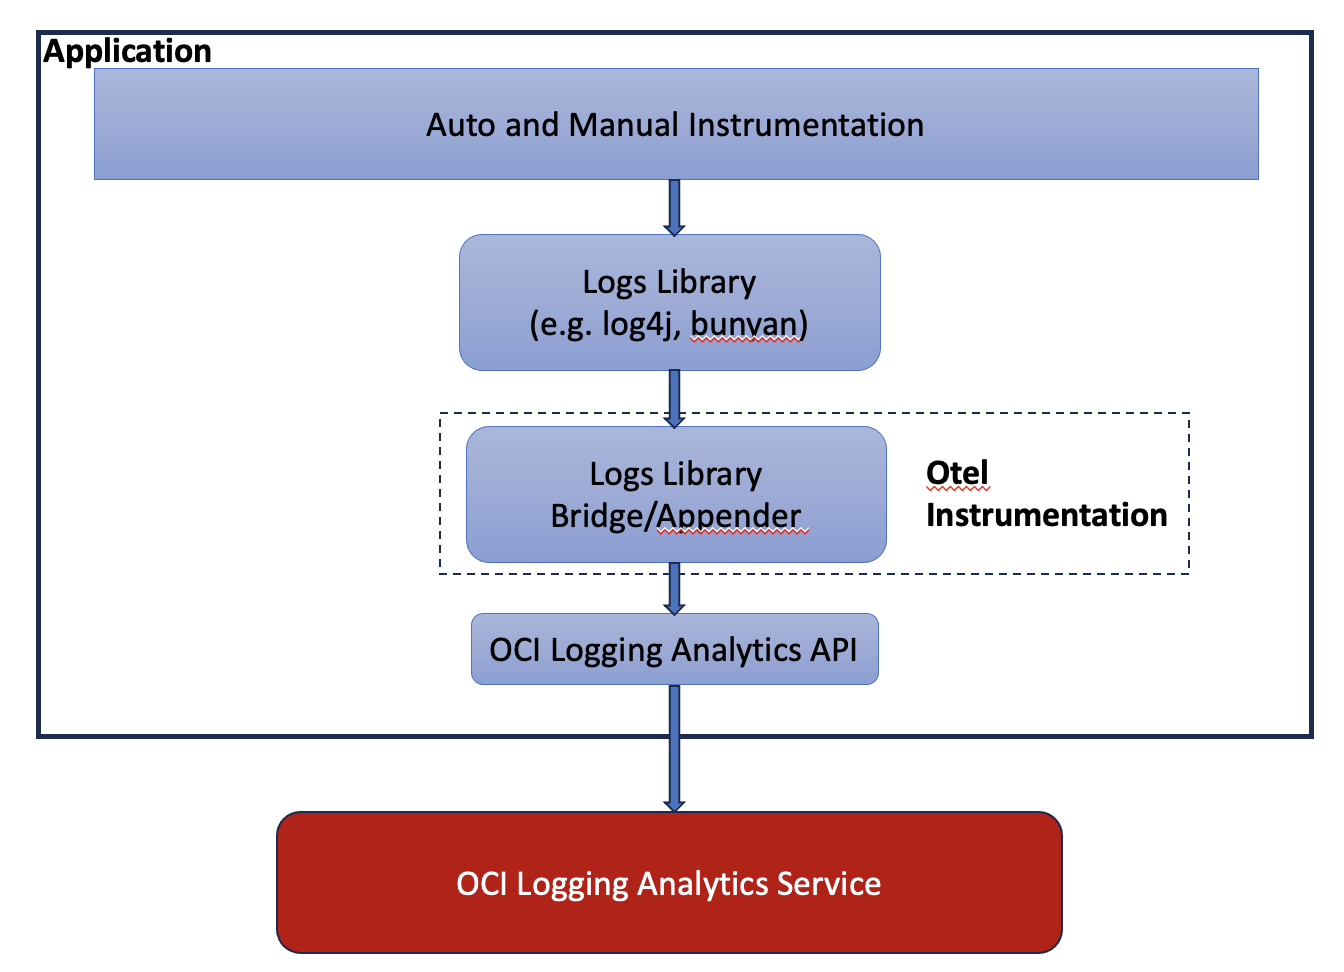
The application is instrumented to collect traces and metrics using OpenTelemetry APIs and send it to OCI Application Performance Monitoring (APM). Now, let’s learn how to send application logs to OCI Logging Analytics which enables to correlate traces, metrics and logs to gain complete visibility of the application. Logging can be enabled using standard logging libraries and custom log appender must be built to send the logs using OCI provided SDK or REST endpoints as illustrated below
Creating a log appender
A custom log appender can be built using OCI Logging Analytics SDKs provided for different programming languages like Java, Python, .Net, TypeScript/JavaScript, Go and Ruby or use OCI Rest Endpoints.
SDKs
https://docs.oracle.com/en-us/iaas/Content/API/Concepts/sdks.htm
Endpoint
https://docs.oracle.com/en-us/iaas/api/#/en/logan-api-spec/20200601/Upload/UploadLogFile
From the steps described above gather the parameters required to initialize and send logs to OCI Logging Analytics.
- [PATH]/config – Path to config file
- [PROFILE] – Profile in config file to be used for OCI authentication
- [NAMESPACE] – Namespace
- [UPLOADNAME] – User defined name for uploads
- [LOGSOURCENAME] – Log Source Name created in OCI logging analytics
- [LOGFILENAME] – Log file name to indicate log messages are related to specific log file
- [LOGGROUPID] – Log Group ID created in Logging analytics to group the log messages
Example in GitHub: Log Appender – JavaScript (MERN Stack)
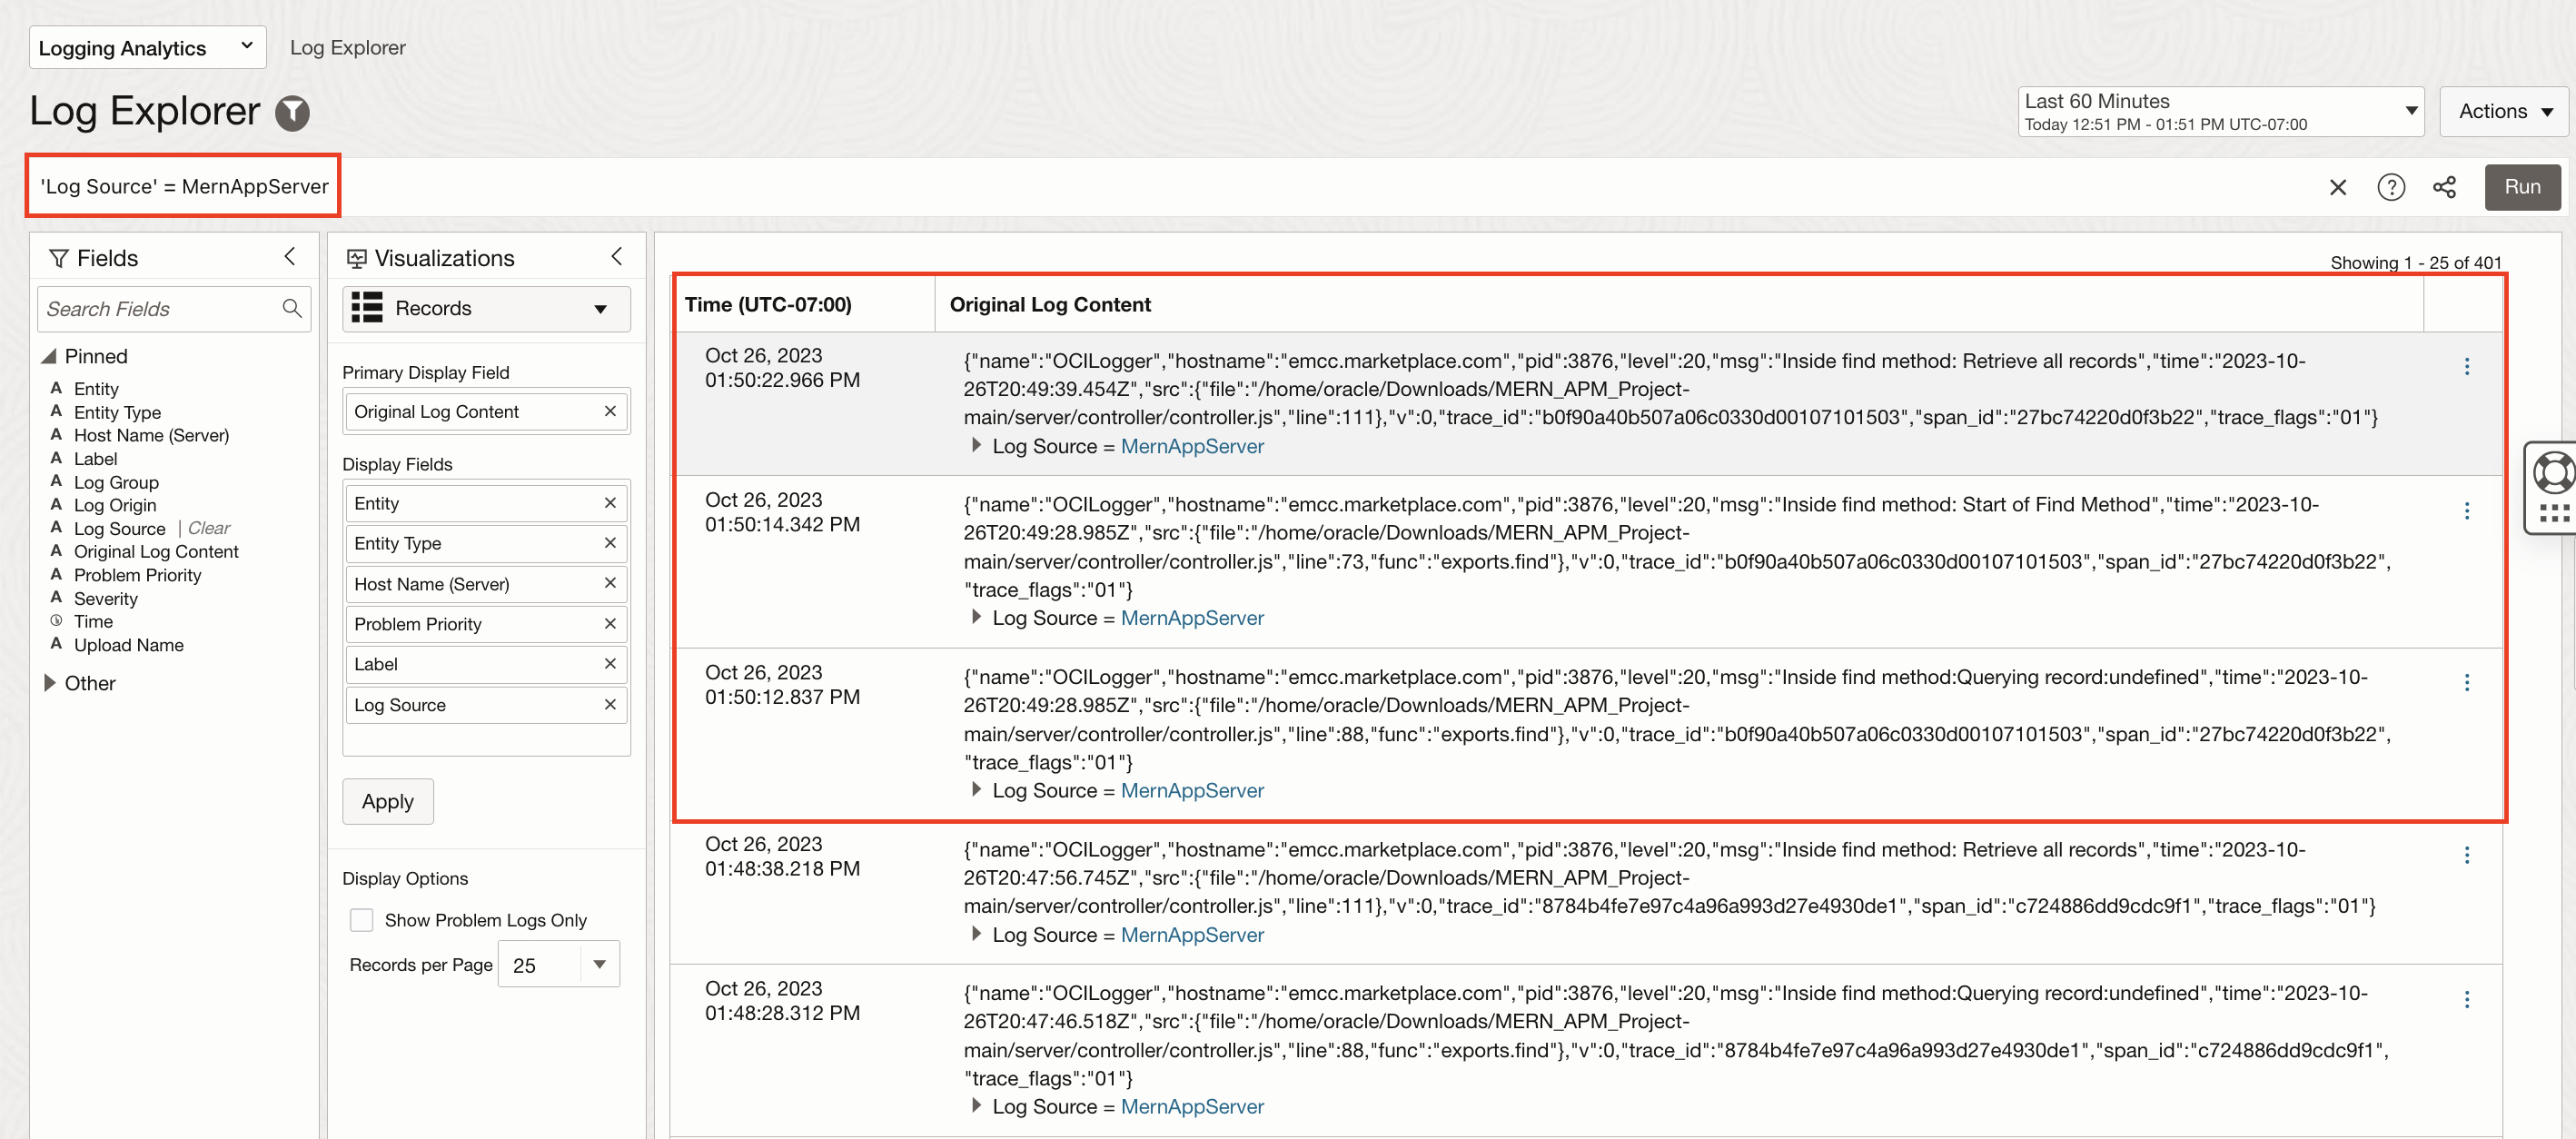
Once the log records are created for different log levels (debug, info, warn and error) thru log appender it will be sent to OCI Logging Analytics, and one can view the log records in Log explorer as shown below.
Correlating traces and logs
OpenTelemetry includes TraceId and SpanId in the log records and this allows to directly correlate logs and traces that correspond to the same execution context. Application traces and spans flows into OCI Application Performance Monitoring and logs into OCI Logging Analytics service. OCI APM provides an easy way to navigate from traces and spans to logs in logging analytics in one click using drilldown configuration.
Drilldowns are links to other services in OCI or other custom services using customizable URLs including attributes from spans (e.g. loganalytics/explorer?search=<OciInstanceId> where OciInstanceId is a span attribute).
Steps to create a drilldown to link traces and logs:
Creating custom dashboards
Once tracing data and metrics are in OCI, use that data to visually represent it in any way you like. Creating a custom dashboard is easy, just drag-and-drop the widgets needed and modify the source data (metric, trace, or log data). Here are a few links to get started with dashboards:
- Creating custom APM dashboards
- Creating custom Logging Analytics dashboards
- Follow this blog article on implementing Custom Trace Data Widgets to create custom widgets from APM’s Trace Explorer queries.
Resources
- OpenTelemetry documentation
- OCI APM documentation
- OCI Logging Analytics documentation
- GitHub example (JavaScript implementation)
- Setting up alarms & notifications