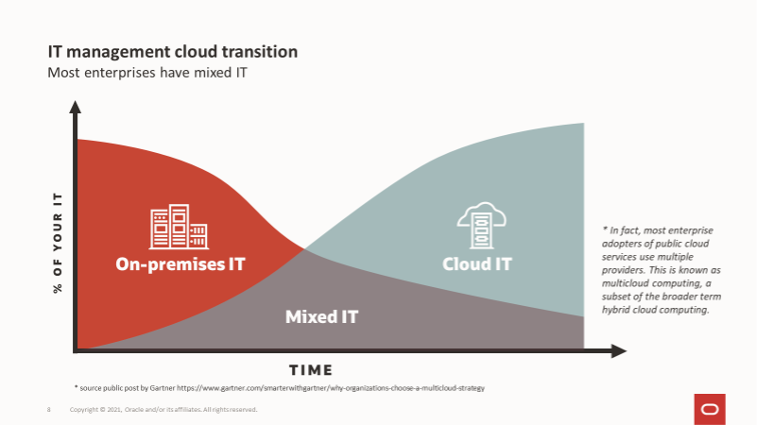
Oracle Enterprise Manager is the gold standard for Exadata administrators, providing a view to monitor all software and hardware components in an Exadata system, making it much easier to see issues, and to correlate the cause of performance problems and errors across all Exadata components. Most enterprises currently have mixed or hybrid IT with some applications running in the cloud and others are still on-premises in traditional data centers. Over time, more and more IT assets will move to the cloud but most enterprises will continue to be in this state of mixed IT for a very long time.
Seamless On-Premises and Cloud Exadata Administration
Enterprise manager introduces Exadata Cloud target, an interface to manage multiple environments at once. Exadata Cloud Target supports Exadata Cloud at Customer and Exadata Cloud Service simultaneously. Exadata Cloud Target is an interface that can be used for on-premises Exadata, cloud at customer and cloud resources from a single pane of glass. Any differences between Exadata on-premises and Exadata Cloud related targets stem from the split of responsibility for administration between Oracle Cloud Ops and the Exadata Cloud customer.
Below is a schematic view of the shared responsibility.
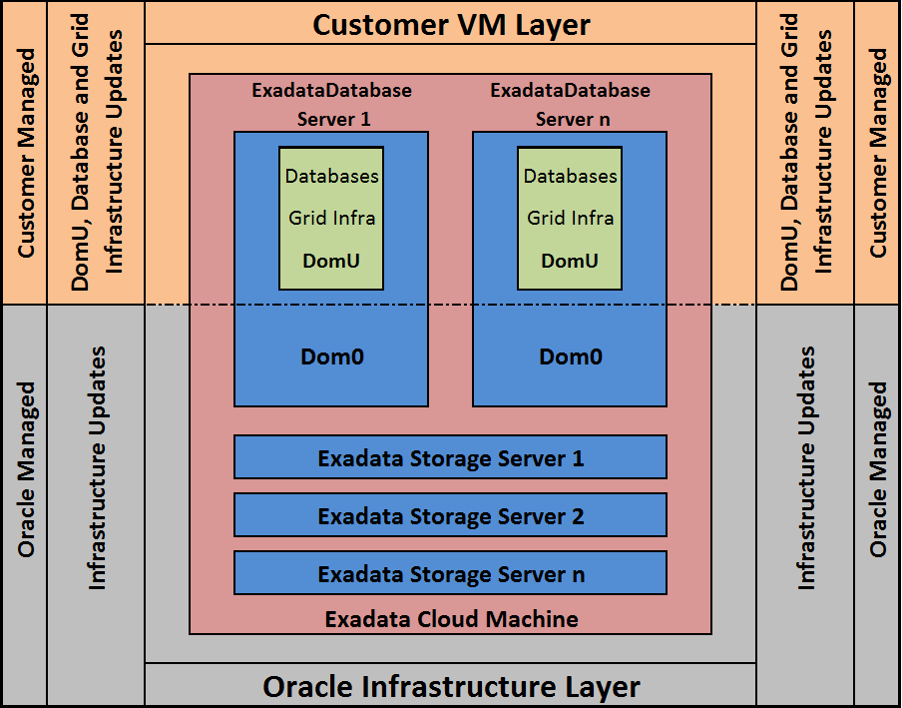
Exadata Cloud customers have access to and are responsible for administration of the VM guests (KVM guest or Xen domU) on the Exadata Database Servers, including the Databases and Grid Infrastructure.
Oracle Cloud Ops is responsible for administration of the physical hardware, including the Exadata Database Servers and their VM servers (KVM host or Xen dom0), Exadata Storage Servers, Switches and PDU’s, and therefore applies all updates to this infrastructure.
Managing Exadata in the Cloud
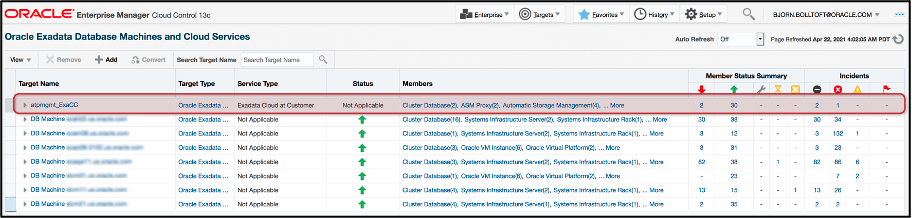
With the introduction of the Exadata Cloud Target in Enterprise Manager 13.4, Exadata Cloud Targets and Exadata Database Machines are integrated together into the Oracle Exadata Database Machines and Cloud Services page available by navigating to Targets->Exadata.
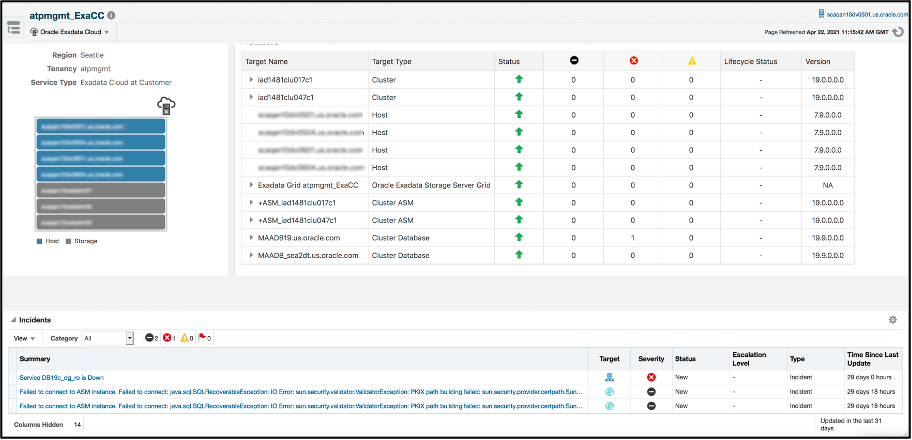
Selecting a specific Exadata Cloud Target will take you to the target home page providing a view of all associated targets.
A simple schematic on the left pane depicts the VM guests in blue and the Exadata Storage Servers in grey
On the right-side pane is a list of all components such as the VM guest hosts, Grid Infrastructure, ASM and databases along with their status, incidents, and versions.
The bottom pane provides details about all incidents with the ability to double-click to drill down and investigate the problem.
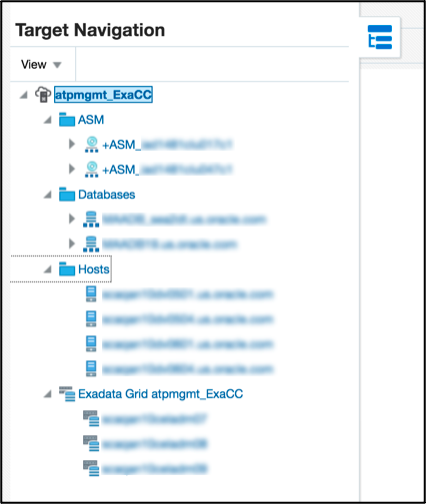
Exadata navigation tree
The Exadata navigation tree provides a hierarchical view of related targets, allowing for quicker navigation to components of the specific Exadata Cloud target. Navigation to another component is as simple as clicking on the target name in the tree.
Exadata Storage Servers and Exadata Storage Server Grid
Exadata Storage Servers are among the main components of an Exadata. Enterprise Manager provides individual targets for each Exadata Storage Server, groups related Exadata Storage Servers together into the Exadata Storage Server Grid target, and associates these targets with the Exadata Cloud target to provide Exadata Cloud customers with the same monitoring and visualization capabilities as with an on-premises Exadata.
To see the Exadata Storage Server Grid overview page, select the Exadata Storage Server Grid in the navigation tree.
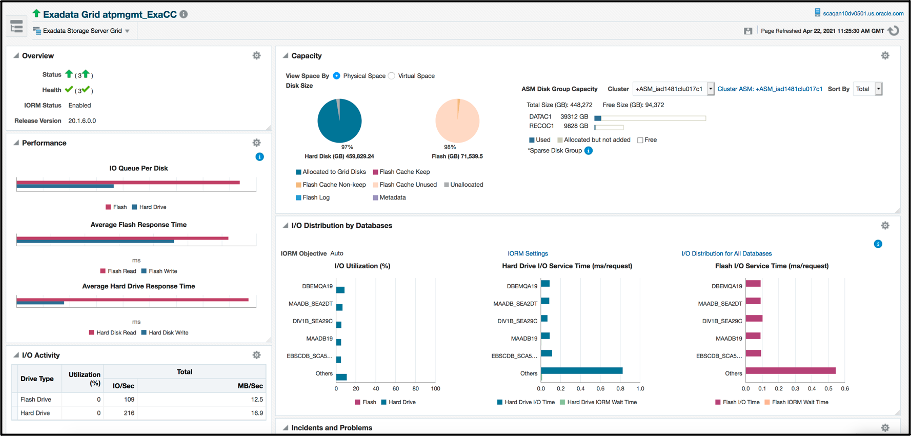
The Exadata Server Storage Grid home page is broken up into several widgets, providing an overview on topics including health status, performance, capacity, and I/O, including details on individual databases and incidents.
Below is a description of the details that can be found on this page.
Starting from the top left side:
The overview widget provides the status and version information
Performance view shows I/O queue, read and write response time for both hard drives and Flash Cache
I/O Activity provides utilization, IO/Sec, MB/ Sec, Information about Infiniband MB/Sec, Smart Scan I/O MB/Sec and Flash Cache Read Hit %
Moving to the top right side:
In the Capacity widget, see both hard drive and Flash Cache capacity, including allocated, used and free space for ASM disk groups
I/O Distribution by Databases widget. This view shows top 5 databases and if there are more than 5 databases, all the smaller databases will be aggregated to a group called others. This view also shows if any database is restricted by IORM. From the top 5 double-click to drill down to the complete list. Additionally, double-click to see more details on IORM settings
The Incidents and Problems widget provides information on I/O related incidents with the ability to drill down into any incident
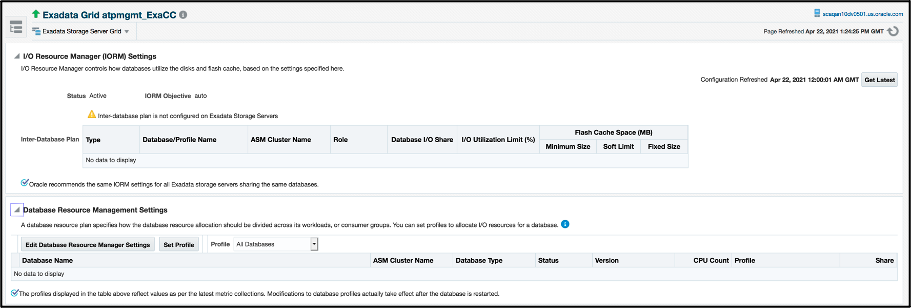
In the I/O Distribution pane, click on the IORM Settings link to access the IORM configuration. This will display the current IORM and Database resource manager settings.
The lower section on this page provides I/O distribution over time. This view shows whether any database has I/O restrictions caused by IORM and when they occurred, as well as I/O utilization and small I/O response time for same timeframe for both hard and flash drives as well as flash cache.
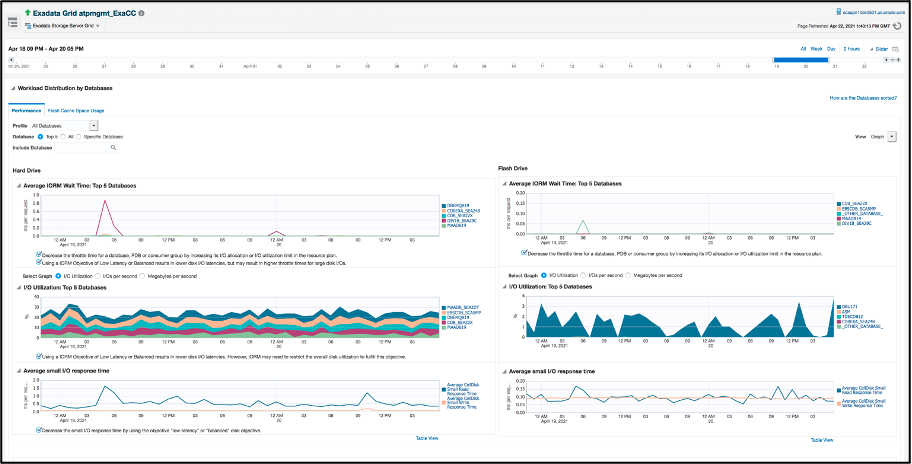
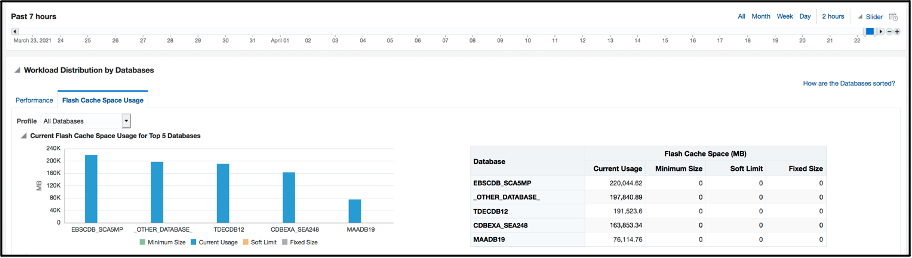
The usage of Flash Cache provides a major performance improvement over only using hard drive. The Flash Cache Space Usage tab contains details on which databases use Flash Cache and how much space is allocated.
Automatic Monitoring and Alerting
The above view shows some monitoring details for the Exadata Cloud environment, but many users are also looking for automatic monitoring and alerting. Enterprise Manger is a platform with advanced automated monitoring and alerting including sending alerts either directly as emails or integrated with third-party ticketing systems.
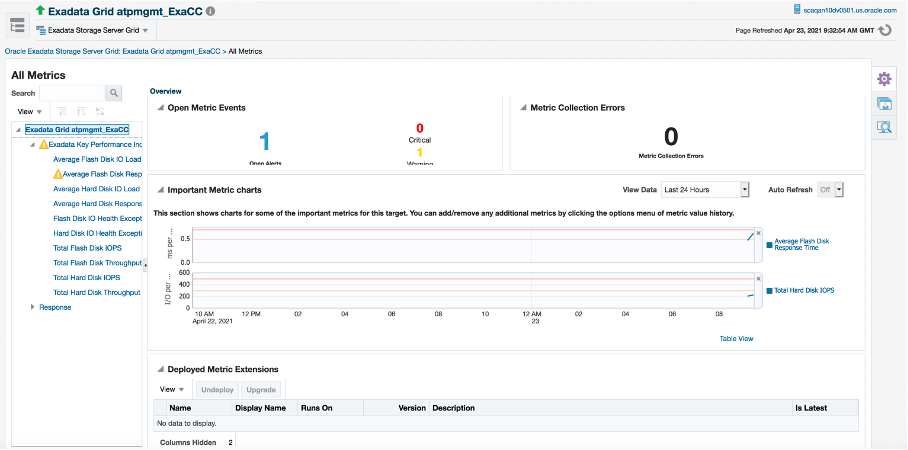
In EM 13.4, we introduced MAA recommended Exadata Key Performance Indicators (KPIs) as first-class metrics, and where applicable made the same metrics available for both Exadata on-premises and Exadata Cloud, such as with Exadata Storage Server and Exadata Storage Server Grid targets. This removes the need to rely on metric extensions to configure KPIs for an Exadata environment.
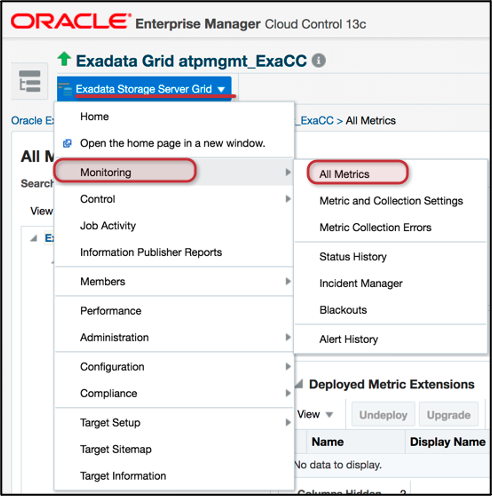
These metrics can be enabled and configured by accessing the Monitoring > All Metrics page from the Exadata Storage Server and Exadata Storage Server Grid targets.
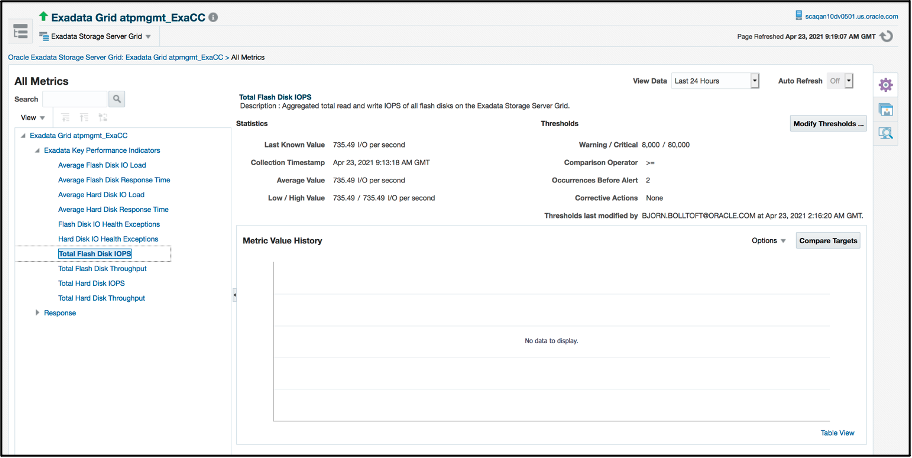
Under the Exadata Key Performance Indicators group, you will find metrics for Load, Response Time, IOPS, Throughput and Health Exceptions for both flash and hard disks.
Discovering the Exadata Cloud Target
The following steps provide a high-level overview of the process to discover the Exadata Cloud target. For more information and detailed instructions please see Discover Exadata Cloud Service
- Install Management Agents on all Exadata Cloud VM guests
- Deploy Exadata plugin to Management Agents
- Discover the following targets before discovering the unified cloud target which is composed of these targets:
- Grid Infrastructure (Cluster) Target
- ASM Cluster Target
- Individual Database Targets
- Create Credential Set
- In order to associate the Exadata Storage Servers with the cloud target, create a named credential for storing the ExaCLI username and password used for connecting to the Exadata Storage Server
- Create a property file with the appropriate details
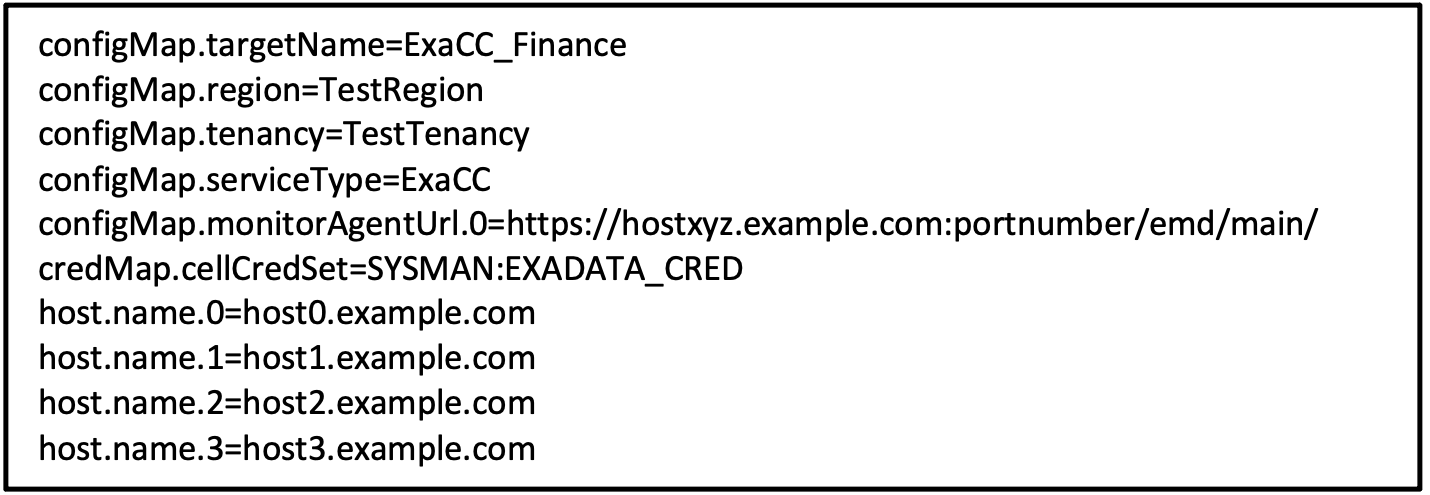
- Run the emcli command

You have now successfully discovered your Exadata Cloud Target and can make use of the monitoring capabilities.
In summary, you now have full hybrid cloud management for Exadata environments, both on-premises and in the cloud, from a single console. Both on-premises and cloud targets can be monitored side-by-side, making the administration of a hybrid environment easier. EM Exadata Cloud Target provides more than monitoring. Exadata Cloud Target capabilities provide a solution to monitor, diagnose, analyze, provision, manage and migrate from any mixed IT use case by scenario, or environment.
Resources:
-
On-demand webinar: Excel with Enterprise Manager: Get the Best Out of Your Exadata Databases
- On-demand webinar: Standardize and Automate Operations on Exadata
- Documentation: Enterprise Manager for Exadata