

Kubernetes can recover from many failures automatically, but undetected issues can still affect application availability, customer experience, and service-level commitments. The operational challenge is turning Kubernetes logs and metrics into consistent alerts that reach the right teams quickly.
The Kubernetes Default Alarms Quick Start helps organizations deploy a configurable baseline of cluster- and workload-level alarms through OCI Marketplace and OCI Resource Manager. It reduces manual setup, improves monitoring consistency, and aligns notifications with platform and application team ownership.
This post explains how the alarm flow works, when to use cluster-level or namespace-level monitoring, and how to deploy the Quick Start.
What the Kubernetes Default Alarms Quick Start delivers
A shared Kubernetes environment can contain hundreds of workloads, several application teams, and multiple operational boundaries. Without a standard approach to alerting, teams can end up with inconsistent thresholds, duplicate alarm definitions, coverage gaps, or notifications that go to the wrong responders.
The Kubernetes Default Alarms Quick Start provides four primary benefits.
A faster path to actionable alerting
The Resource Manager stack creates the alarm resources and supporting configuration from a predefined Terraform package. Teams do not need to build every Monitoring query and alarm definition individually.
Consistent baseline coverage
The Quick Start gives teams a common starting point for detecting frequently encountered cluster and workload conditions.
Team-aligned ownership
Cluster health alarms can be routed to a platform or site reliability engineering team, while workload alarms can be routed to the application teams that own specific namespaces.
Configurable operating thresholds
The baseline is not a fixed policy. Teams can enable or disable individual alarms and adjust their thresholds, evaluation intervals, and severity according to workload criticality and operational practices.
How Kubernetes signals become actionable alerts
The Kubernetes Monitoring Solution in Oracle Log Analytics collects telemetry from the Kubernetes environment, including logs, metrics, and Kubernetes object information. This telemetry provides the context required to understand cluster health, workload state, and container failures.
For log-based conditions, Oracle Log Analytics scheduled-search detection rules periodically evaluate saved searches and post the results as metrics to OCI Monitoring. OCI Monitoring then evaluates those metrics against the alarm threshold and evaluation period.
When an alarm condition is met, the alarm enters the firing state and publishes a message to its configured OCI Notifications topic. Notifications delivers the message to the topic’s active subscriptions, which can represent email recipients or integrations with operational systems.
The operational flow is straightforward:
Kubernetes signal → Log Analytics or Monitoring metric → Monitoring alarm → Notifications topic → Owning team
This connects detection, notification, and investigation without requiring operators to continuously watch a dashboard.
Match alarm scope to team ownership
Shared Kubernetes clusters usually have at least two operational ownership levels:
- The platform team owns the cluster and its underlying capacity.
- Application teams own the health of the workloads running in their namespaces.
The Quick Start reflects this model through cluster-level and namespace-level deployment modes.
Cluster-level alarms
Deploy cluster-level alarms once for each monitored cluster.
These alarms monitor conditions that are generally owned by the platform or SRE team:
- High node CPU usage
- High node memory usage
- Unreachable nodes
- Kubernetes API server 5xx errors
Cluster-level alarms provide a common view of infrastructure and control-plane conditions that can affect multiple applications.
Namespace-level alarms
Use namespace-level alarms for workloads owned by an application team.
The namespace-level baseline includes:
- Deployment replica mismatches
- StatefulSet replica mismatches
CrashLoopBackOffevents- Pods that are not ready
- Failed containers
- Container out-of-memory events
- DaemonSet pods that are not scheduled
This separation helps ensure that an application-specific problem reaches the team that owns the affected workload rather than generating unnecessary noise for the platform team.
Standardize alarms across a team’s namespaces
An application is not always contained in a single namespace.
For example, a checkout team might own the following namespaces:
checkout-apicheckout-workercheckout-jobs
Creating and maintaining a separate stack configuration for every namespace is repetitive. It can also lead to configuration drift when one namespace is updated and another is not.
Instead, the checkout team can create one namespace-level deployment with a namespace group name such as checkout-team. The stack applies the same enabled alarms, thresholds, severity, and notification topic across all namespaces in that group.
The platform team can maintain a separate cluster-level deployment, while other application teams can create their own namespace groups.
For a given cluster and metrics compartment, namespace groups must not overlap. Each namespace should belong to only one alarm group so that ownership and notification routing remain clear.
Before you begin
Complete the following prerequisites before launching the Quick Start.
Deploy the Kubernetes Monitoring Solution
The Kubernetes Monitoring Solution must already be connected to the target cluster and collecting its telemetry. Oracle Log Analytics uses the collected logs, metrics, and Kubernetes object information to provide monitoring and analysis.
Review the required IAM policies
Review and create the IAM policies included with the stack. The user launching the stack must also have permission to create and manage the Resource Manager stack and the resources that the Terraform configuration deploys.
Marketplace stacks can involve resources in multiple compartments, so the deploying user must have the required access in each affected compartment.
Identify the Monitoring cluster name
Use the cluster name exactly as it appears in OCI Monitoring metric dimensions or in the Kubernetes Monitoring Solution.
This value can differ from the Kubernetes cluster display name that you normally use in the OCI Console. Copying the value directly from Monitoring or Log Analytics helps prevent alarms from being created with a dimension that does not match the emitted metrics.
Decide how notifications will be routed
Determine whether the stack should use an existing OCI Notifications topic or create a new one.
When using an existing topic, confirm that it already has the appropriate active subscriptions. When creating a new topic, plan to create and confirm at least one subscription after deployment.
Deploy Kubernetes Default Alarms from OCI Marketplace
1. Locate the Marketplace listing
In the OCI Console, open Marketplace and search for:
Kubernetes Default Alarms
Open the listing to review its description, usage instructions, supported version, and required policies.
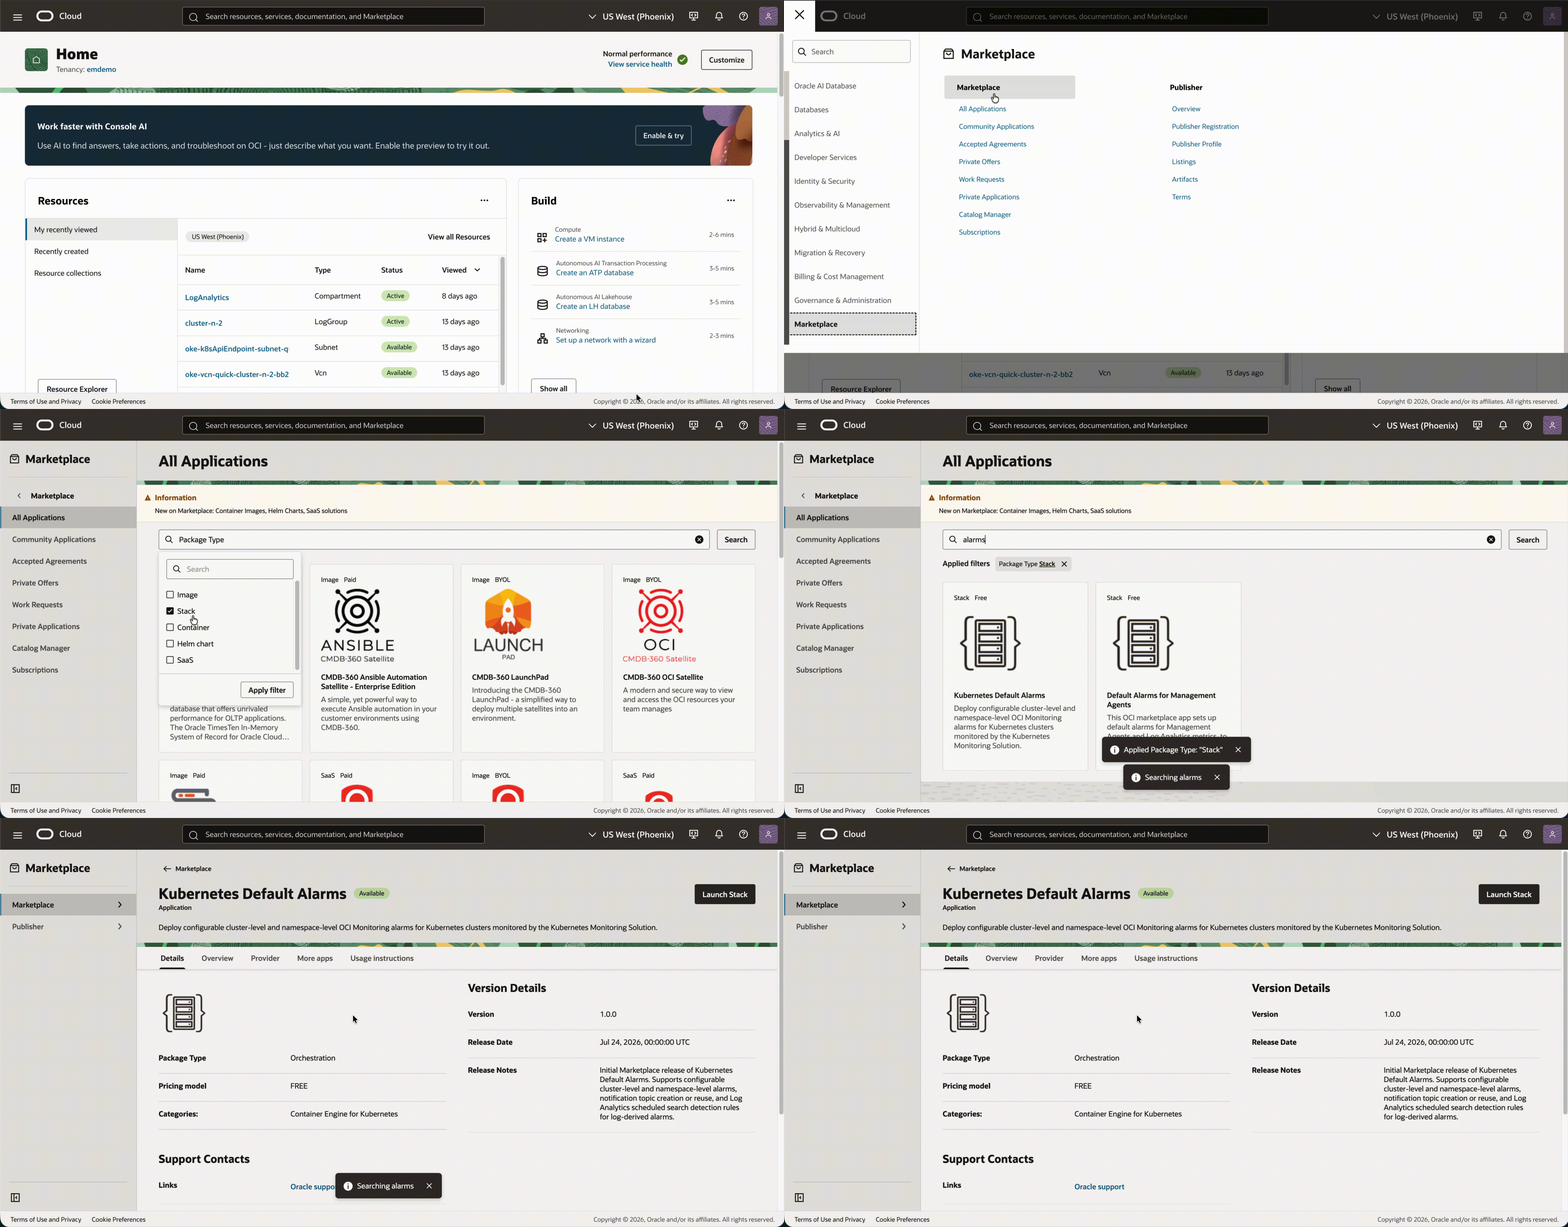
Search OCI Marketplace for Kubernetes Default Alarms
2. Launch the Resource Manager stack
From the Marketplace listing, select Launch Stack.
Choose the compartment in which to create the Resource Manager stack, review and accept the terms of use, and continue to the stack configuration.
Marketplace stack listings are deployed through OCI Resource Manager, which manages the Terraform configuration, state, and deployment jobs.
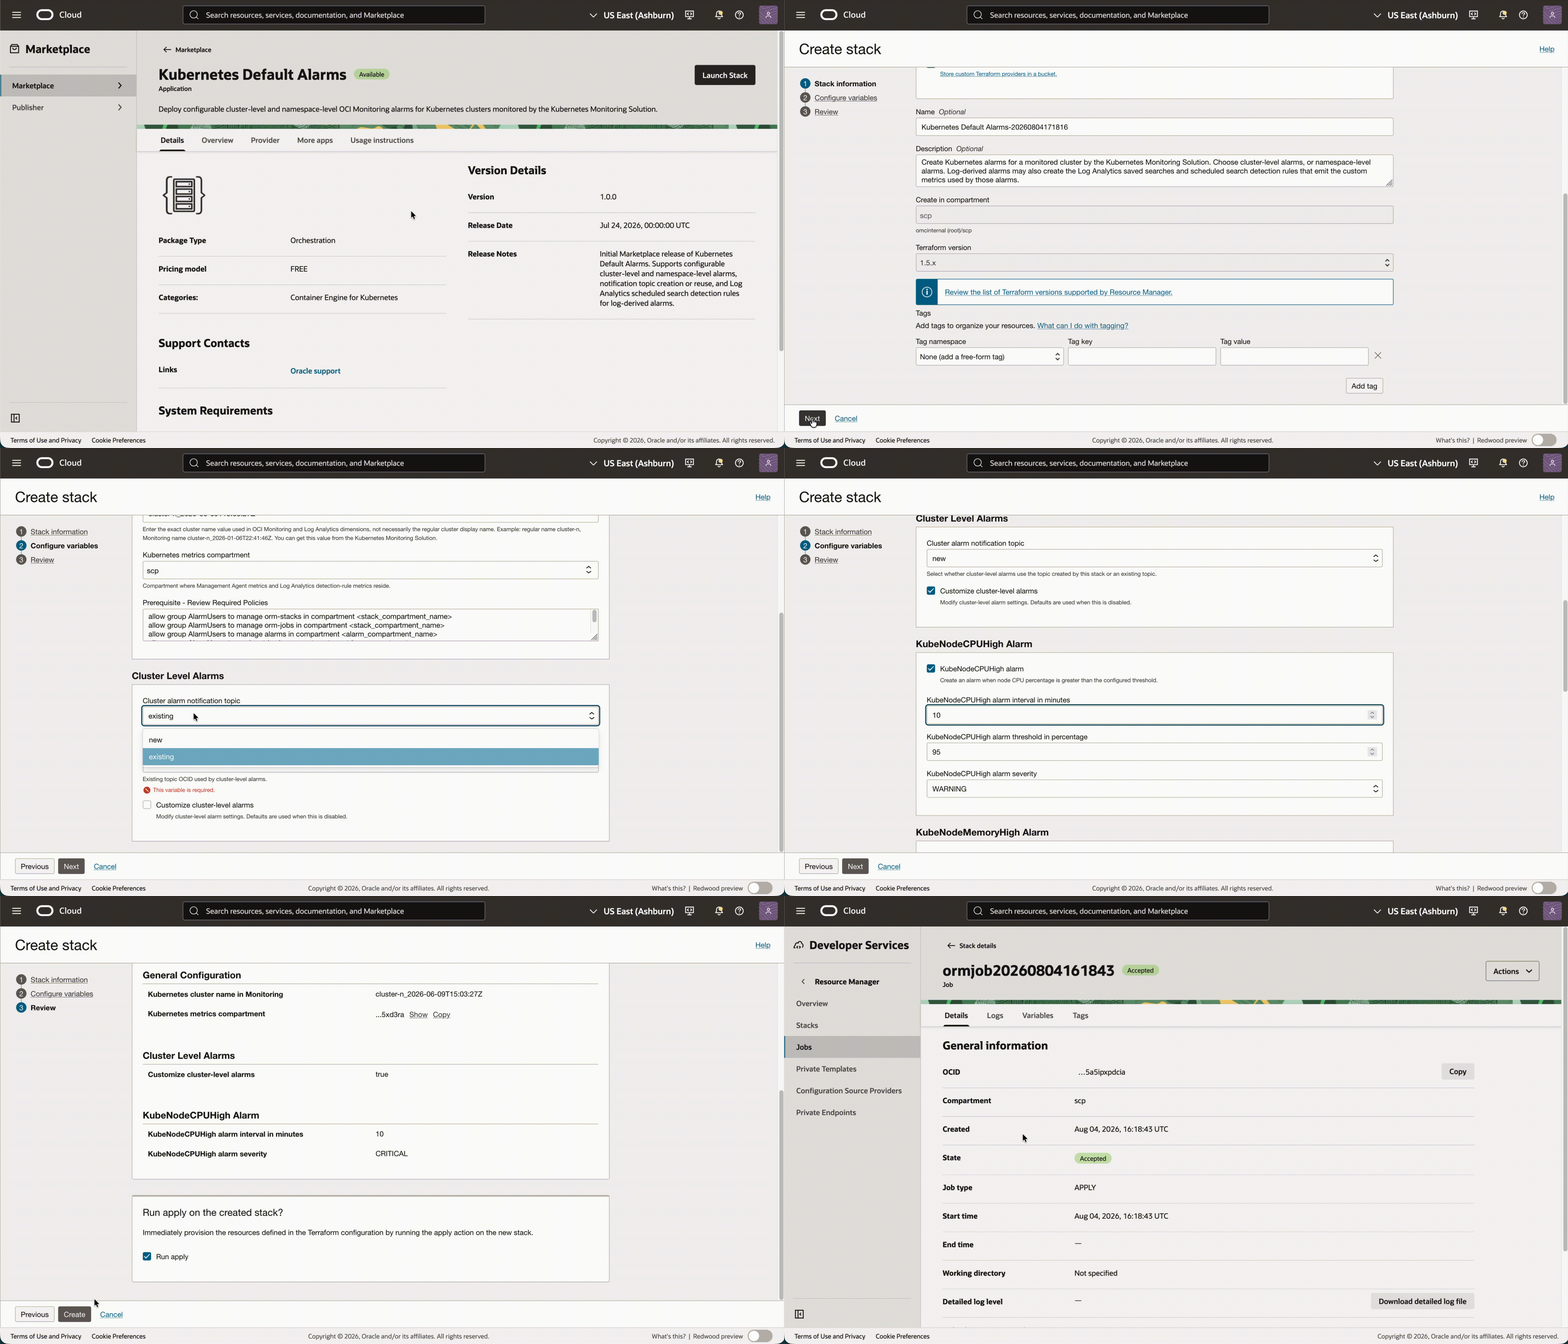
Launch Kubernetes Default Alarms as an OCI Resource Manager stack
3. Select the alarm deployment mode
Choose one of the following modes:
- Cluster-level alarms for cluster infrastructure and control-plane health
- Namespace-level alarms for application workload health
Use cluster-level mode once for each monitored cluster.
Application teams can create separate namespace-level deployments for the namespace groups they own.
4. Identify the target cluster
Enter the exact Monitoring cluster name identified during the prerequisite step.
Select the compartment containing the Kubernetes metrics that the alarms will evaluate.
Verify both values carefully. The cluster name and metrics compartment determine which metric streams the alarm queries monitor.
5. Configure namespace ownership
For namespace-level deployment:
- Enter a descriptive namespace group name, such as
checkout-team. - Enter one Kubernetes namespace per line.
- Verify that none of the namespaces already belongs to another namespace alarm group for the same cluster and metrics compartment.
Use a group name that clearly identifies the owning application or team rather than a temporary project name.
6. Configure notification routing
Select an existing OCI Notifications topic or allow the stack to create one.
Using an existing topic can integrate the new alarms with an established operational channel. Creating a separate topic can provide cleaner routing when a team needs an independent escalation path.
A Notifications topic is the delivery channel, while subscriptions identify the endpoints that receive messages published to that topic.
7. Review and customize the alarm baseline
Review the alarms that are enabled for the selected deployment mode.
For each configurable alarm, evaluate:
- Whether the alarm should be enabled
- The triggering threshold
- The evaluation interval
- The alarm severity
- The destination notification topic
Start with the provided baseline, but consider the normal operating characteristics of the cluster or workloads. For example, a batch-processing namespace may have different restart or resource-usage patterns than a latency-sensitive production service.
8. Run the Terraform plan
Create the stack and run Plan from the Resource Manager stack details page.
Review the plan before applying it. Confirm that the plan will create the expected:
- Alarm definitions
- Log Analytics detection rules, where applicable
- Notification topic, when requested
- Supporting resources and configuration
The plan provides an opportunity to catch an incorrect cluster name, metrics compartment, namespace group, or notification topic before resources are deployed.
9. Apply the stack
After reviewing the Terraform plan, run Apply.
Resource Manager creates the selected alarms and supporting resources. Monitor the Apply job until it completes successfully.
10. Verify the alarm definitions
After deployment, open Observability & Management, select Monitoring, and then open Alarm Definitions.
Confirm that:
- The expected alarms were created
- The alarm queries reference the correct cluster and namespaces
- The configured severity and thresholds are correct
- Supporting resources and configuration
- Each alarm uses the intended Notifications topic
- The alarms are enabled
Validate the complete notification path
Creating an alarm is only part of the setup. The notification path must also be operational.
If the stack created a new Notifications topic, add at least one subscription. Subscription types that require confirmation remain in the PENDING state until the recipient or endpoint completes the confirmation process. After confirmation, the subscription changes to ACTIVE.
Complete the following validation:
- Open the Notifications topic associated with the alarms.
- Confirm that it contains at least one active subscription.
- Verify that the subscription points to the correct team or operational integration.
- Review the Log Analytics detection rules created for log-based conditions.
- After a controlled or known event, review the alarm history and confirm that the notification reached the expected destination.
For alarms generated from Log Analytics detection rules, operators can use alarm history and Log Explorer to investigate the log activity associated with a firing alarm.
What teams gain
The Kubernetes Default Alarms Quick Start creates more than a collection of alarm definitions. It provides a repeatable operating model for Kubernetes alerting.
Platform teams gain a consistent cluster-health baseline. Application teams gain workload alarms aligned with the namespaces they own. Shared namespace-group configuration reduces repetitive administration and helps prevent configuration drift.
Most importantly, Kubernetes telemetry is connected to a defined notification path. When a condition requires attention, the alert can reach the responsible team without depending on someone to notice a dashboard change.
From observability to operational response
Observability is not only about investigating an incident after it occurs. It is also about recognizing warning signs early enough for the right team to respond.
Oracle Log Analytics and the Kubernetes Monitoring Solution provide the logs, metrics, and Kubernetes context behind those warning signs. The Kubernetes Default Alarms Quick Start turns them into a consistent and configurable alarm baseline for platform and application teams.
Start with the provided defaults, validate the notification path, and then tune the alarm configuration according to workload criticality and normal operating behavior.
That creates a practical path from Kubernetes signals to operational action.