

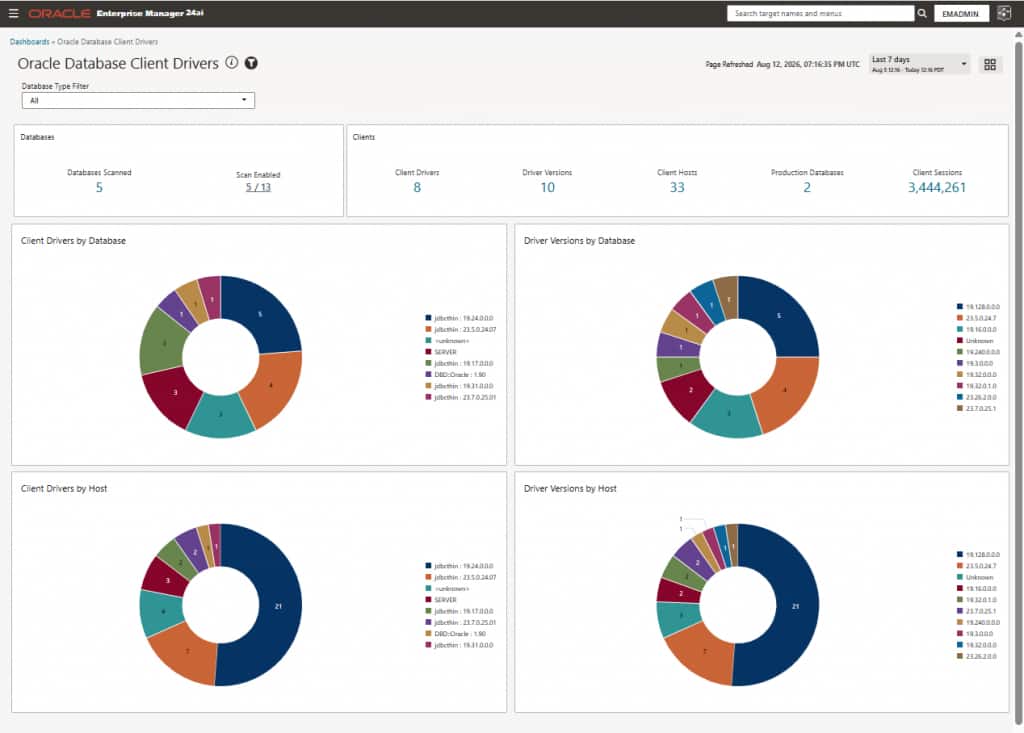
Oracle Database connections come from applications that rely on Client Drivers and Oracle Client Libraries, yet most organizations lack a complete view of these drivers across their database fleet. Oracle Enterprise Manager 24ai Release Update 11 addresses this gap with the new Oracle Database Client Drivers dashboard, which provides a centralized, interactive view of Client Driver usage captured through regularly collected snapshots. The dashboard brings together Client Drivers and their dependent Oracle Client Libraries with the associated session details, the hosts where the client applications run, and the databases they connect to.
Understanding Client Drivers and connectivity patterns across an enterprise database environment is essential for upgrade planning, security compliance, investigating client-server compatibility, and application modernization. Until now, gathering this information often required querying individual databases and manually consolidating the results, which is a time-consuming and error-prone process.
The Oracle Database Client Drivers dashboard eliminates that effort by providing a centralized, snapshot-based view of client connectivity and driver usage across monitored databases. Rather than manually investigating individual databases to determine which applications use specific client drivers or versions, administrators can view this information in one dashboard. It combines high-level fleet summaries with detailed, filterable views to help teams identify commonly used drivers, usage patterns for outdated drivers, sources of client connections, and the most frequently accessed target databases. Each summary metric, chart, and chart legend can be selected to drill into the underlying data, allowing administrators to move from an enterprise-wide overview to driver, host, database, and associated session-level details in just a few clicks.
Enabling Client Driver Tracking
The Oracle Database Client Drivers dashboard relies on the DB Client Version Monitoring metric. Enable this metric across your databases to begin collecting client driver data.
Each collection captures a snapshot of client sessions connected at that time. Because client connections can vary throughout the day, Oracle recommends starting with the default collection interval of every 6 hours. However, if you have applications that are short-lived, you may consider temporarily increasing the collection frequency on the specific target databases to capture a snapshot of these short-lived applications.
You can configure the metric’s collection schedule using the standard Enterprise Manager methods: emcli modify_collection_schedule, the Metric and Collection Settings UI, or Monitoring Templates.
Viewing Client Driver Data
The dashboard is built from periodically collected snapshots, so the selected dashboard time range determines which collected data is displayed. Choose a time range that includes multiple completed metric collections. For example, when collections run every hour, a time range of Last 24 hours or longer typically provides comprehensive coverage. When collections run every 6 hours, select a time range broad enough to include the relevant collection points, such as Last 7 days or longer. If you want to view data for a time range of more than 3 months, extend the default retention period of 3 months to a longer timeframe. Refer to the documentation for details on changing data retention periods.
Understanding Your Database Clients
Before using the dashboard, verify that client driver tracking is enabled across your databases. The Scan Enabled metric helps to identify whether you have full coverage or whether the metric needs to be enabled on additional databases.
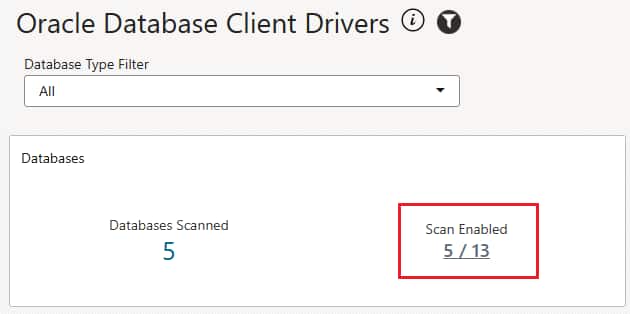
Next, use the dashboard to answer fundamental questions about the database clients in use:
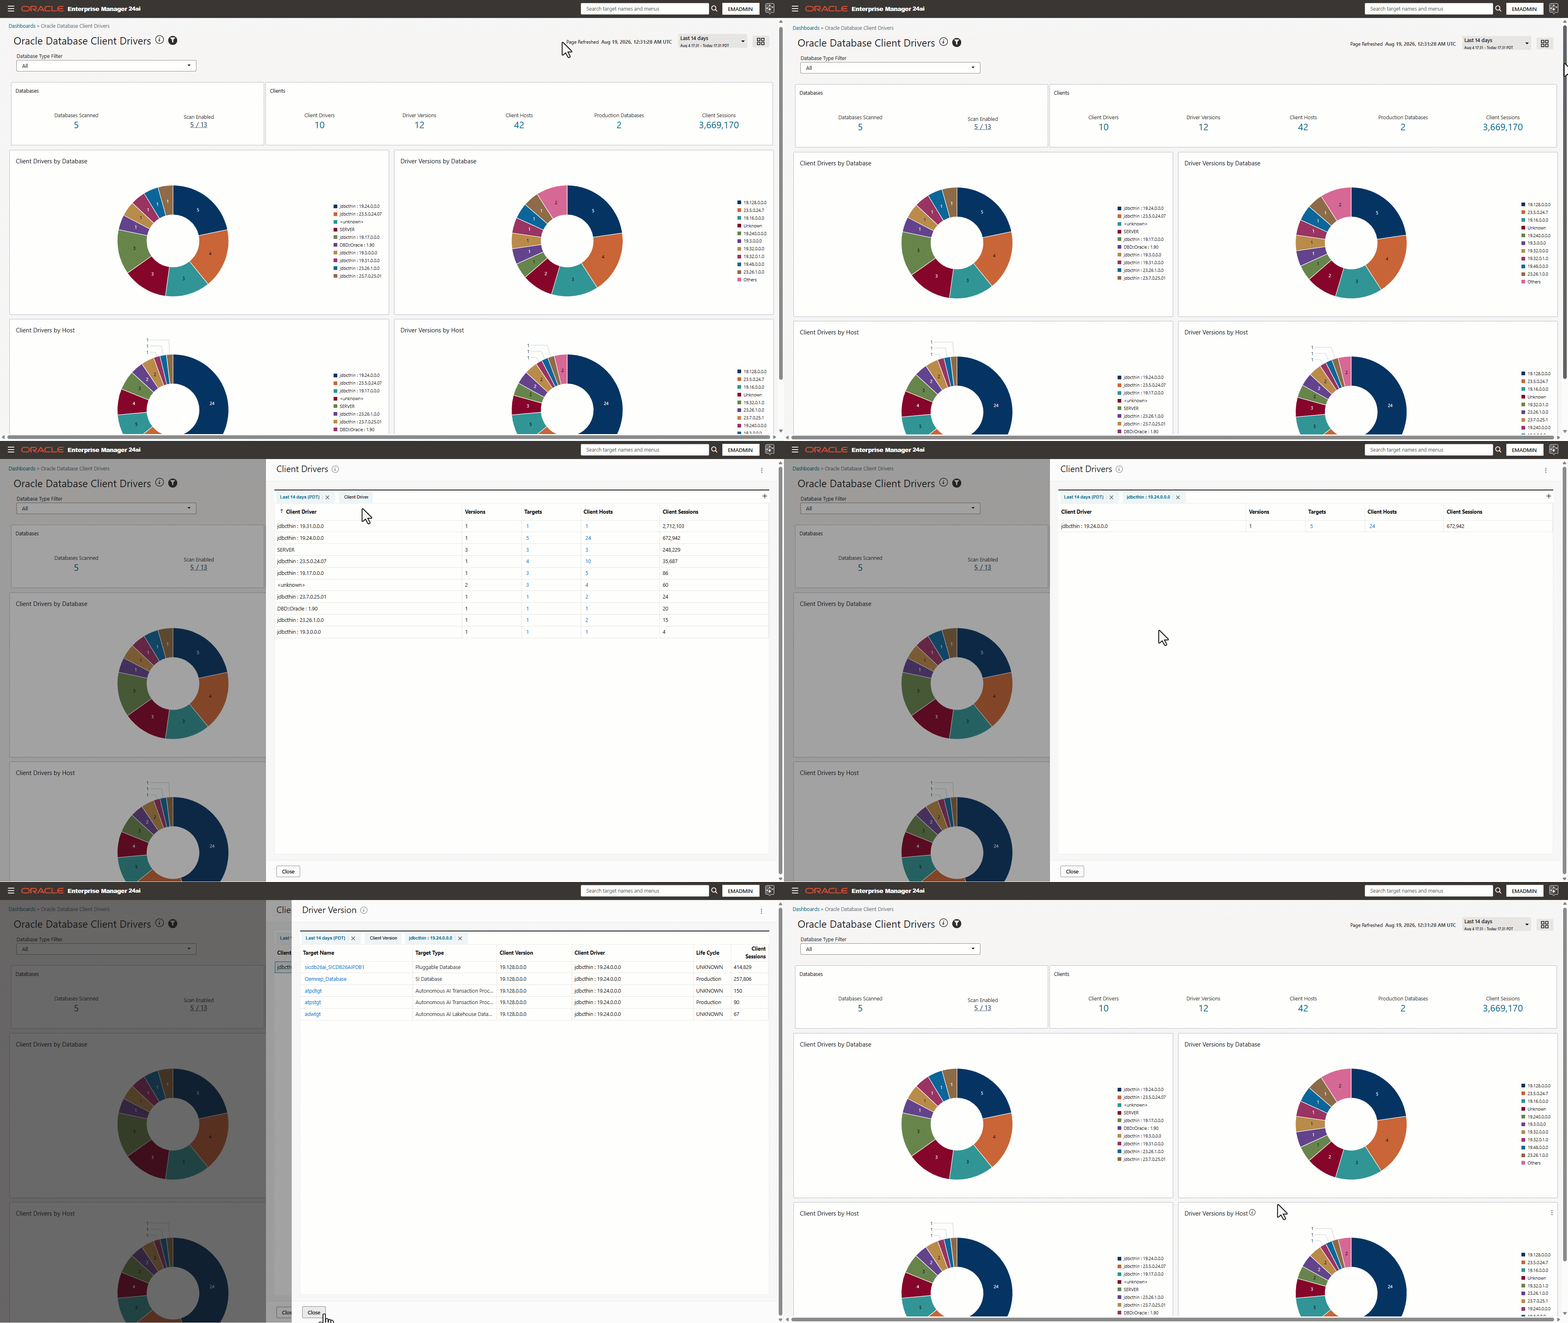
- How many different client drivers are in use? Check the Client Drivers summary count, then drill down to view the individual client drivers.
- How many different client library versions are in use? Check the Driver Versions summary count, then drilldown to view individual versions.
Both summary counts provide drill-down access to client drivers and associated client libraries, along with target databases, application hosts, and associated client session details.
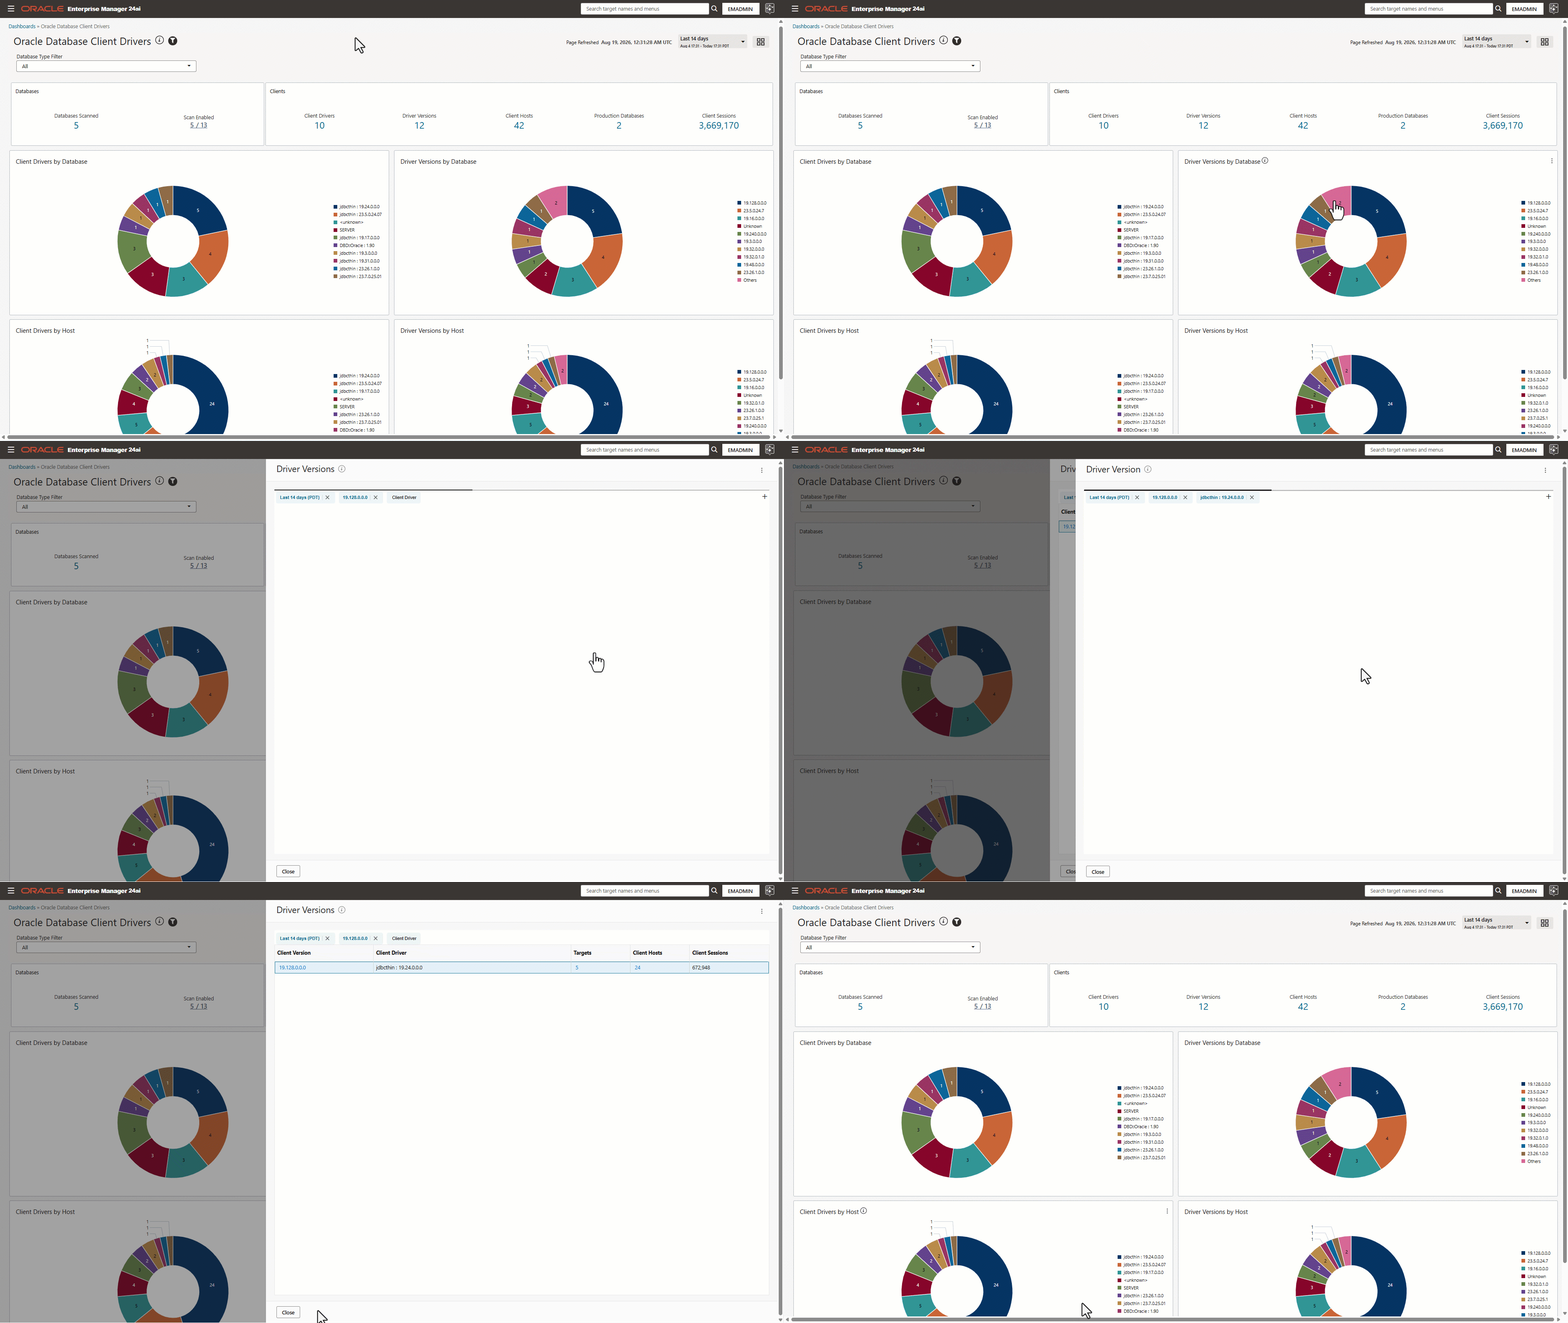
Use the 4 pie charts (Client Drivers by Database, Client Drivers by Host, Driver Versions by Database, and Driver Versions by Host)to understand both database and host footprint for client drivers and libraries. These charts provide quick answers to the following questions:
· Which client drivers or libraries connect to the most target databases?
· Which client drivers or libraries are most widely deployed across application hosts?
Click a pie slice in the relevant chart to drill down to the corresponding list of specific drivers and associated libraries, the target databases they connect to, and the application hosts on which they are deployed.
The dashboard is integrated with the Enterprise Manager privilege model, so users see only data for database targets they are authorized to access.
Planning Oracle Database Upgrades
Before upgrading an Oracle Database, use the dashboard to review the client drivers and libraries captured across the fleet. Drill down to view the target databases and application (client) hosts associated with each client component, then identify the components connected to databases in your upgrade scope.
For production databases, the Production Databases metric provides an additional starting point. Click on the metric to view these databases and their corresponding summary counts for client versions, client hosts, and client sessions. Click on client hosts to see the hosts on which the client drivers and libraries are deployed. This helps teams understand which client drivers and client libraries may be affected, validate compatibility, and coordinate required updates with application owners before the database upgrade begins.
Find and Remediate Outdated Client Components
Review the complete list of client drivers and libraries to identify older versions that require attention. Once identified, drill down on a specific client driver or library version to see the associated target databases and application hosts where those components are deployed. Use the Client Sessions and host counts to distinguish frequently used, widely deployed, or both components from those with limited use. This helps teams prioritize remediation and coordinate upgrades with application owners.
Support Application Modernization and Standardization
Review the mix of client drivers and libraries across application hosts and target databases to identify older or inconsistent versions. Use the drill-down details to understand where each version is deployed and which target databases are associated with it. This helps teams prioritize standardization efforts and assess the application databases that may be affected by planned application changes.
Extending Enterprise Manager Visibility to Database Clients
Oracle Enterprise Manager provides comprehensive visibility into the health and performance of Oracle Databases. With the Oracle Database Client Drivers dashboard, that visibility now extends to the application clients connecting to those databases. By bringing client drivers, Oracle client libraries, application hosts, target databases, and associated session details together in one interactive, snapshot-based view, the dashboard helps teams plan database upgrades, remediate outdated client components, standardize client software, and support client-server compatibility investigations. It gives database and application teams a shared view of the client components connecting across the enterprise.