Guest Authors: Charles Ju, Engineer 5, Technology Operations, Comcast and Nirup Sama, Engineer 3, Software Development & Engineering, Comcast
Comcast is a leading global media and technology company providing connectivity, entertainment, sports, news, and experiences to hundreds of millions of customers worldwide. Our DBA team at Comcast has deployed a robust and highly available Oracle Enterprise Manager (EM) infrastructure to provision, patch, monitor, and support our large Oracle Database DBaaS operations. To monitor our Enterprise Edition MySQL databases, we decided to use EM to leverage its highly reliable infrastructure instead of setting up a separate MySQL Enterprise Monitor (MEM) infrastructure.
In this blog, we share our solution of using Metric Extensions to monitor and alert when InnoDB Cluster member nodes are offline or ejected.
A typical MySQL InnoDB Cluster consists of at least three separate MySQL Server nodes. The MySQL InnoDB Cluster uses MySQL Group Replication technologies to provide virtually synchronous replication among cluster member nodes, along with built-in conflict detection or handling and consistency guarantees across all cluster nodes. It also provides features such as automatic membership management, fault tolerance, automatic failover, and so on.
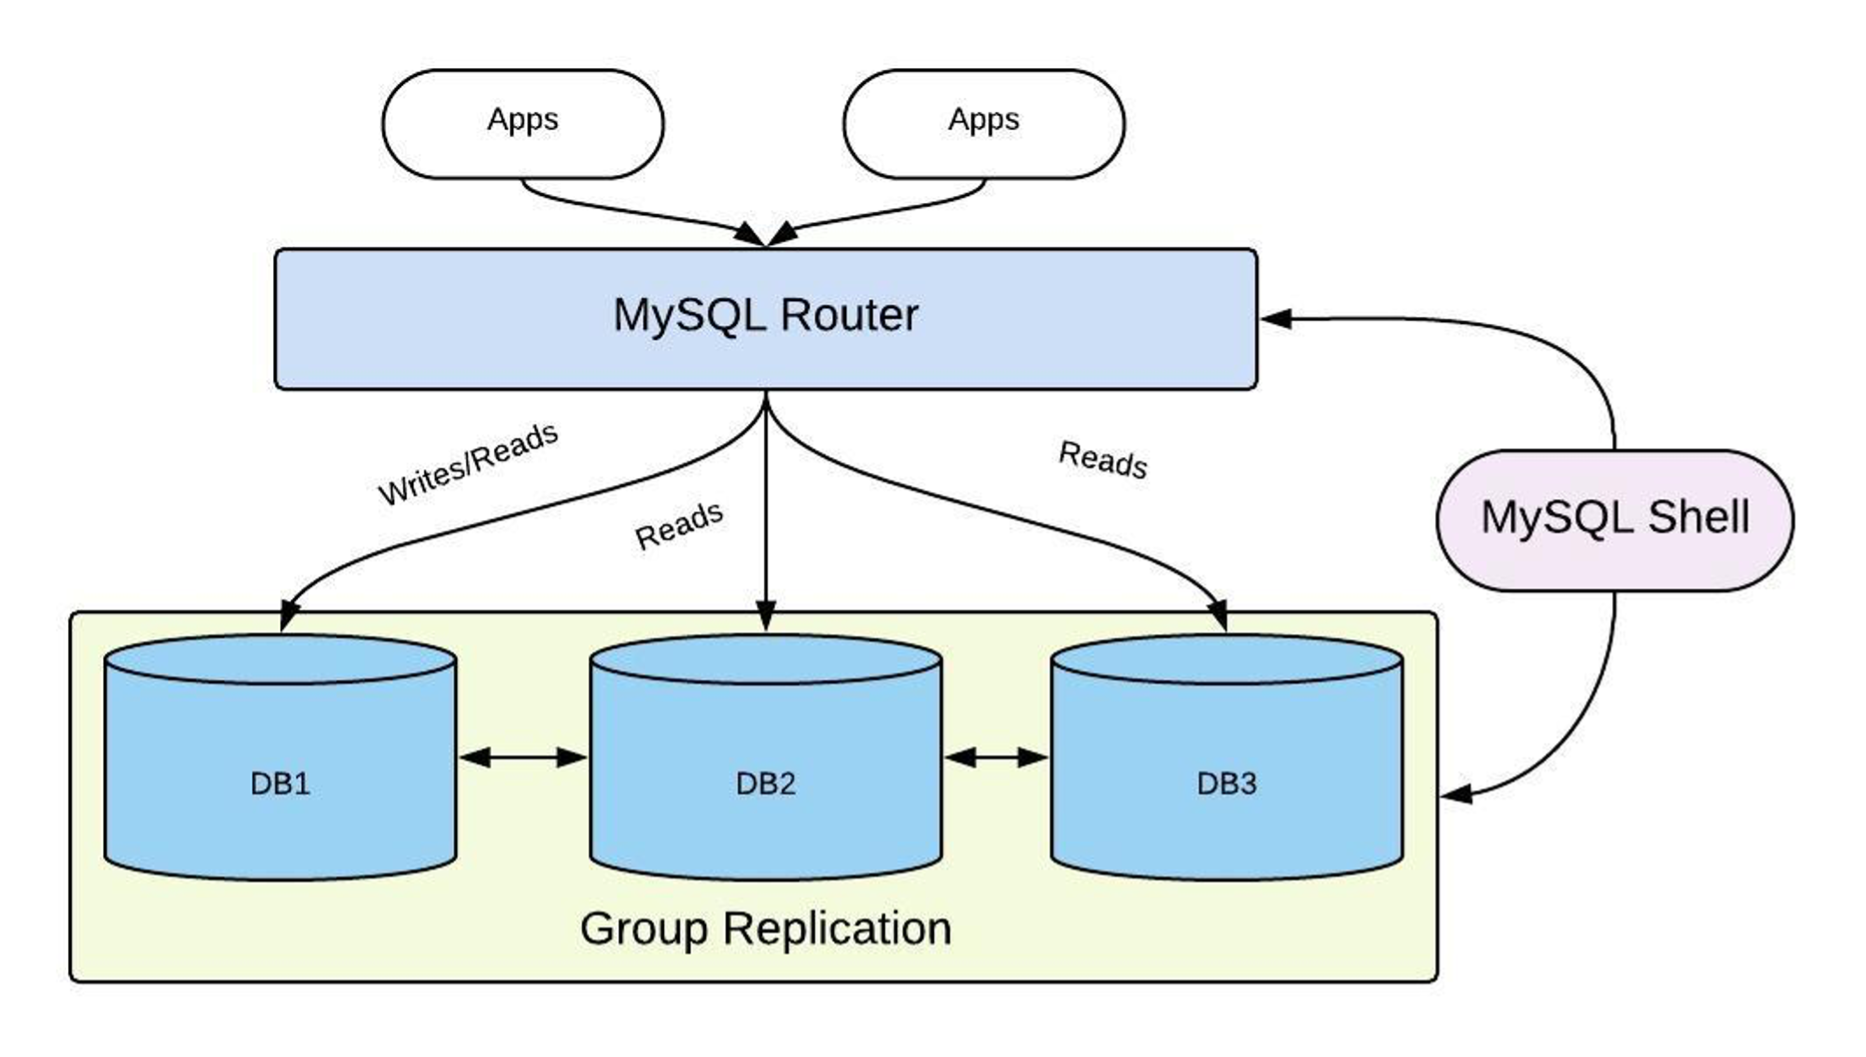
Occasionally, due to various reasons such as network issues, the MySQL InnoDB Cluster member nodes may not be able to communicate with other member nodes within a specific window of time. This may result in an InnoDB Cluster member node getting ejected. Our DBA team wants EM to detect such issues and send alerts to the DBA team, so that corresponding remediation actions can be taken as soon as possible. EM for MySQL does not currently provide this monitoring capability, thus, we developed our own metric extensions to capture such InnoDB Cluster issues.
How Comcast created a metric extension for MySQL InnoDB Cluster
First, we created a custom script to detect the InnoDB Cluster member node status. The logic of the custom script is described below:
The following pseudocode is used to detect an InnoDB Cluster member node status. If a member node status is OFFLINE, it means it has been ejected from the MySQL InnoDB Cluster.
ClusterMemberState=Get-InnoDBCluster-Member-State

if [ -z "$ClusterMemberState" ]
then
    if [[ -s /tmp/temp_master_status ]];then
        echo "ONLINE"
    else
        echo "OFFLINE"
    fi
else
    echo "$ClusterMemberState"
fi
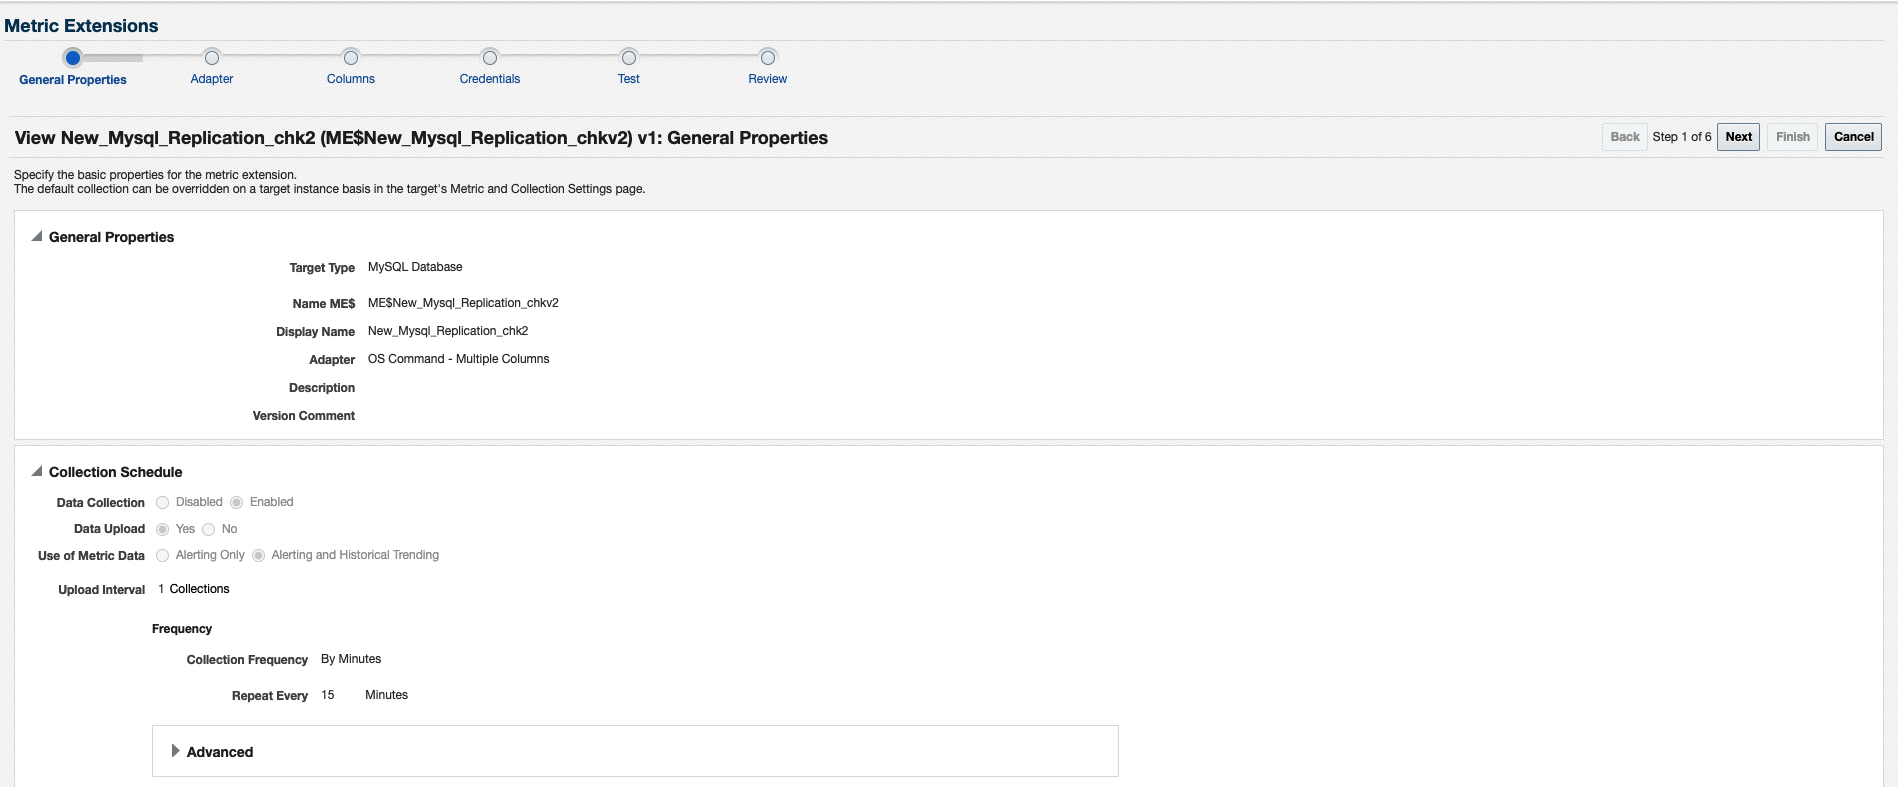
Next, we used EM to define a metric extension using our custom script. In the first page of the metric extension definition, we chose the MySQL Database target type, OS Command adapter, and set a collection schedule of every 15 minutes.
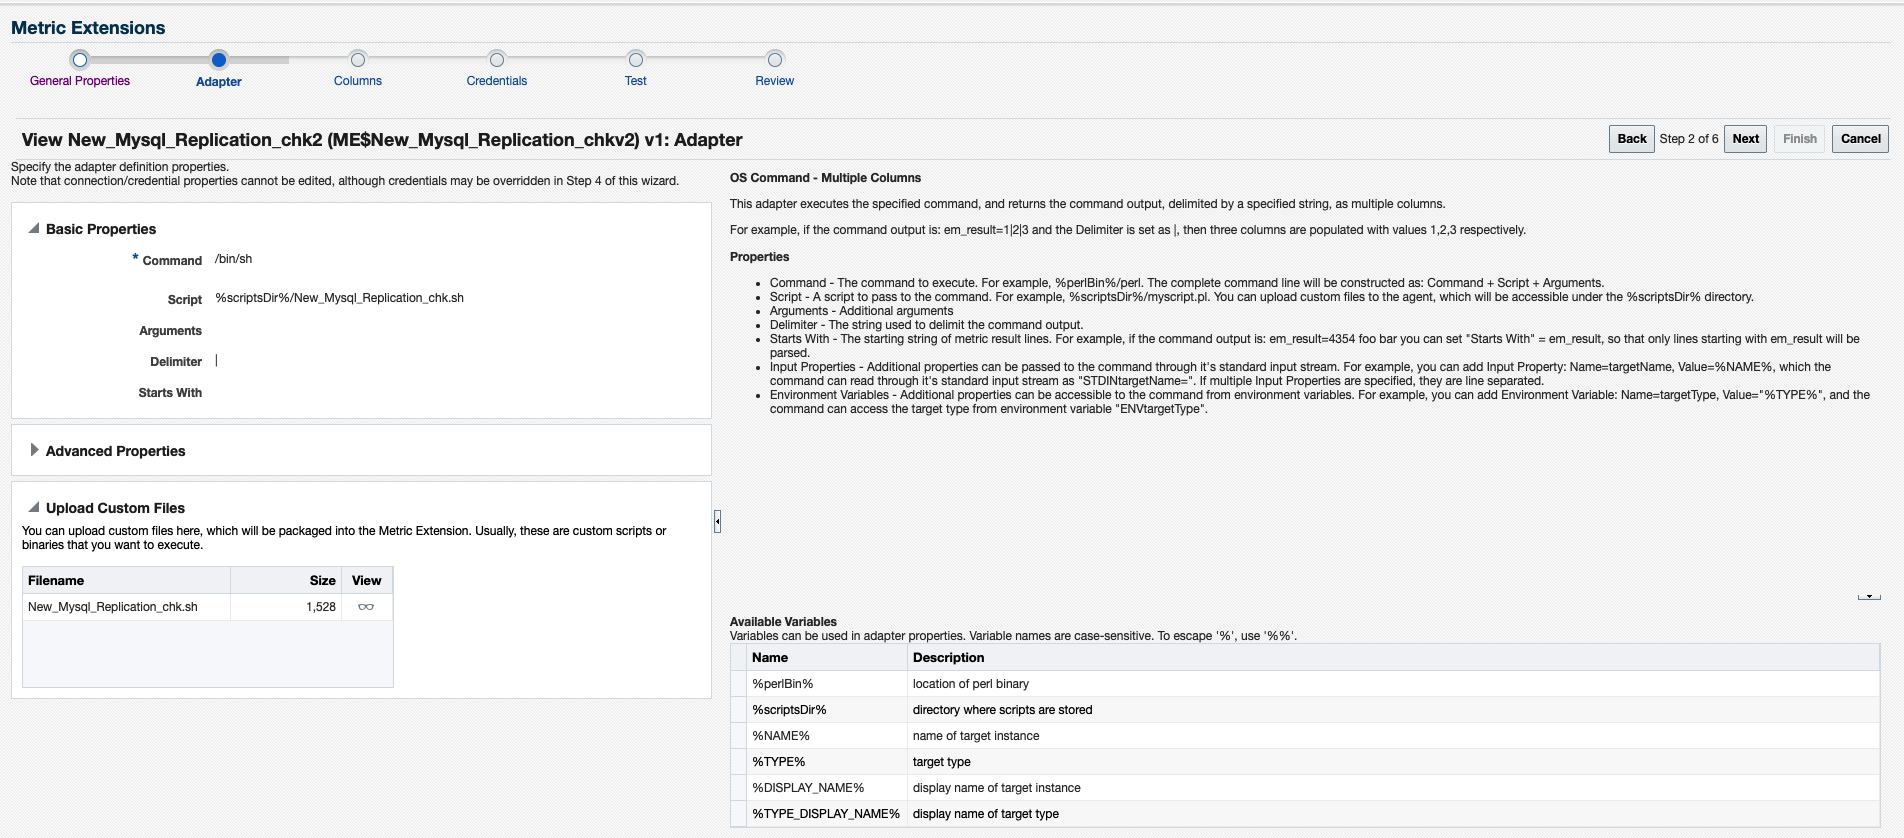
In the second step, we uploaded our custom script into the metric extension.
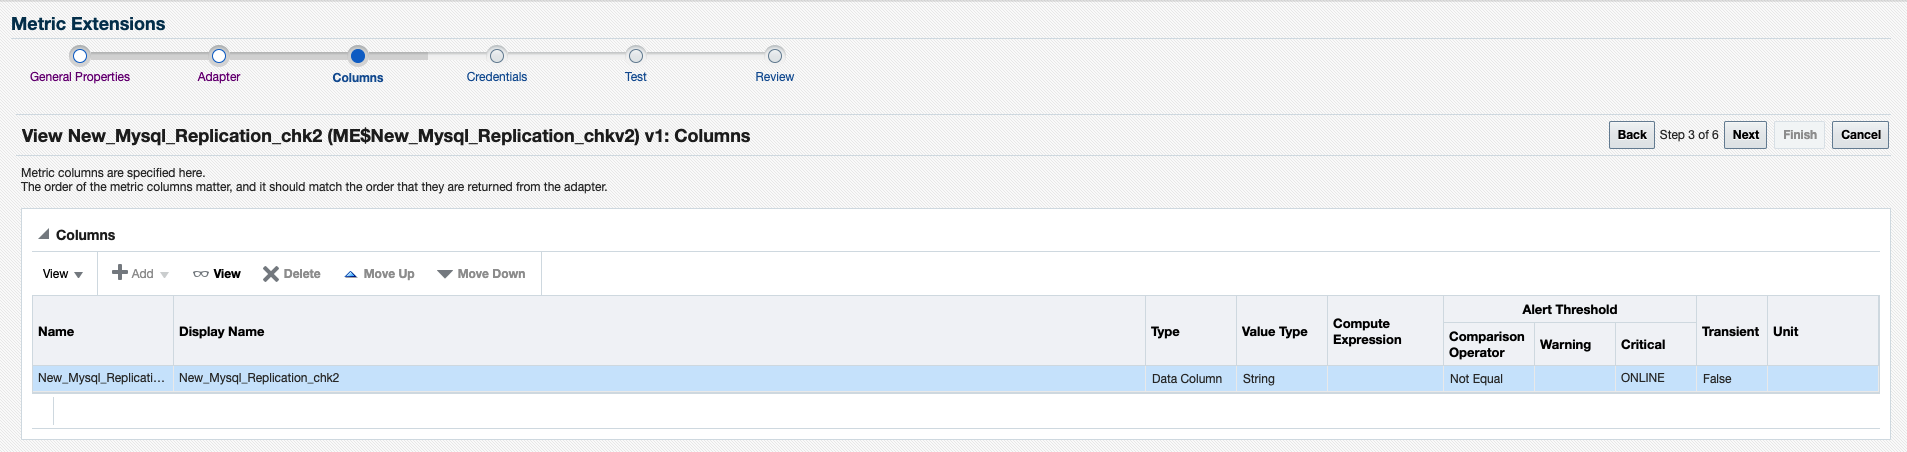
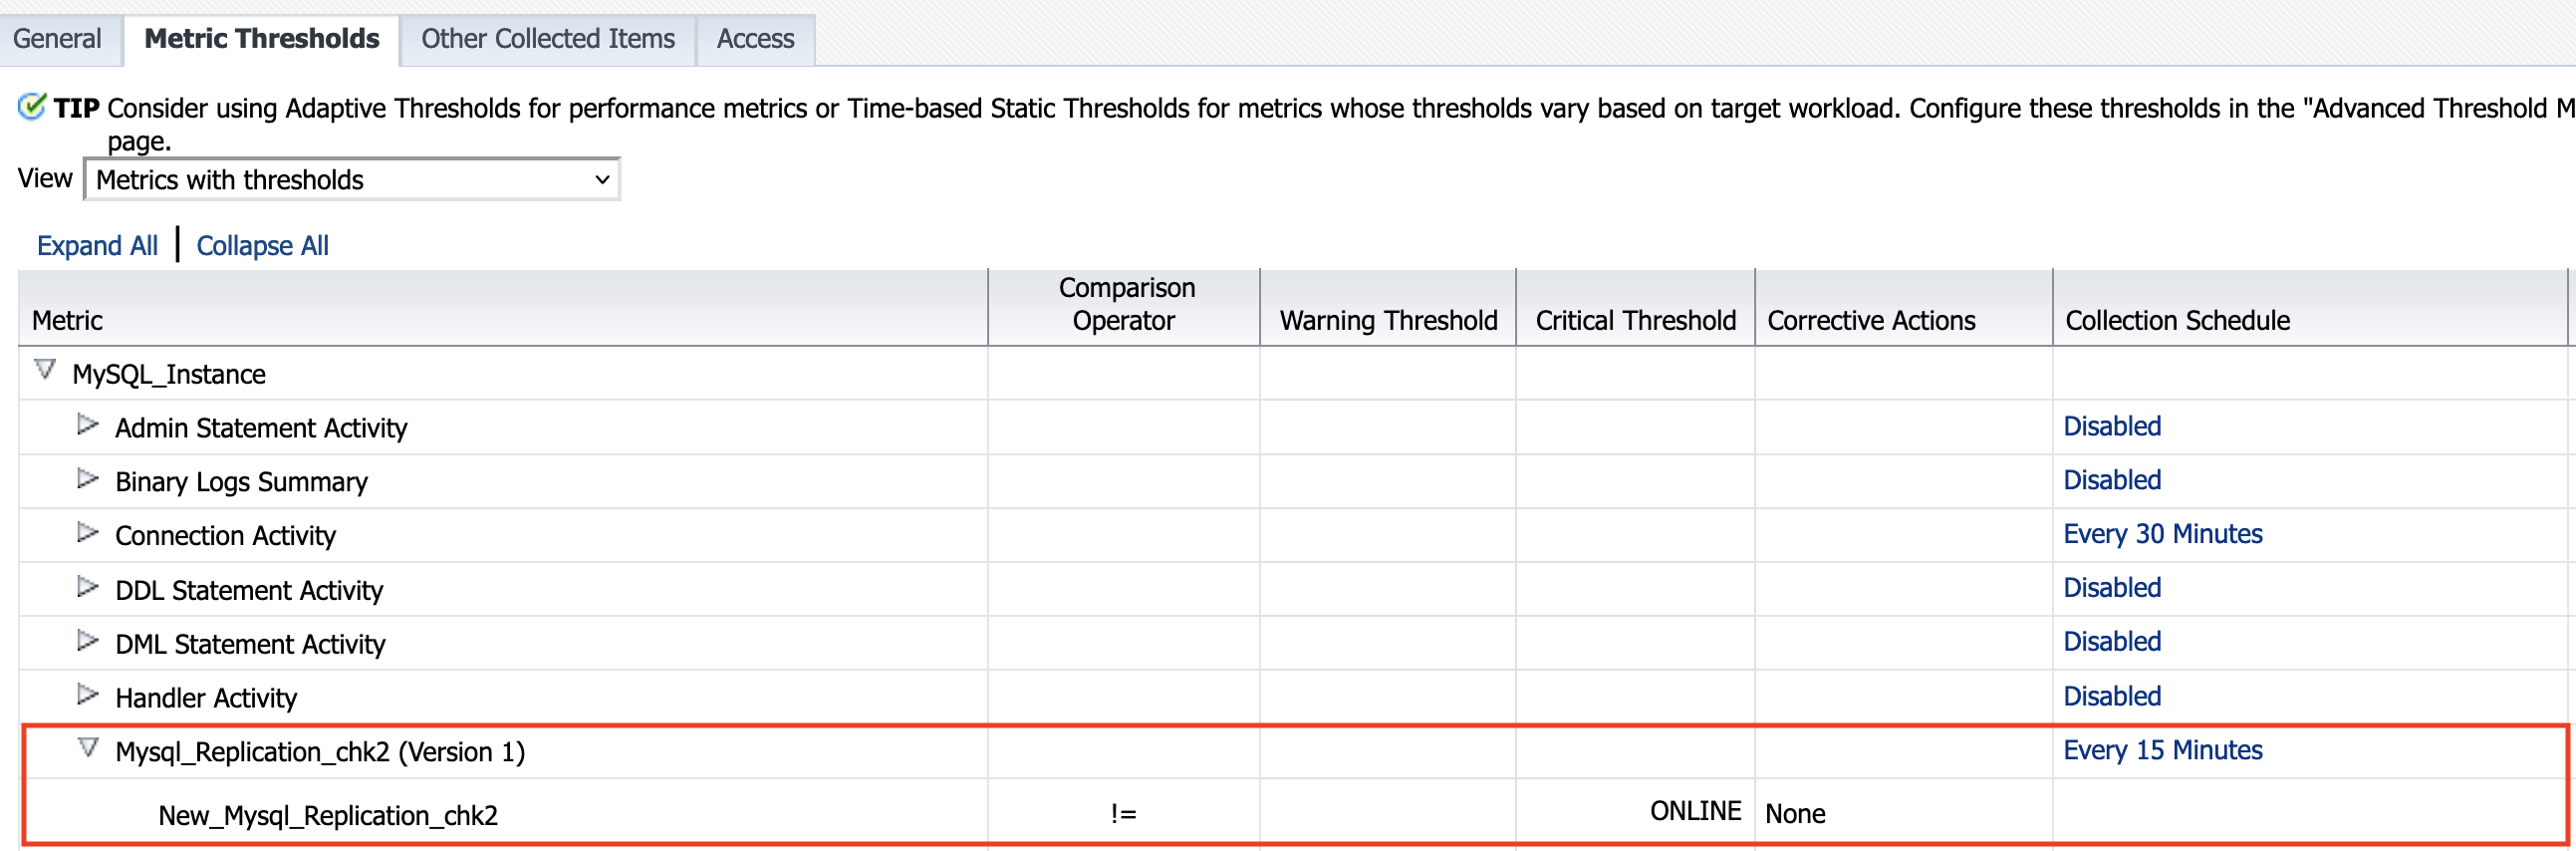
In the third step, we created a new metric column to contain the InnoDB member node status returned from the script. The node status will either be ‘ONLINE’ or ‘OFFLINE’. We specified a critical alert to trigger when the node status is not online.
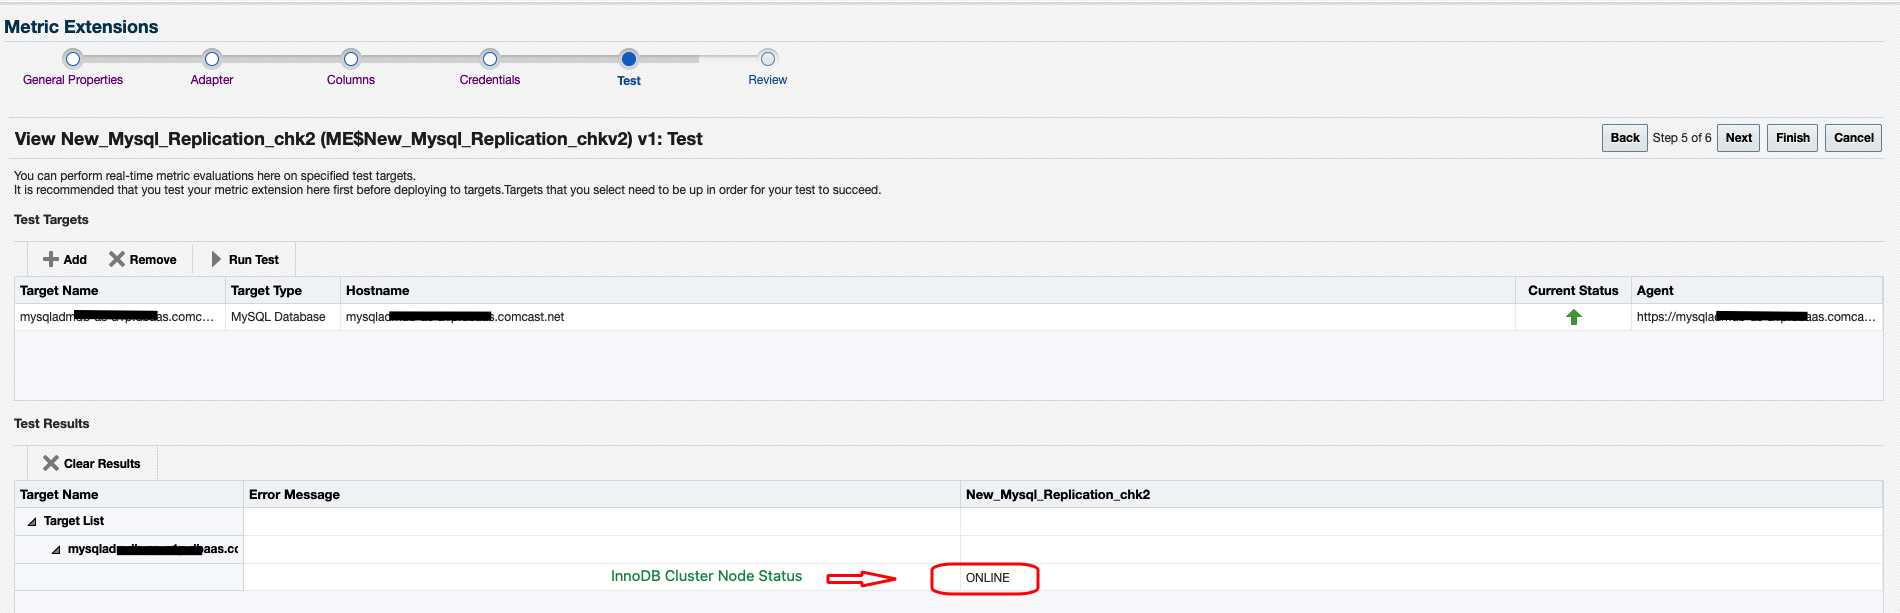
We tested our metric extension against an existing target to confirm the script was returning the correct member node status.
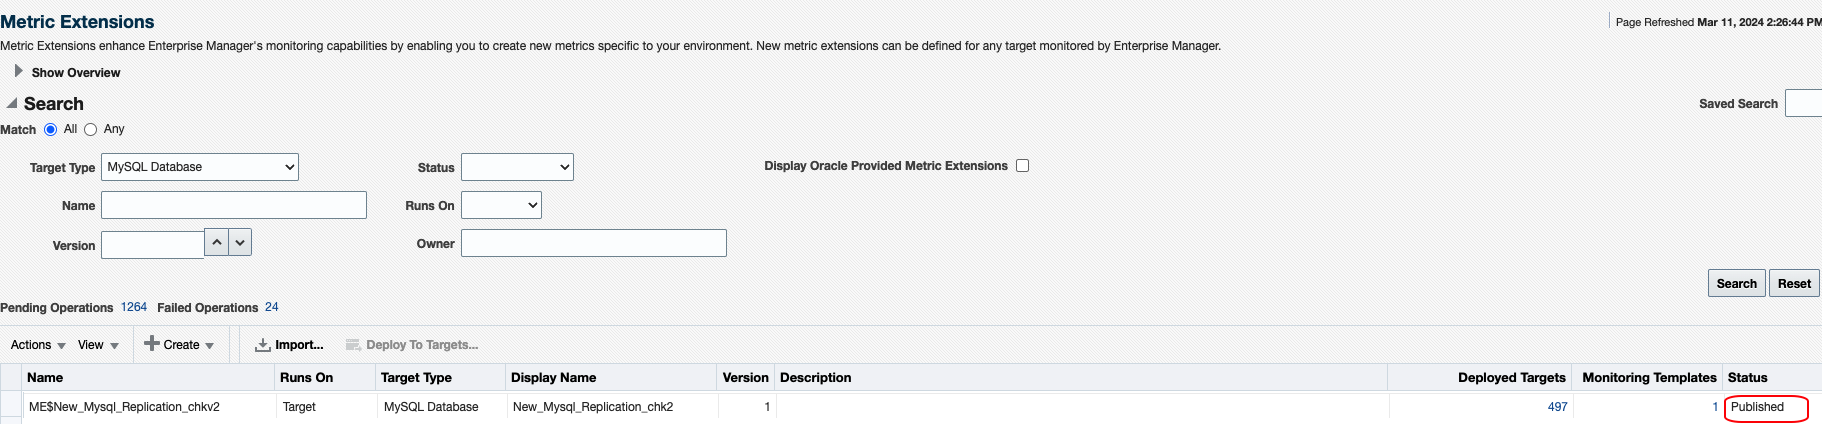
After testing and confirming the results, we published the metric extension for general use.
To automate the deployment of the metric extension to new MySQL databases, we added our metric extension into a default MySQL Monitoring Template.
Last, we updated our incident rules to send notifications to our DBA team whenever an InnoDB Cluster member is ejected from the cluster.
Using Enterprise Manager and Metric Extensions, we proactively monitor issues that can impact our fleet of MySQL InnoDB Clusters. This enables our DBA team to maintain highly available MySQL databases required by our business.
Resources
Refer to the following for more information: