
OCI Database Management continues to deliver new capabilities that improve observability across database fleets and help reduce time to resolution for performance issues. These enhancements include a new Autonomous AI Database activity overview dashboard, SQL profile and SQL plan baseline management, and Compare Period ADDM. With the newly released demo mode, you can now explore these capabilities and the broader Database Management experience in your own tenancy using representative mock data.
Together, these capabilities help administrators quickly understand what changed, determine whether a database is under resource pressure, and identify the best course of action when application performance degrades. Instead of correlating dashboards, diagnostic reports, and performance data across multiple time periods, administrators can use Database Management to analyze issues in a more consolidated and actionable way.
With these capabilities, you can:
- Analyze activity and resource utilization for an Autonomous AI Database in a consolidated dashboard.
- Use ADDM data to compare a period of performance degradation with a healthy baseline.
- Manage SQL profiles and SQL plan baselines in a user-friendly console.
- Freely explore Database Management features in your own tenancy using representative demo data.
Obtain an at-a-glance view of Autonomous AI Database performance
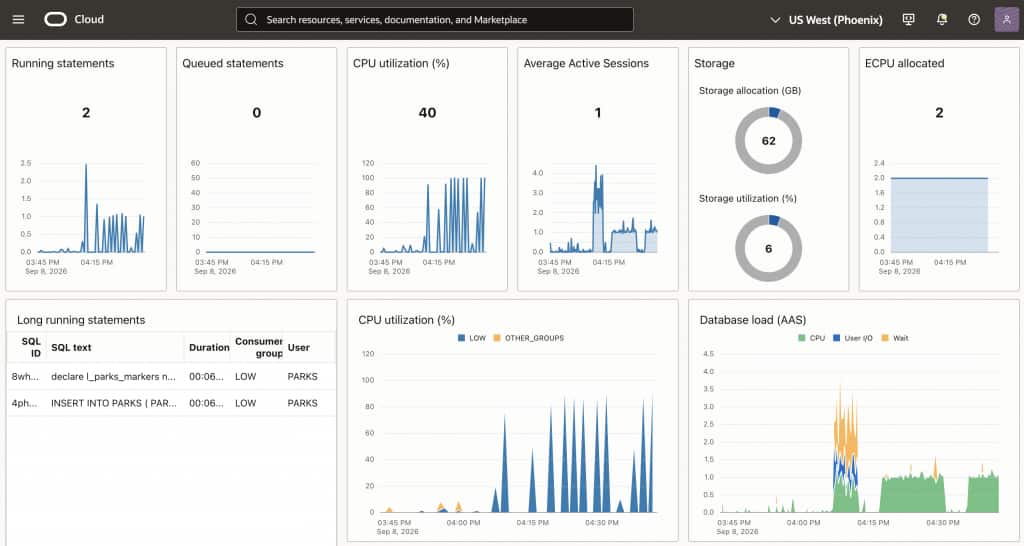
When you are new to Autonomous AI Database or working with an unfamiliar workload, it can be difficult to know where to begin when investigating performance. The new Autonomous AI Database activity overview experience in Database Management provides a simple, consolidated view of what the database was doing during a selected period.
The dashboard brings database activity, resource utilization, and workload information together in one place. You can quickly see whether activity was driven primarily by CPU usage or by sessions waiting for resources such as I/O or concurrency, without having to start with individual metrics or SQL statements.
Database activity is represented using Average Active Sessions, the average number of sessions actively using CPU or waiting for a resource. This gives you an intuitive way to understand the level and nature of activity in the database.
Use the dashboard to answer questions such as:
- When did database activity begin to increase?
- Was the database primarily using CPU or waiting?
- Did resource utilization change with the workload?
- Was the increase brief, sustained, or recurring?
- Which part of the selected period requires deeper analysis?
Once you identify a period of interest, you can use the dashboard to understand where to focus next and share the selected time window with your database or application team for follow-up. For database specialists, the same period can serve as a starting point for deeper analysis in Performance Hub, AWR Explorer, or SQL Tuning Advisor.
Understand what changed with Compare Period ADDM
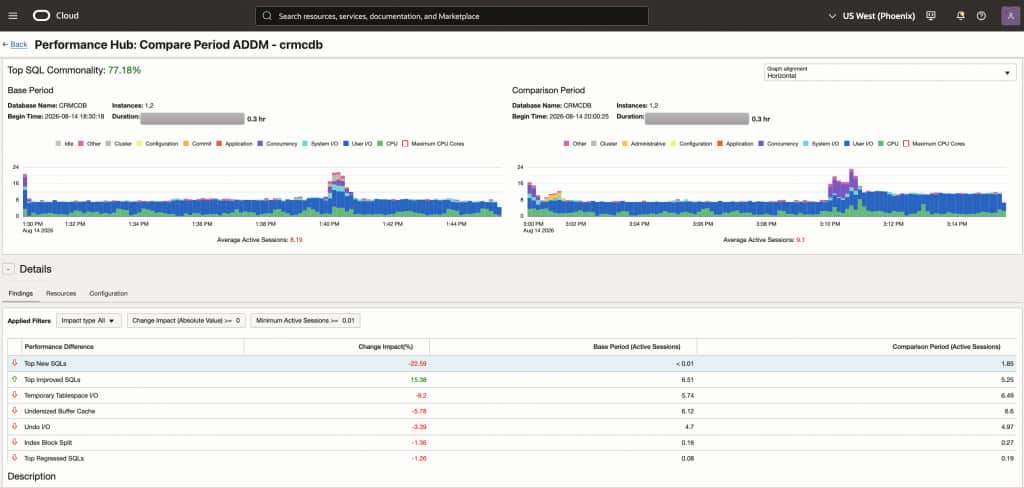
When database performance changes, teams need to know more than what changed—they need to understand why. Compare Period Automatic Database Diagnostic Monitor, or Compare Period ADDM, compares two periods: a base period representing normal performance and a comparison period being investigated.
The report highlights the differences that contributed to a performance regression or improvement. It examines changes in workload, SQL activity and execution plans, wait events, configuration, and resource usage across CPU, memory, and I/O. Findings are ranked by impact, helping teams focus on the factors most likely to explain the change instead of manually comparing multiple charts and reports.
Common comparisons include:
- The period after an application deployment compared with the period before it
- A slow business hour compared with the same hour on a normal day
- Performance before and after a configuration change
- A current incident compared with an established baseline
- Two periods with similar workload volume but different response times
For example, overall database load may appear similar in both periods, but the comparison could reveal that a high-impact SQL statement began using a different execution plan. In another case, a workload increase might be accompanied by higher User I/O waits or greater concurrency.
Compare Period ADDM is designed to highlight these differences and provide findings that guide the next stage of the investigation.
Manage SQL profiles and SQL plan baselines from Database Management
Once administrators identify a high-impact SQL statement, they need a controlled way to improve its performance and protect it from future regressions.
SQL Tuning Advisor analyzes SQL statements and can recommend a SQL profile when it identifies optimizer-estimation errors. It provides additional information that improves the optimizer’s estimates when generating an execution plan; as such, the profile does not force the optimizer to use a specific plan. Instead, it helps the optimizer make a better cost-based decision based on the current database environment. This flexibility allows fluid performance when changes in statistics, data distribution, indexes, and other conditions occur within the database.
SQL plan baselines address a related but different challenge: execution-plan stability. A SQL plan baseline contains a set of accepted execution plans that the optimizer can use for a SQL statement, helping prevent performance regressions caused by an unverified plan change.
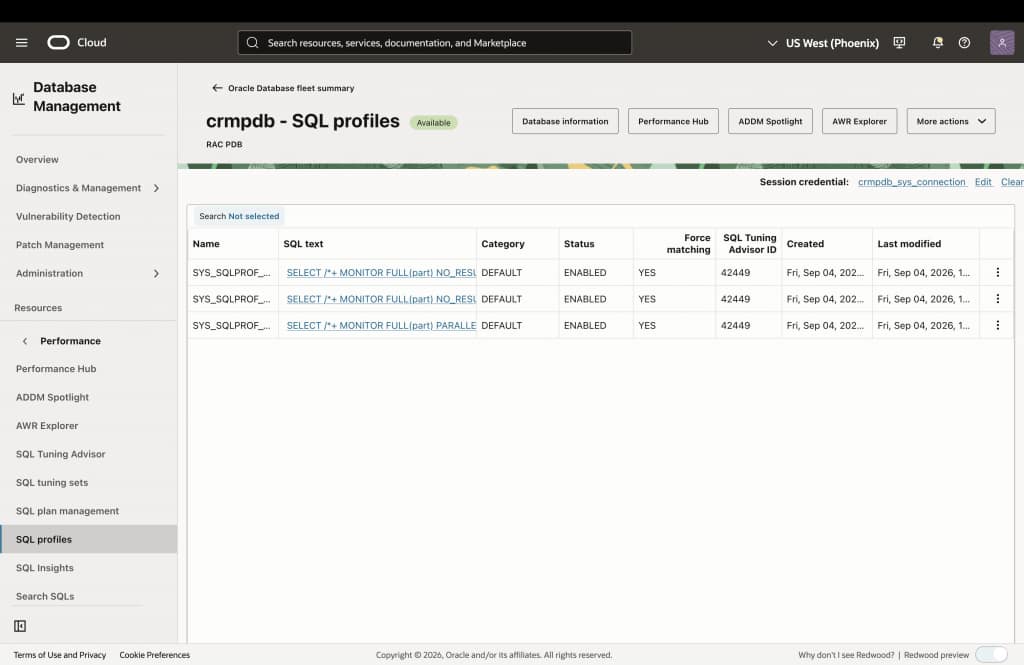
From the Database Management console, administrators can manage SQL profiles and SQL plan baselines through workflows that include:
- Reviewing SQL profile and SQL plan baseline details
- Enabling or disabling SQL profiles and baseline plans
- Accepting a recommended SQL profile
- Loading plans from the cursor cache or AWR snapshots
- Fixing or evolving accepted plans
- Using force matching for SQL profiles when appropriate
- Monitoring the status of profile- and baseline-related operations
By bringing SQL profile and SQL plan baseline management into Database Management, administrators can move more directly from identifying inefficient SQL to improving optimizer decisions and maintaining stable SQL performance.
Explore Database Management with demo mode
Before adopting a management service, teams often want to understand the user experience and evaluate how it supports their operational workflows.
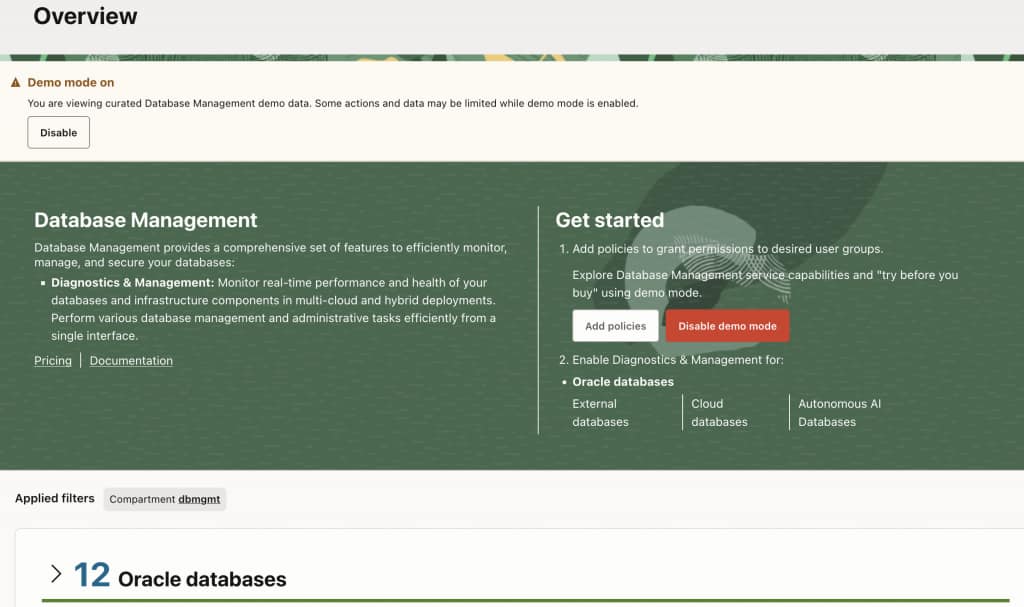
Normally, exploring database monitoring capabilities requires onboarding a database, configuring access, and collecting enough performance data to produce meaningful dashboards. Database Management demo mode provides a simpler starting point.
With demo mode available in your own tenancy, you can use representative data to explore Database Management features without first enabling the service for your databases. You can navigate performance dashboards and become familiar with how the service presents database health, activity, SQL performance, and diagnostic information.
Demo mode can help:
- DBAs evaluate Database Management capabilities
- New administrators learn the service
- Teams prepare for database onboarding
- Operations teams develop standard investigation workflows before going live in a new deployment
Demo mode gives teams a low-risk way to understand how Database Management can support their environment before they begin onboarding production resources.
From a performance overview to targeted action
When an application begins responding slowly after a release, application and operations teams can start with the Autonomous AI Database activity overview dashboard. The consolidated view of database activity, resource utilization, and workload behavior helps them understand when performance changed and whether the database was primarily using CPU or waiting for resources.
For database specialists working with a supported Oracle database deployment, Compare Period ADDM provides a deeper comparison between the affected interval and a healthy baseline. It highlights the changes with the greatest performance impact, including workload differences, SQL execution behavior, wait activity, configuration changes, and resource usage.
If the analysis identifies a high-impact SQL statement, database specialists can use SQL Tuning Advisor and SQL profile management to evaluate and apply tuning recommendations. SQL plan baseline management can then help preserve an accepted execution plan and reduce the risk of future regression.
Together, these capabilities support a shared path from understanding database behavior to deeper diagnosis and controlled tuning action.
Get started with Database Management
The new Database Management capabilities provide a more complete performance-management workflow for Oracle databases.
The Autonomous AI Database activity overview dashboard helps administrators understand workload activity and resource consumption. Compare Period ADDM explains how performance differs between a healthy period and a problem period. SQL profile management helps correct optimizer-estimation issues, while SQL plan baselines protect statements from execution-plan regressions. Demo mode makes it easier to explore these capabilities before onboarding a database.
To get started, open Database Management in the OCI Console and enable demo mode on the Overview page, or select a database on the Oracle Database fleet summary page, to explore the available monitoring and management features, including SQL tuning, SQL profiles, SQL plan management, and diagnostic capabilities.
If you’re looking for more information regarding the service capabilities, check out the following resources: