
Managing Oracle Fusion Applications requires timely, actionable insight into issues affecting payroll, financial processes, user access, and security. OCI Log Analytics brings ESS, audit, user-access, security, metadata, and SOA audit activity into focused, Oracle-defined dashboards, helping teams identify issues sooner, assess their impact, and accelerate resolution.
With powerful conversational AI and proactive alerting, OCI Log Analytics makes observability faster, smarter, and more proactive. LoganAI accelerates deeper investigations by explaining complex log records, patterns, and visualizations, while saved searches, scheduled detection rules, and OCI alarms help teams detect and respond to emerging issues before they affect users.
After the relevant Fusion log sources are configured and data is being collected in OCI Log Analytics, these dashboards provide a starting point without requiring teams to begin with custom queries.
In this post, you’ll learn how these dashboards, LoganAI, and alerts deliver faster insight across scheduled processes, access, audit, security, and metadata.
Find the Fusion dashboards
In the OCI Console, navigate to Observability & Management > Log Analytics > Dashboards.
Search for Fusion and identify dashboards created by Oracle.
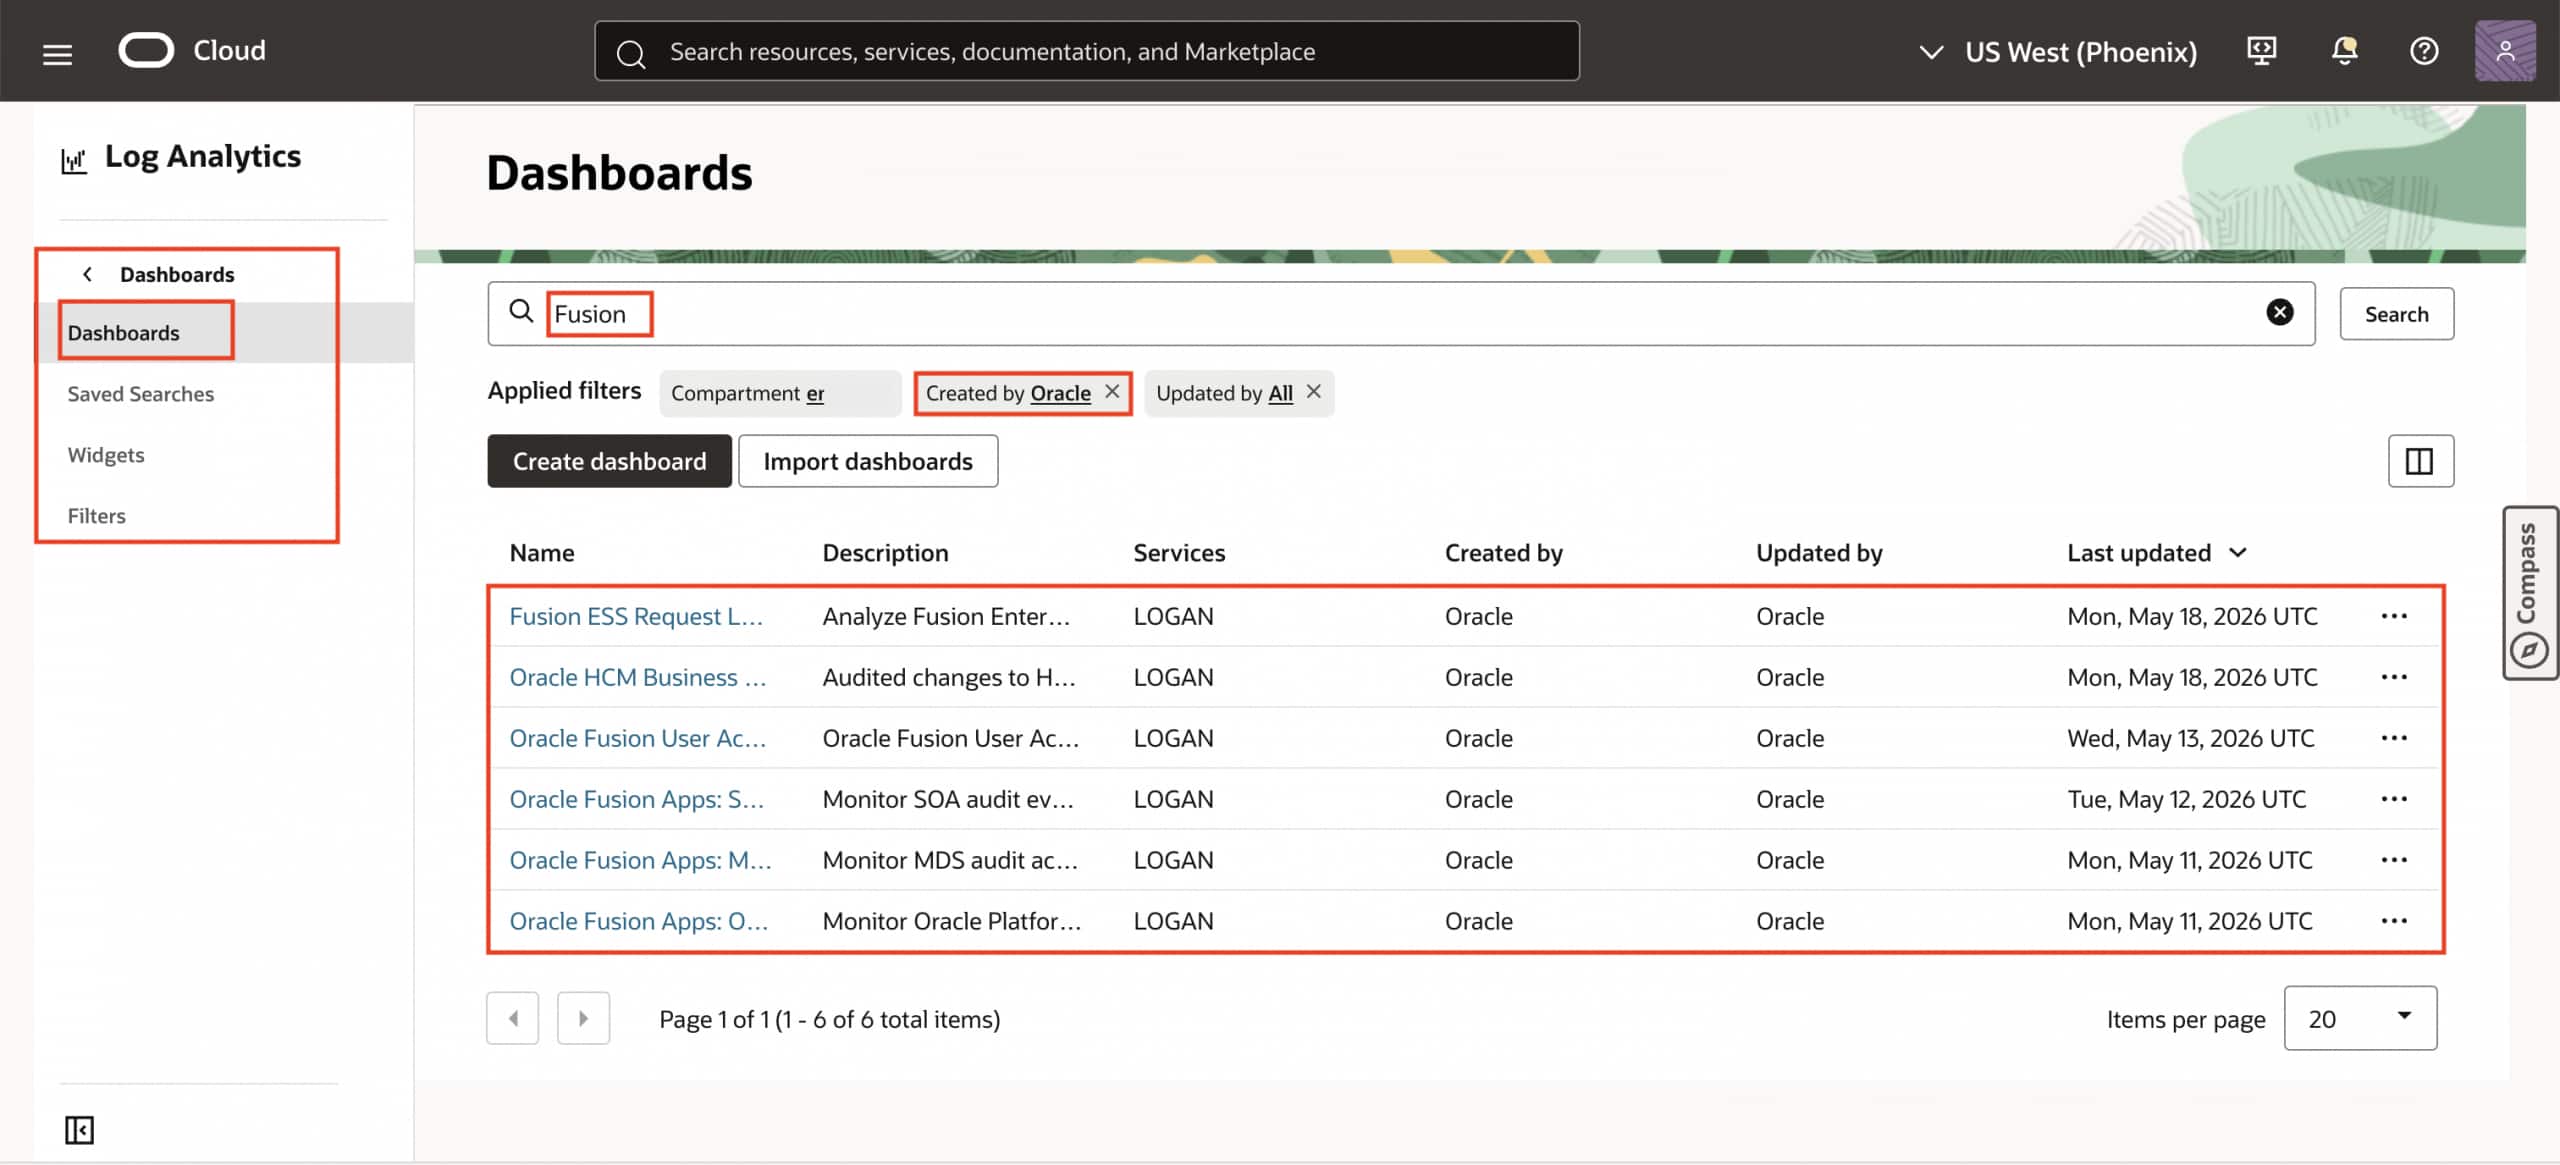
Oracle-defined Fusion Applications dashboards in OCI Log Analytics
Choose a dashboard, then select the compartment and time range for the Fusion environment you want to review.
When a scheduled process is delayed or fails
ESS jobs support many day-to-day Fusion processes, including report generation, data imports, record updates, and scheduled business processes.
When a business team reports that a process has not completed, start with Fusion ESS Request Logs Analysis. The dashboard shows the number of requests, job status, jobs by application, job volume over time, and ESS requests by application and job.
Use it to determine whether the problem is isolated to one request or part of a wider pattern. The Unsuccessful Jobs view helps focus on failed, warning, or cancelled requests. The job summary can be grouped by product family, product, job, and status, and includes average execution time.
This helps answer practical questions:
- Which jobs failed?
- Which jobs are taking longer than expected?
- Are failures increasing?
- Which application, product, or product family is affected?
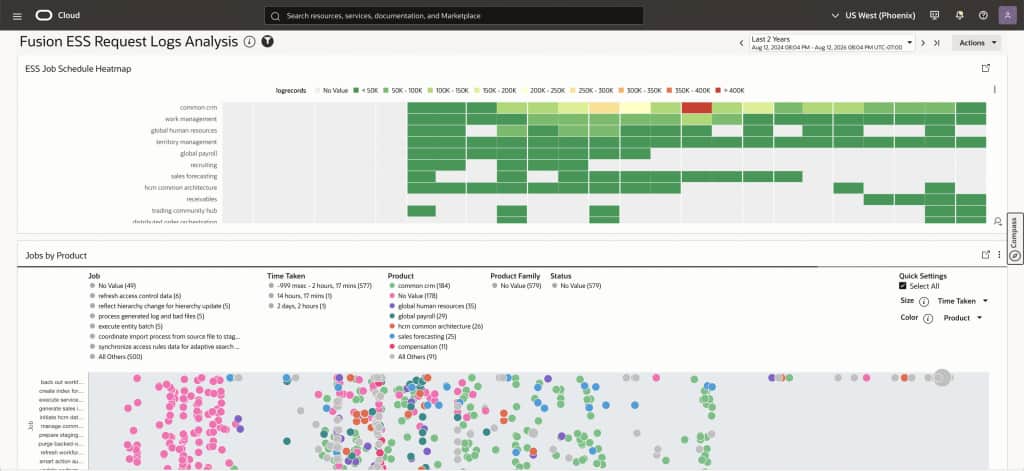
Fusion ESS Request Logs Analysis dashboard
When an HCM record changes unexpectedly
The Oracle HCM Business Object Audit dashboard is useful when you need to review changes to HCM business objects.
Start with the summary to see the Fusion instances with audit activity, users making changes, and total business-object changes. Then use the Action Analysis and Business Object Analysis views to narrow the investigation to the actions and objects involved.
For example, if an HR team asks why a record changed, this dashboard helps identify the relevant time period, user activity, and business-object audit events before you open the underlying records.
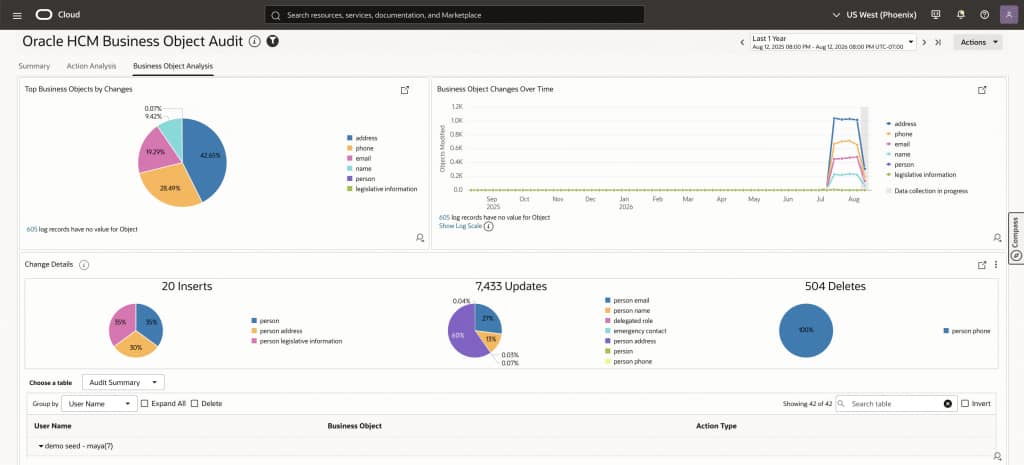
Oracle HCM Business Object Audit dashboard
When a customization or metadata setting changes
The Oracle Fusion Apps: MDS Audit dashboard is for metadata and customization-related activity.
It shows audit-event and user counts, event trends, top users, event categories, and changed values. The user-activity view lists the user, event category, changed value, and event time.
Use this dashboard when investigating a change to a personalization, navigation setting, saved search, field configuration, or other metadata-related setting.
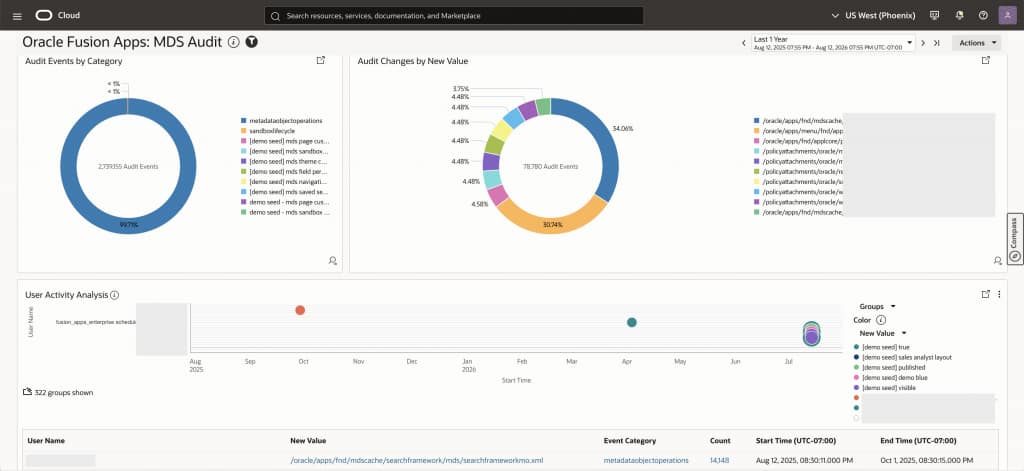
Oracle Fusion Apps: MDS Audit dashboard
When access needs investigation
The Oracle Fusion User Access dashboard provides a quick view of login activity.
It shows successful and failed login attempts, unique users, user countries, client locations, top users, and failed logins by user and city. This is useful when a user reports an access problem or when security teams need to review unusual login activity.
Start by filtering for the reported time range and user, then review successful and failed login patterns, client locations, and the associated records.
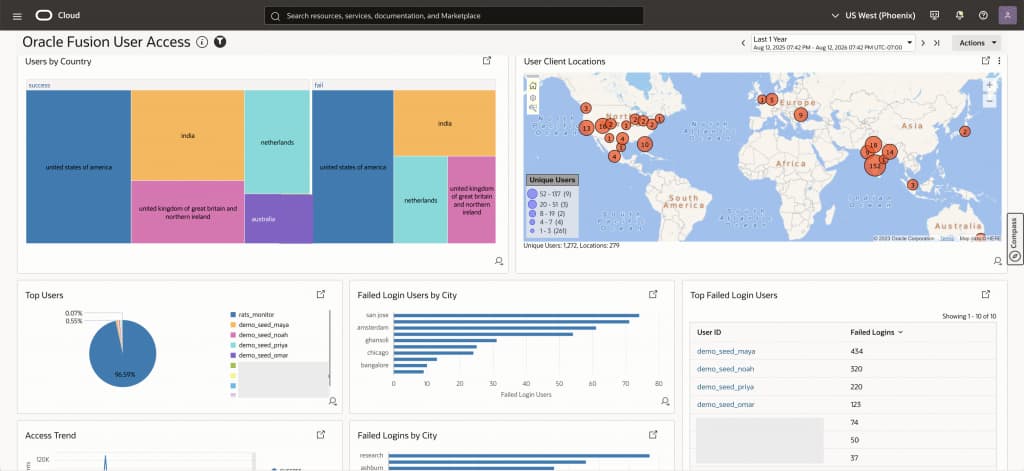
Oracle Fusion User Access dashboard
When roles, policies, or permissions change
The Oracle Fusion Apps: OPSS Audit dashboard focuses on security-related audit activity.
It shows audit-event and user counts, event types, event categories, user activity, and trends over time. Use it to review role creation, policy changes, permission updates, and related activity.
For example, if a security team needs to know who changed a role or revoked a permission, the dashboard helps narrow the investigation by user, category, event type, and time.
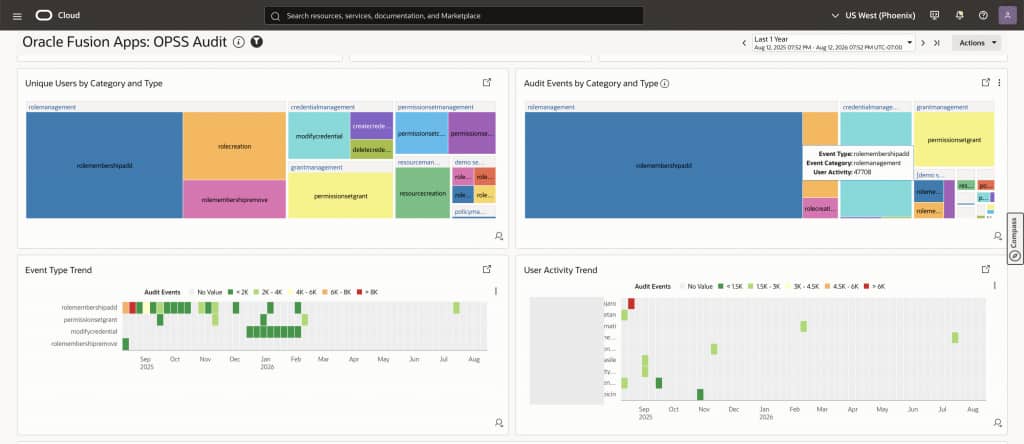
Oracle Fusion Apps: OPSS Audit dashboard
When a service-oriented process has an issue
The Oracle Fusion Apps: SOA Audit dashboard provides visibility into Fusion SOA audit activity.
Use it when investigating a Fusion workflow or service-oriented process that is delayed, unsuccessful, or behaving unexpectedly. Start with the time when the business issue was reported, then review the related SOA audit activity to identify relevant events and narrow the investigation.
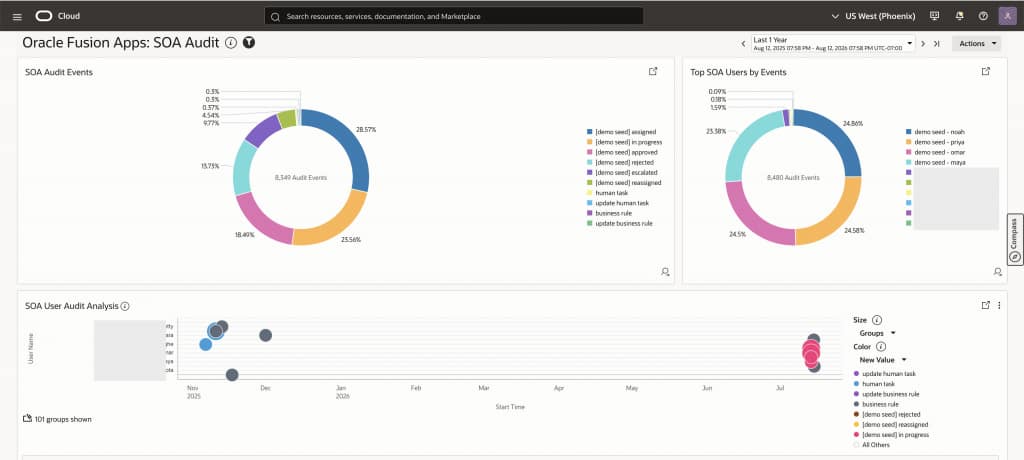
Oracle Fusion Apps: SOA Audit dashboard
Start with the dashboard that matches the question
- A delayed or failed scheduled process: Fusion ESS Request Logs Analysis
- An unexpected HCM business-object change: Oracle HCM Business Object Audit
- A metadata or customization change: Oracle Fusion Apps: MDS Audit
- A login or access question: Oracle Fusion User Access
- A role, policy, or permission change: Oracle Fusion Apps: OPSS Audit
- A Fusion workflow or service-oriented process issue: Oracle Fusion Apps: SOA Audit
Use LoganAI to accelerate log investigation
After a dashboard identifies the area to investigate, open the underlying records in Log Explorer. If LoganAI is enabled for your tenancy, select the LoganAI icon to generate an explanation of the selected log data.
LoganAI can help summarize individual logs, groups of logs, clusters, and supported visualizations. It can help teams interpret patterns, identify potential anomalies, and explore suggested follow-up questions without leaving Log Explorer.
For example, after using the Oracle HCM Business Object Audit dashboard to identify an unexpected record change, open the related results in Log Explorer. Select the LoganAI icon to generate an explanation of the HCM audit records, identify patterns or potential anomalies, and explore suggested follow-up questions. This can help teams understand what changed, which business object was affected, and which user activity is relevant before reviewing the individual records in detail.
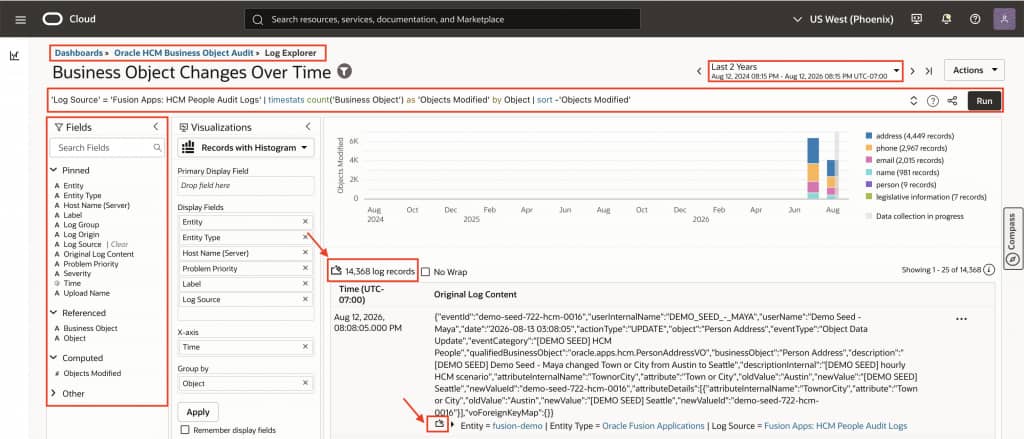
Use LoganAI in Log Explorer
LoganAI complements the dashboards. Use a dashboard to identify where to focus, then use LoganAI in Log Explorer to interpret the underlying log data more quickly. As with any AI-generated insight, validate the explanation against the source records before making operational decisions.
Note: LoganAI requires OCI Generative AI configuration, the required IAM policies, and user access. See Use LoganAI for enablement requirements and usage guidance.
Move from investigation to proactive monitoring
Oracle-defined Fusion dashboards help teams investigate incidents and understand normal behavior. To make monitoring more proactive, use dashboard findings to define the conditions that matter most to your organization, then create detection rules and OCI alarms for those conditions.
For thresholds, counts, and trends, create a saved search and schedule it as a detection rule. For example, you might alert when unsuccessful ESS jobs exceed an expected threshold or failed login attempts increase unexpectedly. For individual high-priority events, such as security-related audit activity that requires immediate review, use an ingest-time detection rule. Both rule types publish detected events or results as metrics in OCI Monitoring, where OCI alarms can notify the appropriate team through its configured notification channel.
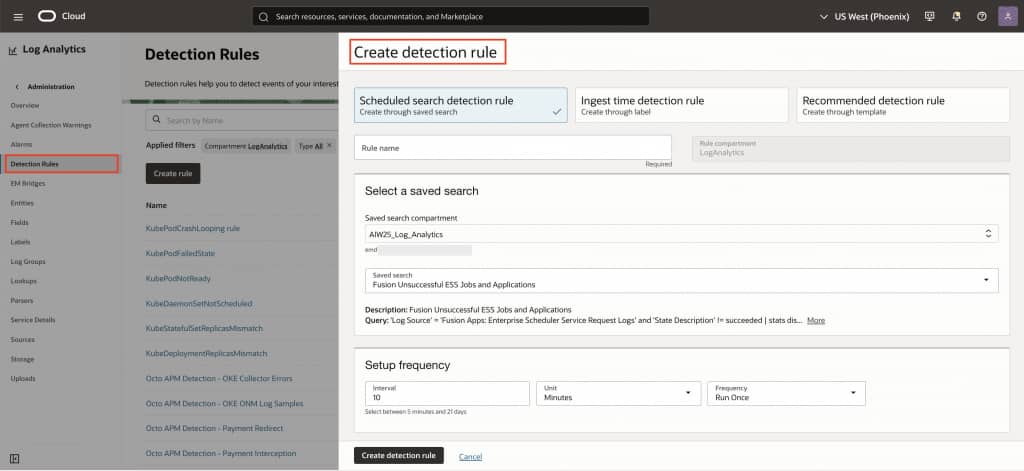
Configure detection rules
This approach brings investigation and proactive response together by using Fusion dashboards to understand normal behavior and investigate incidents, LoganAI to interpret the underlying records more quickly, and alerts to notify teams when conditions require attention.
In the next post, we’ll show how to connect Oracle Fusion Applications to OCI Log Analytics, configure the Management Agent and credentials, select Fusion log sources, and verify that data is being collected.