
An application slows down. Before a DBA changes anything, they need answers to a short list of questions. Which database deserves attention? Is the load new? Are sessions running on CPU, queued for it, or blocked by each other? Which SQL statements and application behavior explain it?
The OCI Database Observability MCP Server lets an AI assistant work through those questions using OCI Database Management, Ops Insights, and OCI Monitoring, all through a single MCP connection. In our emdemo lab, we started with fleet-level measurements, narrowed to an Autonomous AI Database named Autonomous AIDB, and followed its ADDM findings down to the SQL responsible.
The investigation turned up three problems:
- CPU allocation throttling by Resource Manager
- Row-lock contention on hot rows
- Hard parsing caused by literal-heavy SQL
None of these would have been fixed by adding compute alone. Each one led to a specific tuning action. The incident also made a practical case for Ops Insights, which keeps SQL and ADDM history over time.
What is possible
An MCP-capable client such as Claude or Codex discovers the server’s capability groups and chooses the read operations that fit the question. A DBA can:
- Compare load across the fleet
- Inspect metrics for a single database
- Retrieve AWR reports and existing ADDM analysis
- Trace findings to specific SQL, objects, and blocking sessions
The output is diagnostic evidence and recommendations. The DBA reviews them before acting.
Getting connected:
- Follow the installation steps in the official OCI Database Observability MCP Server repository.
- Register the server in your LLM client and supply your OCI authentication and region.
- Select the tenancy and compartment to investigate.
The end-to-end investigation flow
- Fleet triage. Find a meaningful load change, and check that metrics are present and current.
- Database drill-down. Inspect CPU, DB time, active sessions, and waits over a bounded interval.
- Database Management ADDM. Retrieve completed ADDM tasks and the AWR report that covers that interval.
- SQL and transaction analysis. Follow the findings to SQL, blocking chains, hot rows, and parsing behavior.
- Consider Ops Insights Full. Add SQL Insights and long-range ADDM Spotlight when ongoing history would help.
- Validate collection and compare trends. Confirm data coverage, then check whether problems recur and whether remediation worked.
Scenarios from the investigation
Scenario 1: Find the database that needs attention
Ask: Which databases deserve attention in the fleet, and how does their load compare with the previous day?
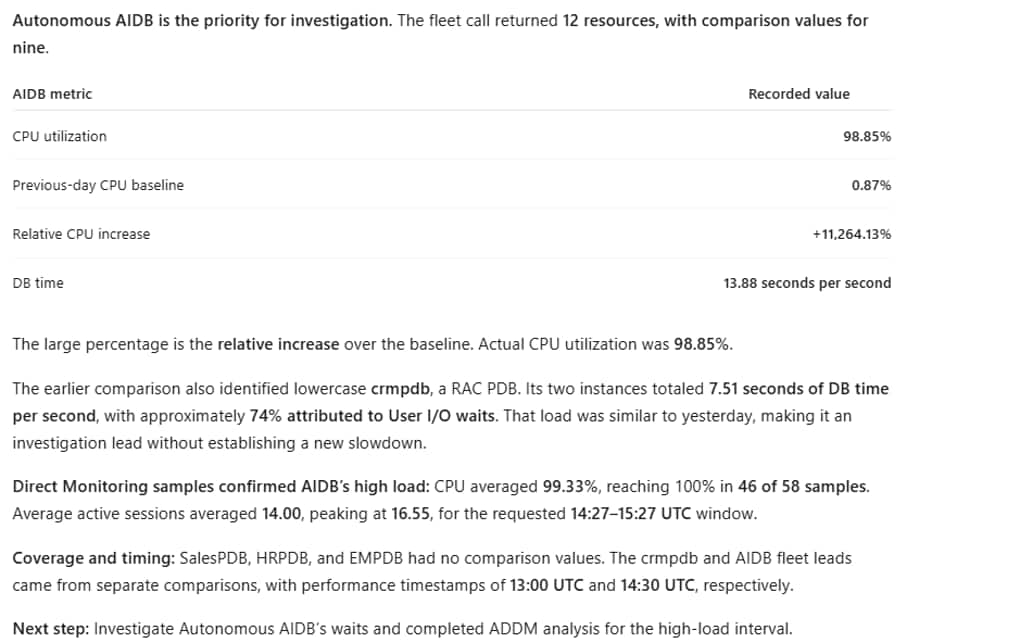
The fleet call returned 12 resources, and nine of them had comparison values. SalesPDB, HRPDB, and EMPDB returned no metrics. We reported them as no data, not as healthy. Appearing in the inventory says nothing about a database’s state.
The first comparison flagged crmpdb, a two-instance RAC PDB:
- 7.51 average active sessions (DB time per second)
- About 74% of the DB time was spent on User I/O
- Load similar to the previous day
That makes crmpdb a steady-state I/O tuning candidate. It is not a new incident.
A refreshed comparison moved Autonomous AIDB to the top of the list:
- CPU utilization of 98.85%, up from under 1% the day before
- 13.88 average active sessions
The tool reported this as an 11,264% increase. That number is mathematically correct, but percentage change is the wrong way to read a jump from a near-zero baseline. What matters is that a database that was nearly idle became saturated.
Scenario 2: Drill down to Autonomous AI Database
Ask: Autonomous AIDB has no matching Ops Insights resource. Can we still explain the slowdown?
Yes. Autonomous AIDB had Diagnostics & Management enabled, and Database Management already held completed ADDM tasks for it.
The investigation took four steps:
- Confirm the slowdown with direct metrics for Autonomous AIDB: CPU, DB time, and active sessions over the affected interval.
- List the completed ADDM tasks with addm_tasks.
- Find the AWR snapshot pair that matches the interval with list_awr_dbs.
- Pull the AWR report for that exact pair with get_awr_db_report.
The AWR report includes the full ADDM section, with findings, recommendations, SQL IDs, and object details. We did not need Ops Insights to retrieve evidence that already existed.
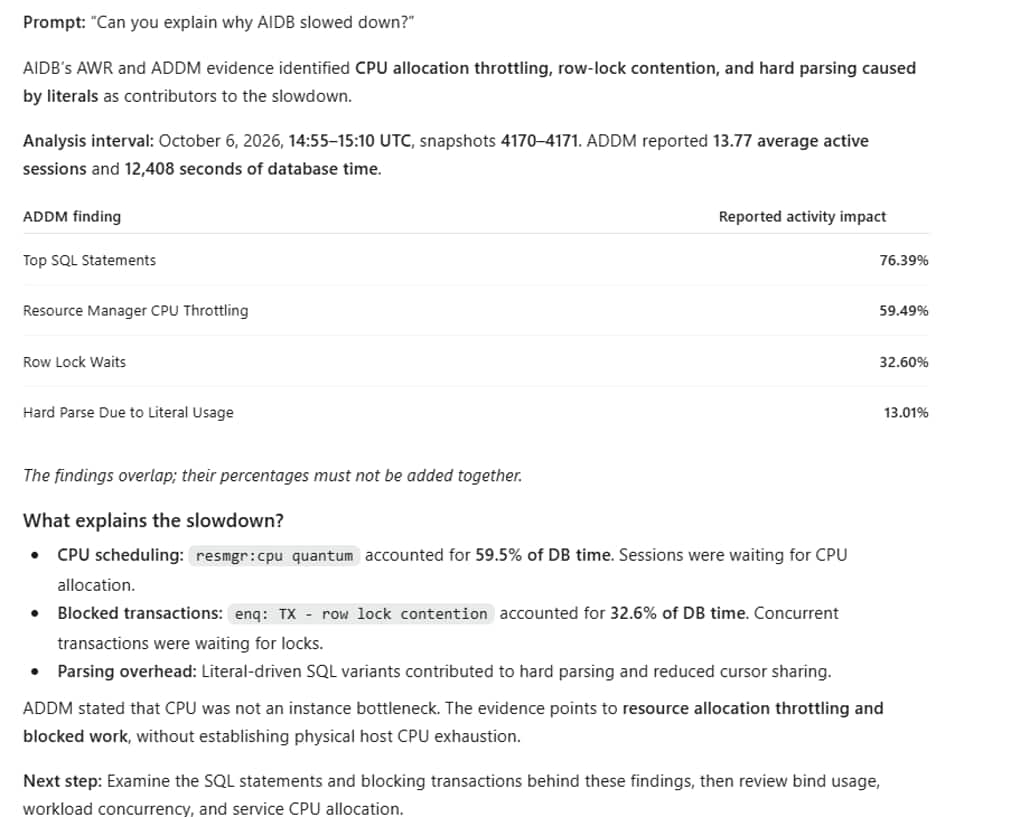
| ADDM finding | Impact (% of activity) |
| Top SQL Statements | 76.39% |
| Resource Manager CPU Throttling | 59.49% |
| Row Lock Waits | 32.60% |
| Hard Parse Due to Literal Usage | 13.01% |
These percentages overlap, so they should not be added together. The Top SQL finding came with five SQL and PL/SQL recommendations.
The AWR wait profile confirmed the findings independently:
| Component | Share of DB time |
| resmgr:cpu quantum (waiting for a CPU allocation) | 59.5% |
| enq: TX – row lock contention (blocked by another session) | 32.6% |
| DB CPU (actually running) | 7.4% |
Over 90% of DB time was spent waiting rather than working. Sessions were either queued for a CPU allocation or blocked by another session.
ADDM also reported that CPU was not a bottleneck at the instance level. That only looks like a contradiction. On Autonomous AI Database, resmgr:cpu quantum means sessions are being held back by the service’s CPU allocation: the provisioned compute, auto-scaling settings, and the consumer group for the connection service. The host was not out of CPU. This was a resource-allocation constraint, and the remedy is different from a host capacity problem.
Scenario 3: Follow the findings to SQL and transactions
Ask: Which SQL and application behavior caused the lock waits, CPU scheduling waits, and hard parsing?
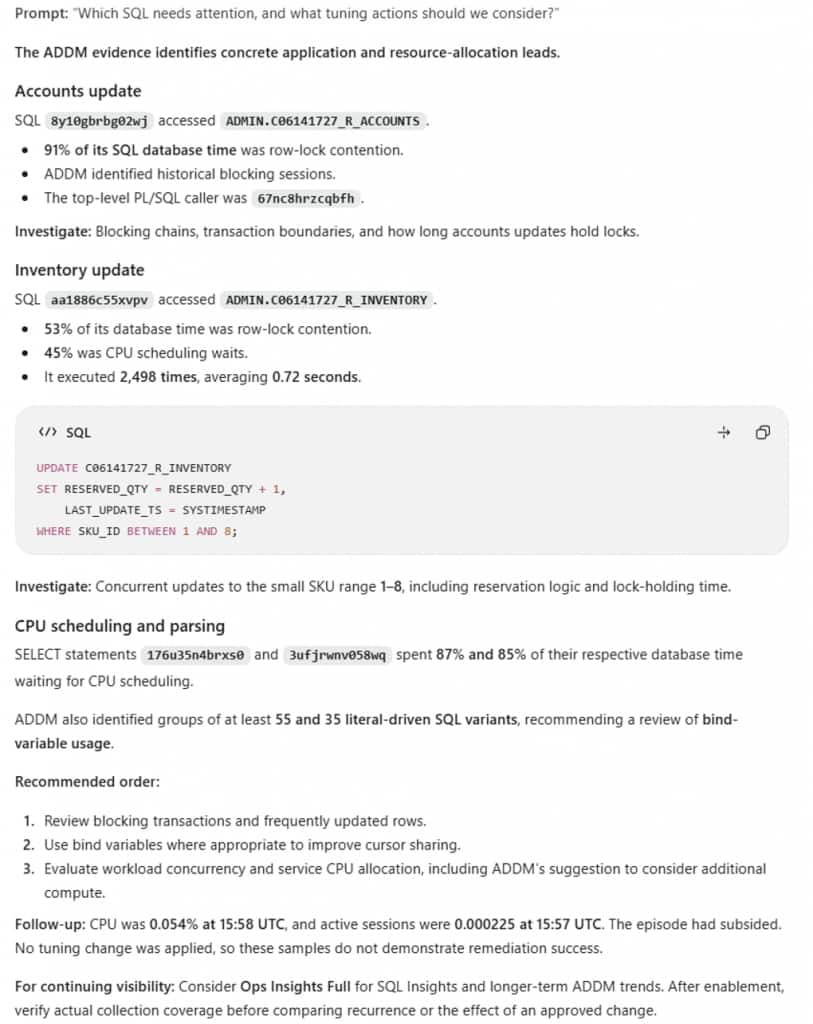
The findings identified concrete application leads. Accounts update 8y10gbrbg02wj waited on ADMIN.C06141727_R_ACCOUNTS. ADDM attributed 91% of this SQL’s database time to row-lock contention and identified several historical blocking sessions. Its top-level PL/SQL caller was 67nc8hrzcqbfh.
Inventory update aa1886c55xvpv targeted ADMIN.C06141727_R_INVENTORY. Row locks accounted for 53% of its database time and CPU scheduling waits for 45%. The SQL executed 2,498 times and averaged 0.72 seconds per execution.
For hard parsing, ADDM found groups of at least 55 and 35 literal-driven SQL variants under the same force-matching signature, with different plan hashes. It recommended reviewing bind-variable usage so equivalent statements can share cursors.
The tuning work now has a clear order: review the accounts and inventory blocking chains and transaction logic; investigate how long locks are held on frequently updated rows; review literal-heavy SQL for binds; then evaluate workload concurrency and service CPU allocation. Increasing compute would address only part of the observed problem.
Only scratching the surface
ADDM explains one completed interval. It cannot tell you whether this was a one-off or a recurring pattern. For that, consider enabling Ops Insights Full for Autonomous AIDB.
- SQL Insights keeps history of SQL latency, execution counts, plans, DB time, and cursor-sharing problems. That history answers a question one ADDM run cannot: did the inventory update get slower, or did it just run more often?
- ADDM Spotlight tracks findings across many analysis periods, including how often each finding appears, its impact, its recommendations, and related parameter changes. For Autonomous AIDB, the key questions are whether CPU throttling, lock waits, and literal parsing keep coming back, and whether their impact drops after a fix.
Database Management already offers ADDM Spotlight for recent analysis covering up to eight days by default. Ops Insights extends that to longer periods. For Autonomous AI Database, the deeper SQL and ADDM capabilities require the Full feature set.
Conclusion
The combined MCP server supported one continuous investigation:
- The fleet comparison pointed to Autonomous AIDB.
- Direct metrics confirmed the episode.
- Database Management ADDM explained where the time went.
- The SQL evidence identified the application and resource-allocation causes.
Throughout, the analysis stayed tied to a specific database identity and a specific analysis interval.
The method carries over to other incidents. Start with a DBA question, review the evidence the server returns, and let that evidence decide the next question. When ongoing SQL and ADDM history would sharpen the analysis, enable Ops Insights Full and confirm its data coverage before comparing trends.