Monitoring Apache Tomcat is easy with OCI Stack Monitoring. With this release DevOps Engineers can gain critical insight into the performance and health of Apache Tomcat. Combined with Stack Monitoring’s new problem-focused Enterprise Summary, meeting Tomcat SLAs has never been easier!
Stack Monitoring Tomcat Discovery is quick and easy
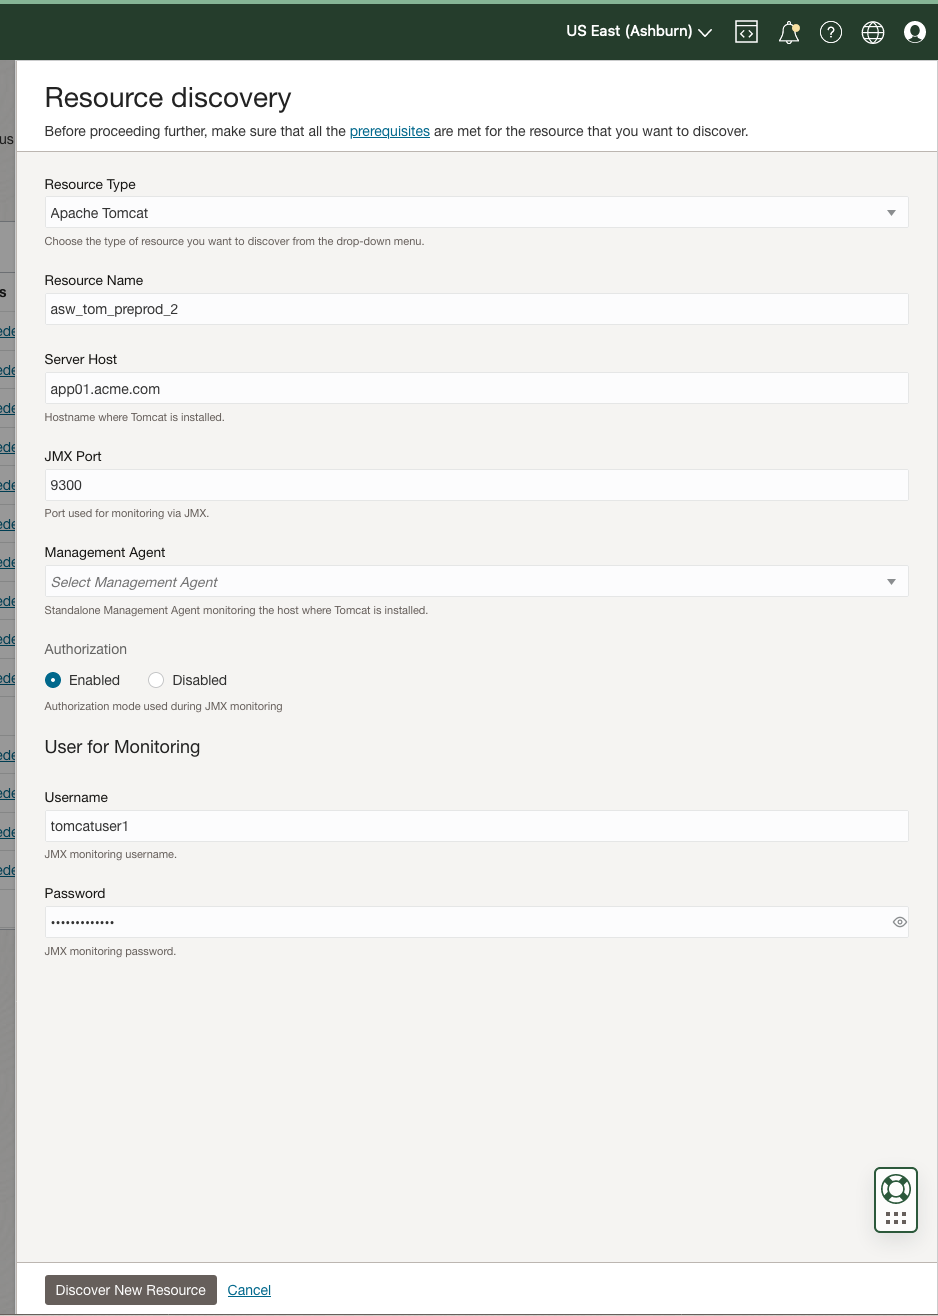
Stack Monitoring provides a fill-in-the-blanks UI to drive discovery. Simply complete the required fields, such as Resource Name, Server Host, JMX Port, and username/password and click Discover New Resource to submit the discovery job. The Stack Monitoring discovery job can be tracked on the resource discovery page. Once the job completes, Stack Monitoring creates a homepage for the Tomcat instance and immediately begins collecting metrics that can be used to create alarms.
Understanding Tomcat performance across an enterprise
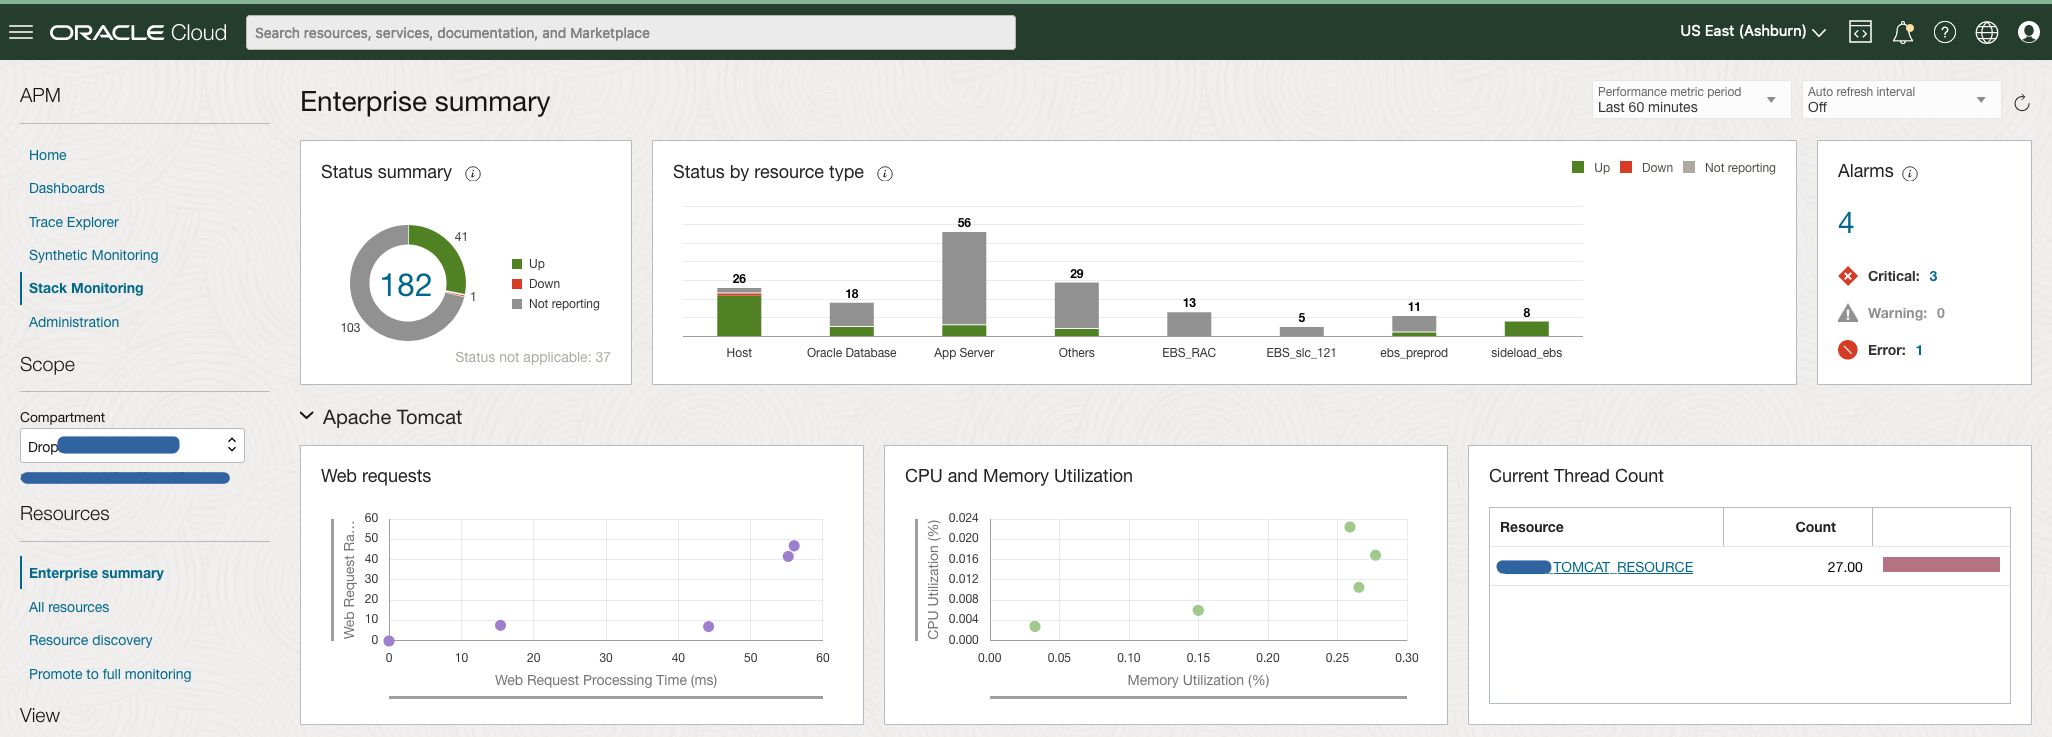
With Stack Monitoring’s new problem-focused Enterprise Summary, DevOps engineers can quickly identify the heaviest utilized Tomcat instances across an enterprise. These same charts can be used to help identify if a Tomcat instance is performing differently than others. Should an engineer need to investigate further, simply click the scatterplot value of concern, and Enterprise Summary will navigate to the Tomcat instance’s homepage for further troubleshooting.
A homepage fit for Tomcat troubleshooting
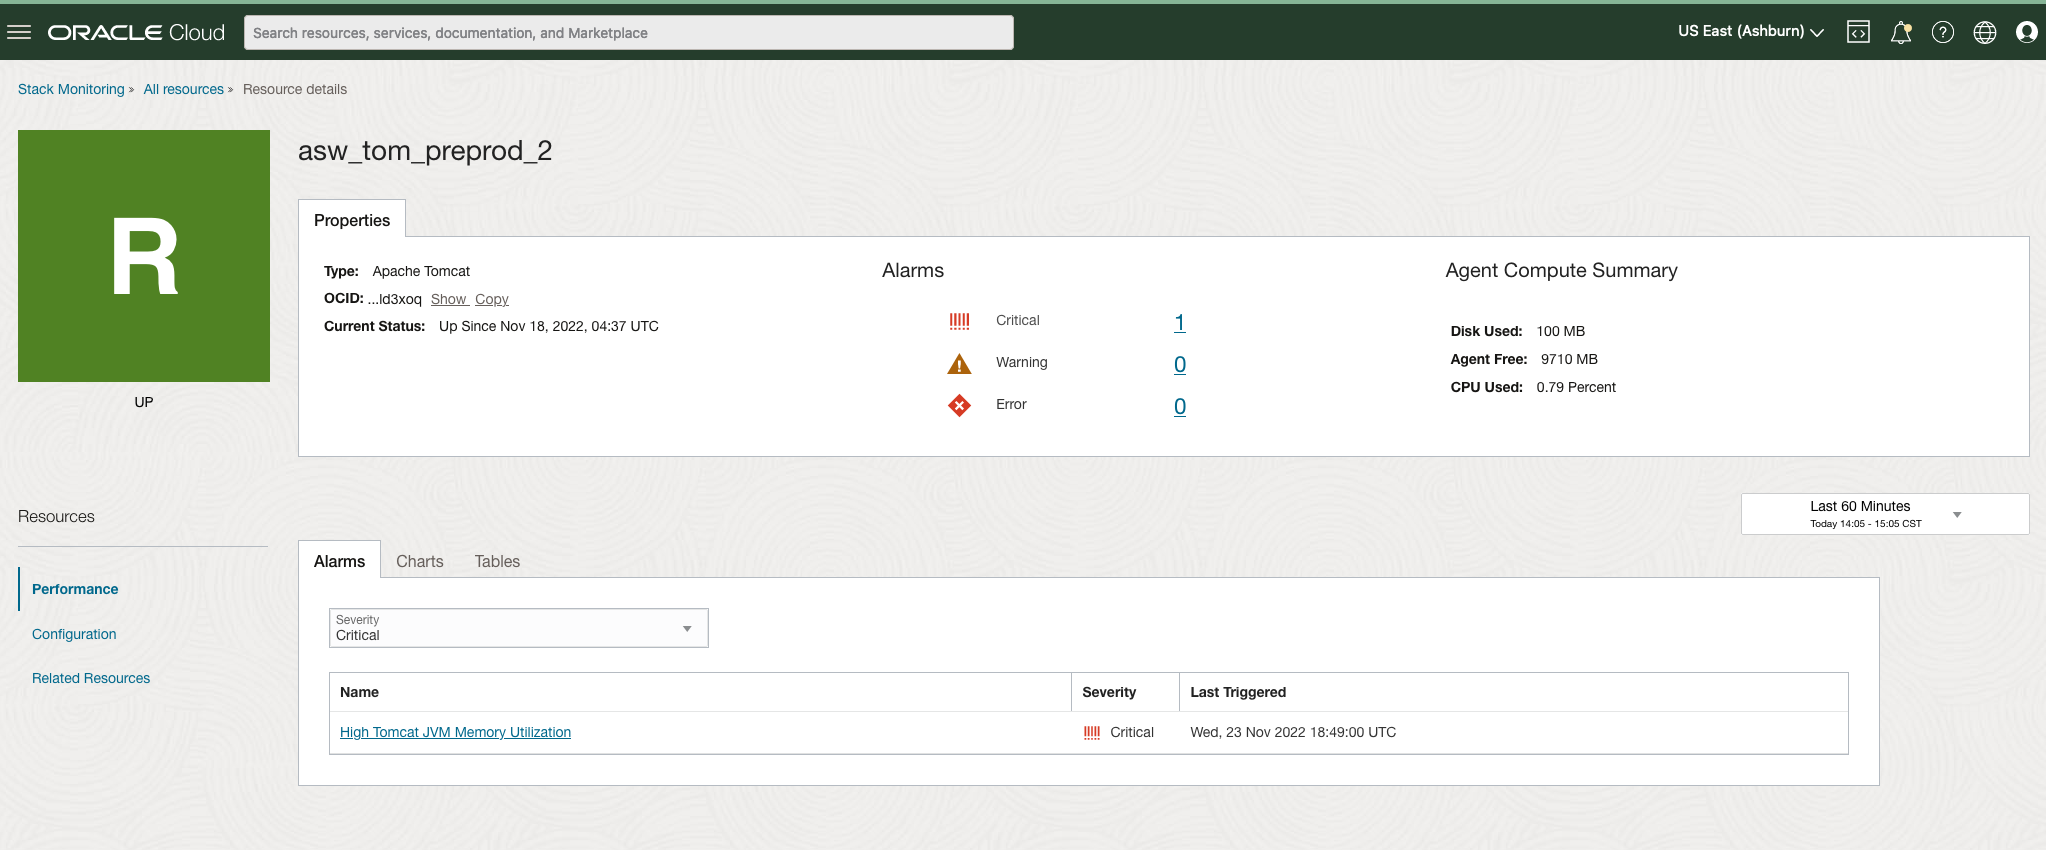
Stack Monitoring creates a unique homepage to help view the status and troubleshoot issues with Tomcat. The homepage begins by showing the status of the Tomcat instance as well as the severity and details of any open alarms. Clicking on an alarm opens a new tab within the OCI notification service and provides greater detail about the alarm.
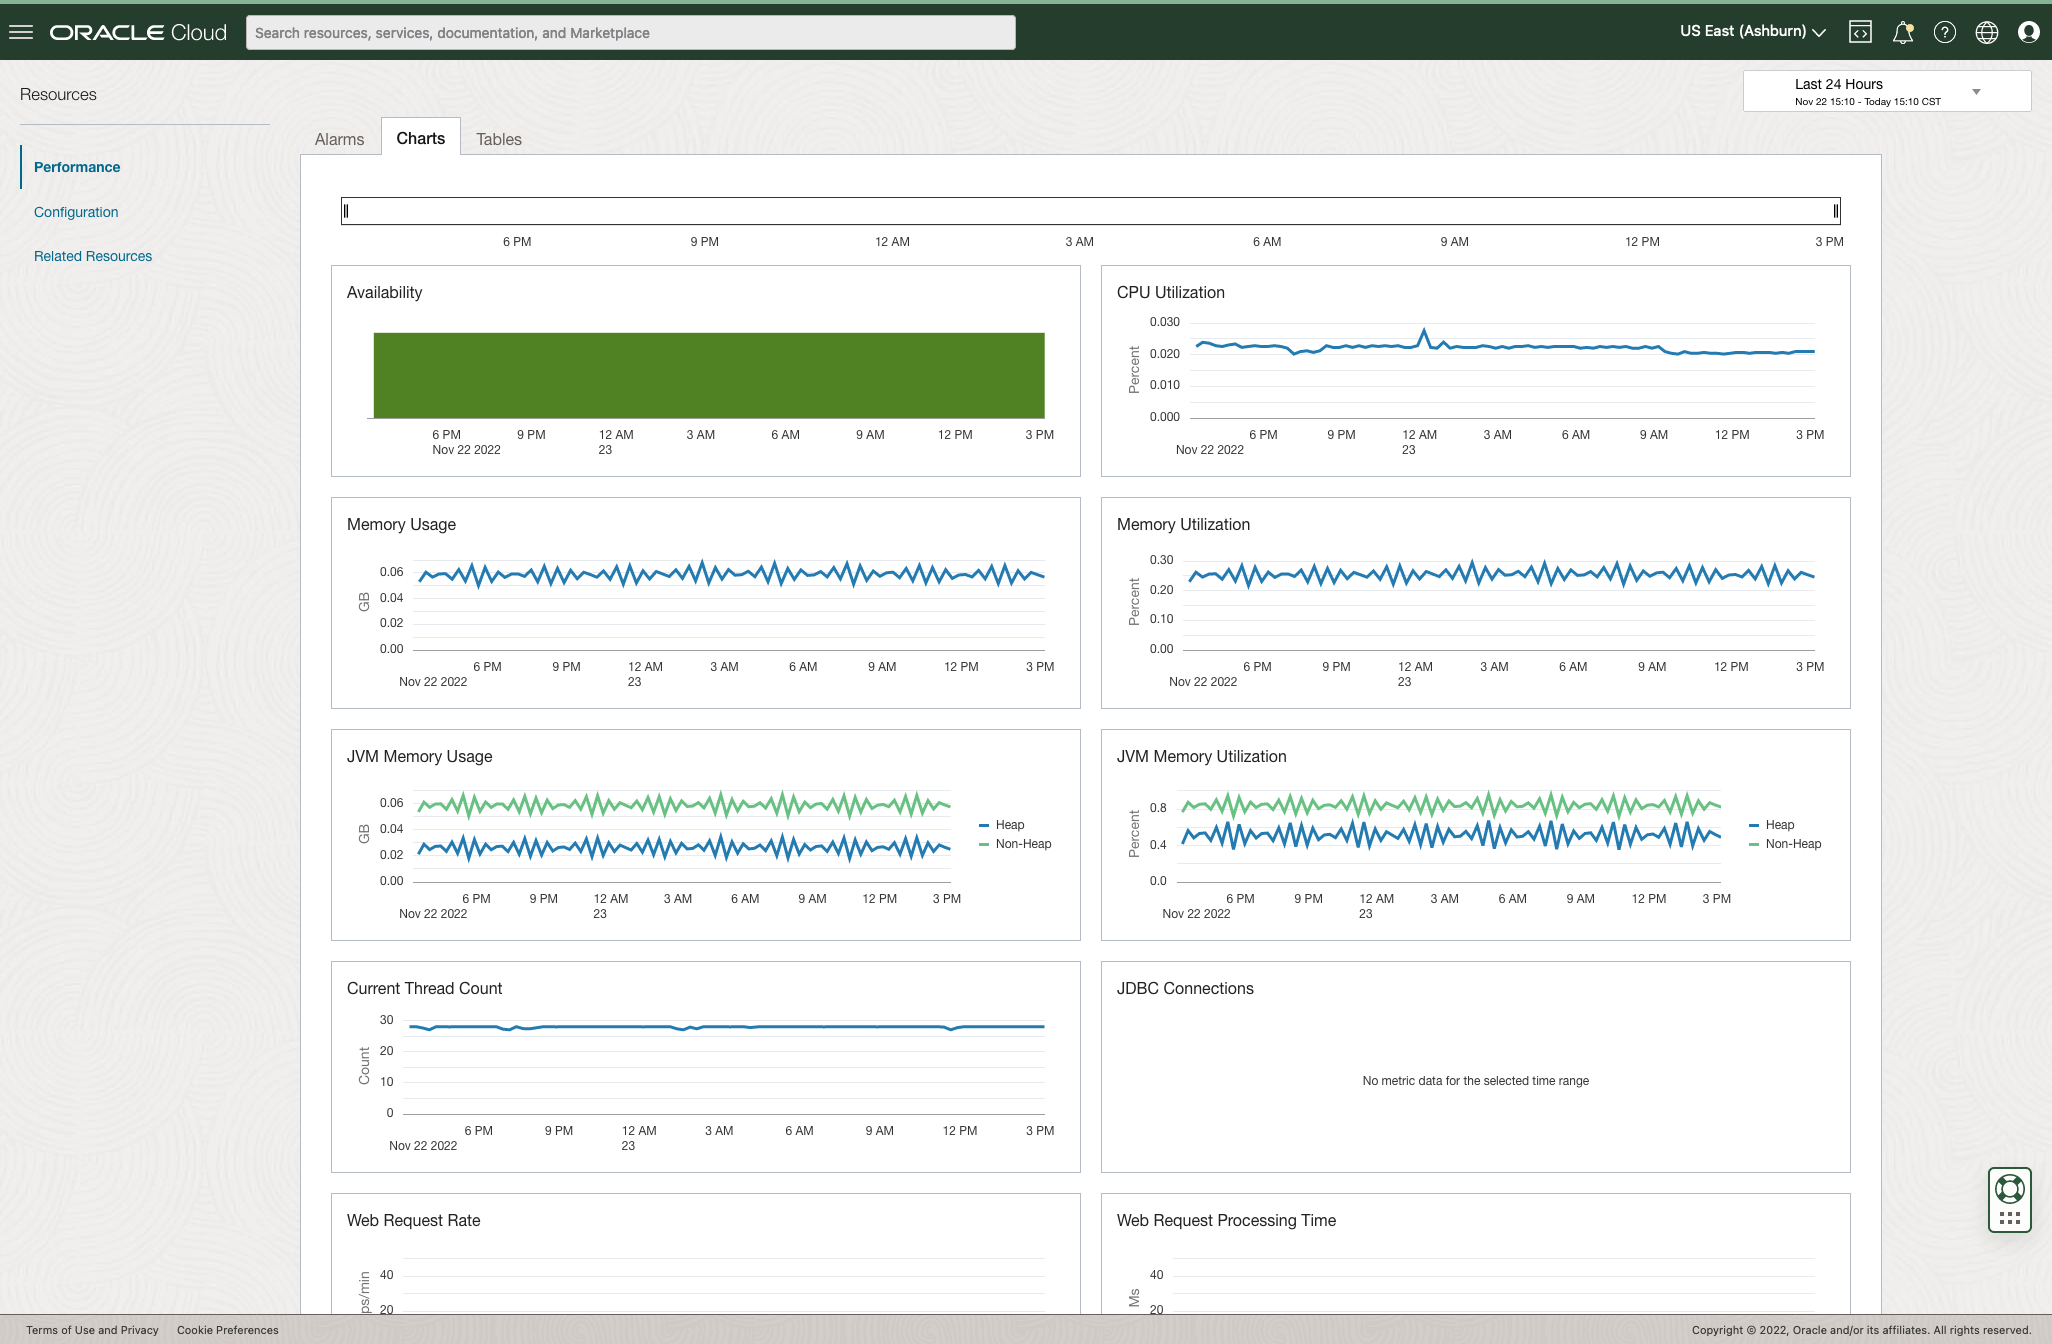
When DevOps engineers need to troubleshoot Tomcat, they spend a great deal of time and effort reviewing the JVM utilization. Stack Monitoring makes the investigation easy by providing a performance-trending capability with anomaly detection. Anomaly detection helps identify if performance is expected or relating to a possible performance problem. JVM utilization can be reviewed easily over a period of time, such as the last 24 hours. This allows engineers to identify if the change in the baseline is a slow growth over time such as a memory leak, sudden spike, or simply no change – ruling out memory as a contributor to an incident. Combining data from multiple metrics can provide greater insight into troubleshooting Tomcat. An engineer can combine Memory Usage with Garbage Collection Reclaimed Memory to determine if JVM is starved for memory.
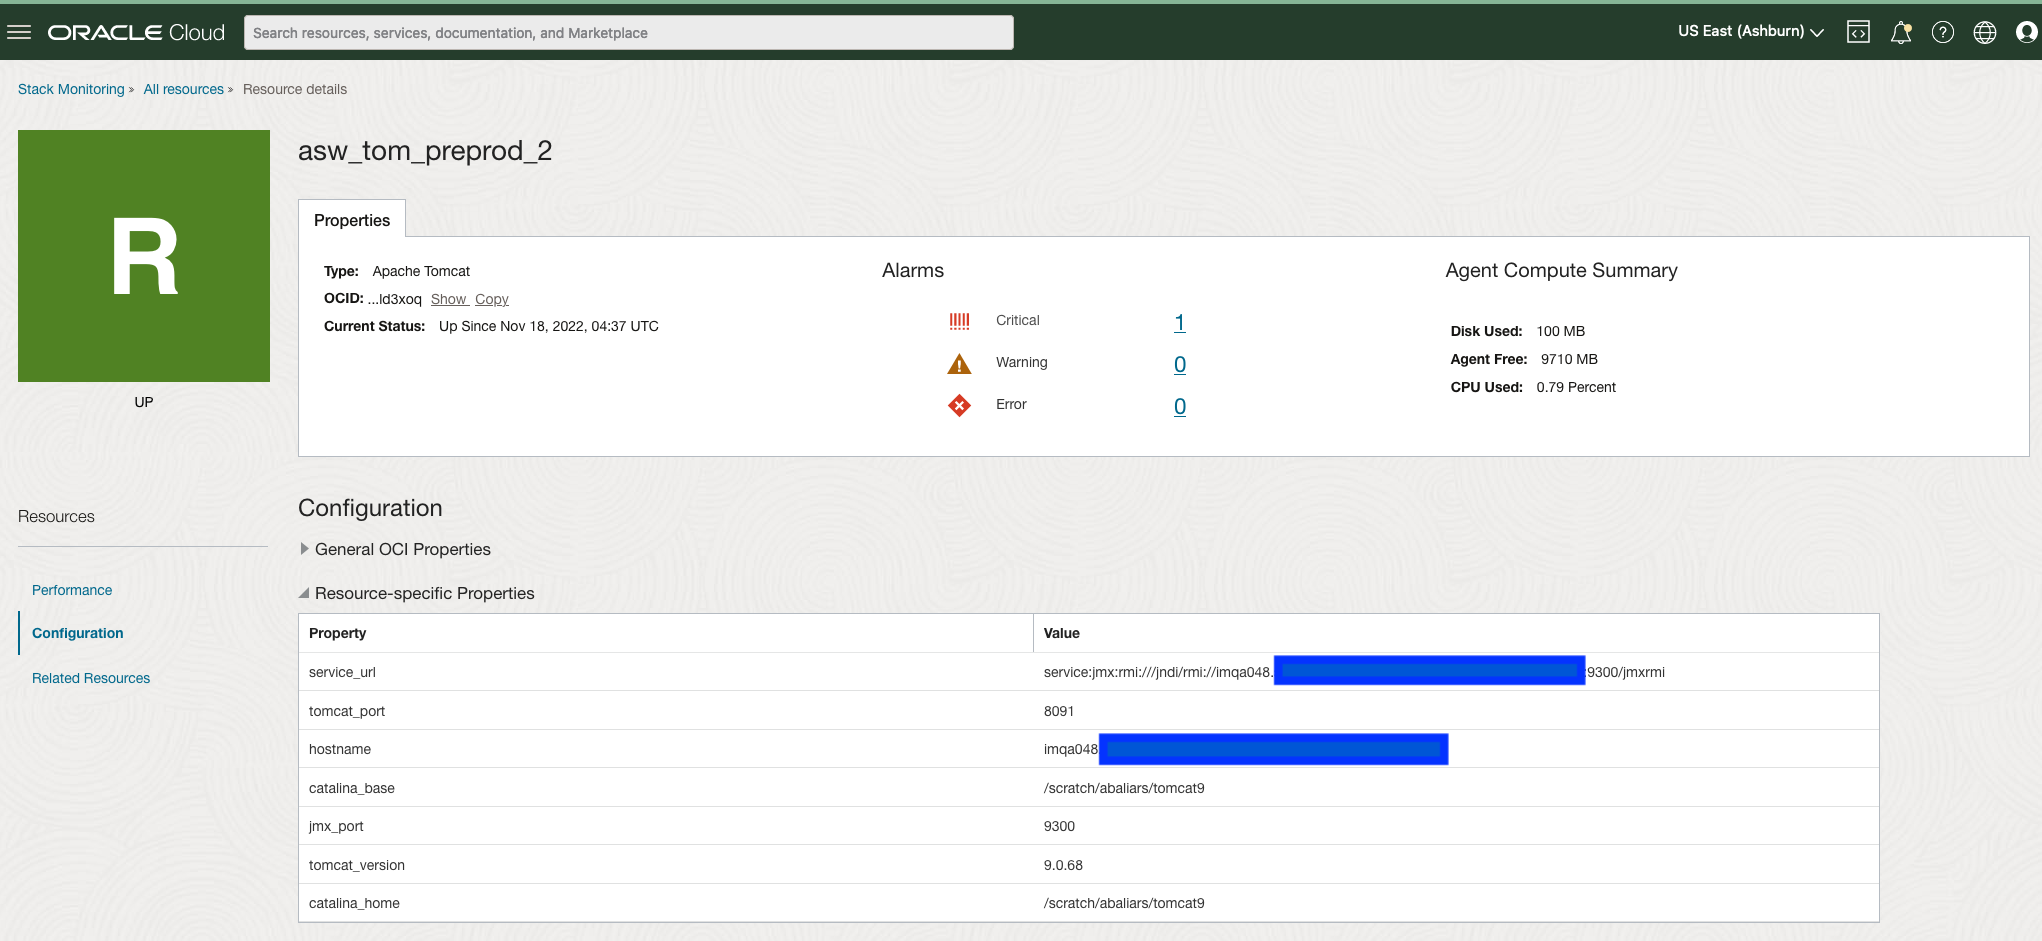
Configuration provides quick access to critical deployment details
Should the DevOps engineer receive a timeout when attempting to connect to a Tomcat application, the Configuration page provides the engineer quick access to critical details such as Tomcat port and service URL. This allows the engineer to quickly run tests to ensure connectivity is open, and locate the home directory for reviewing logs.
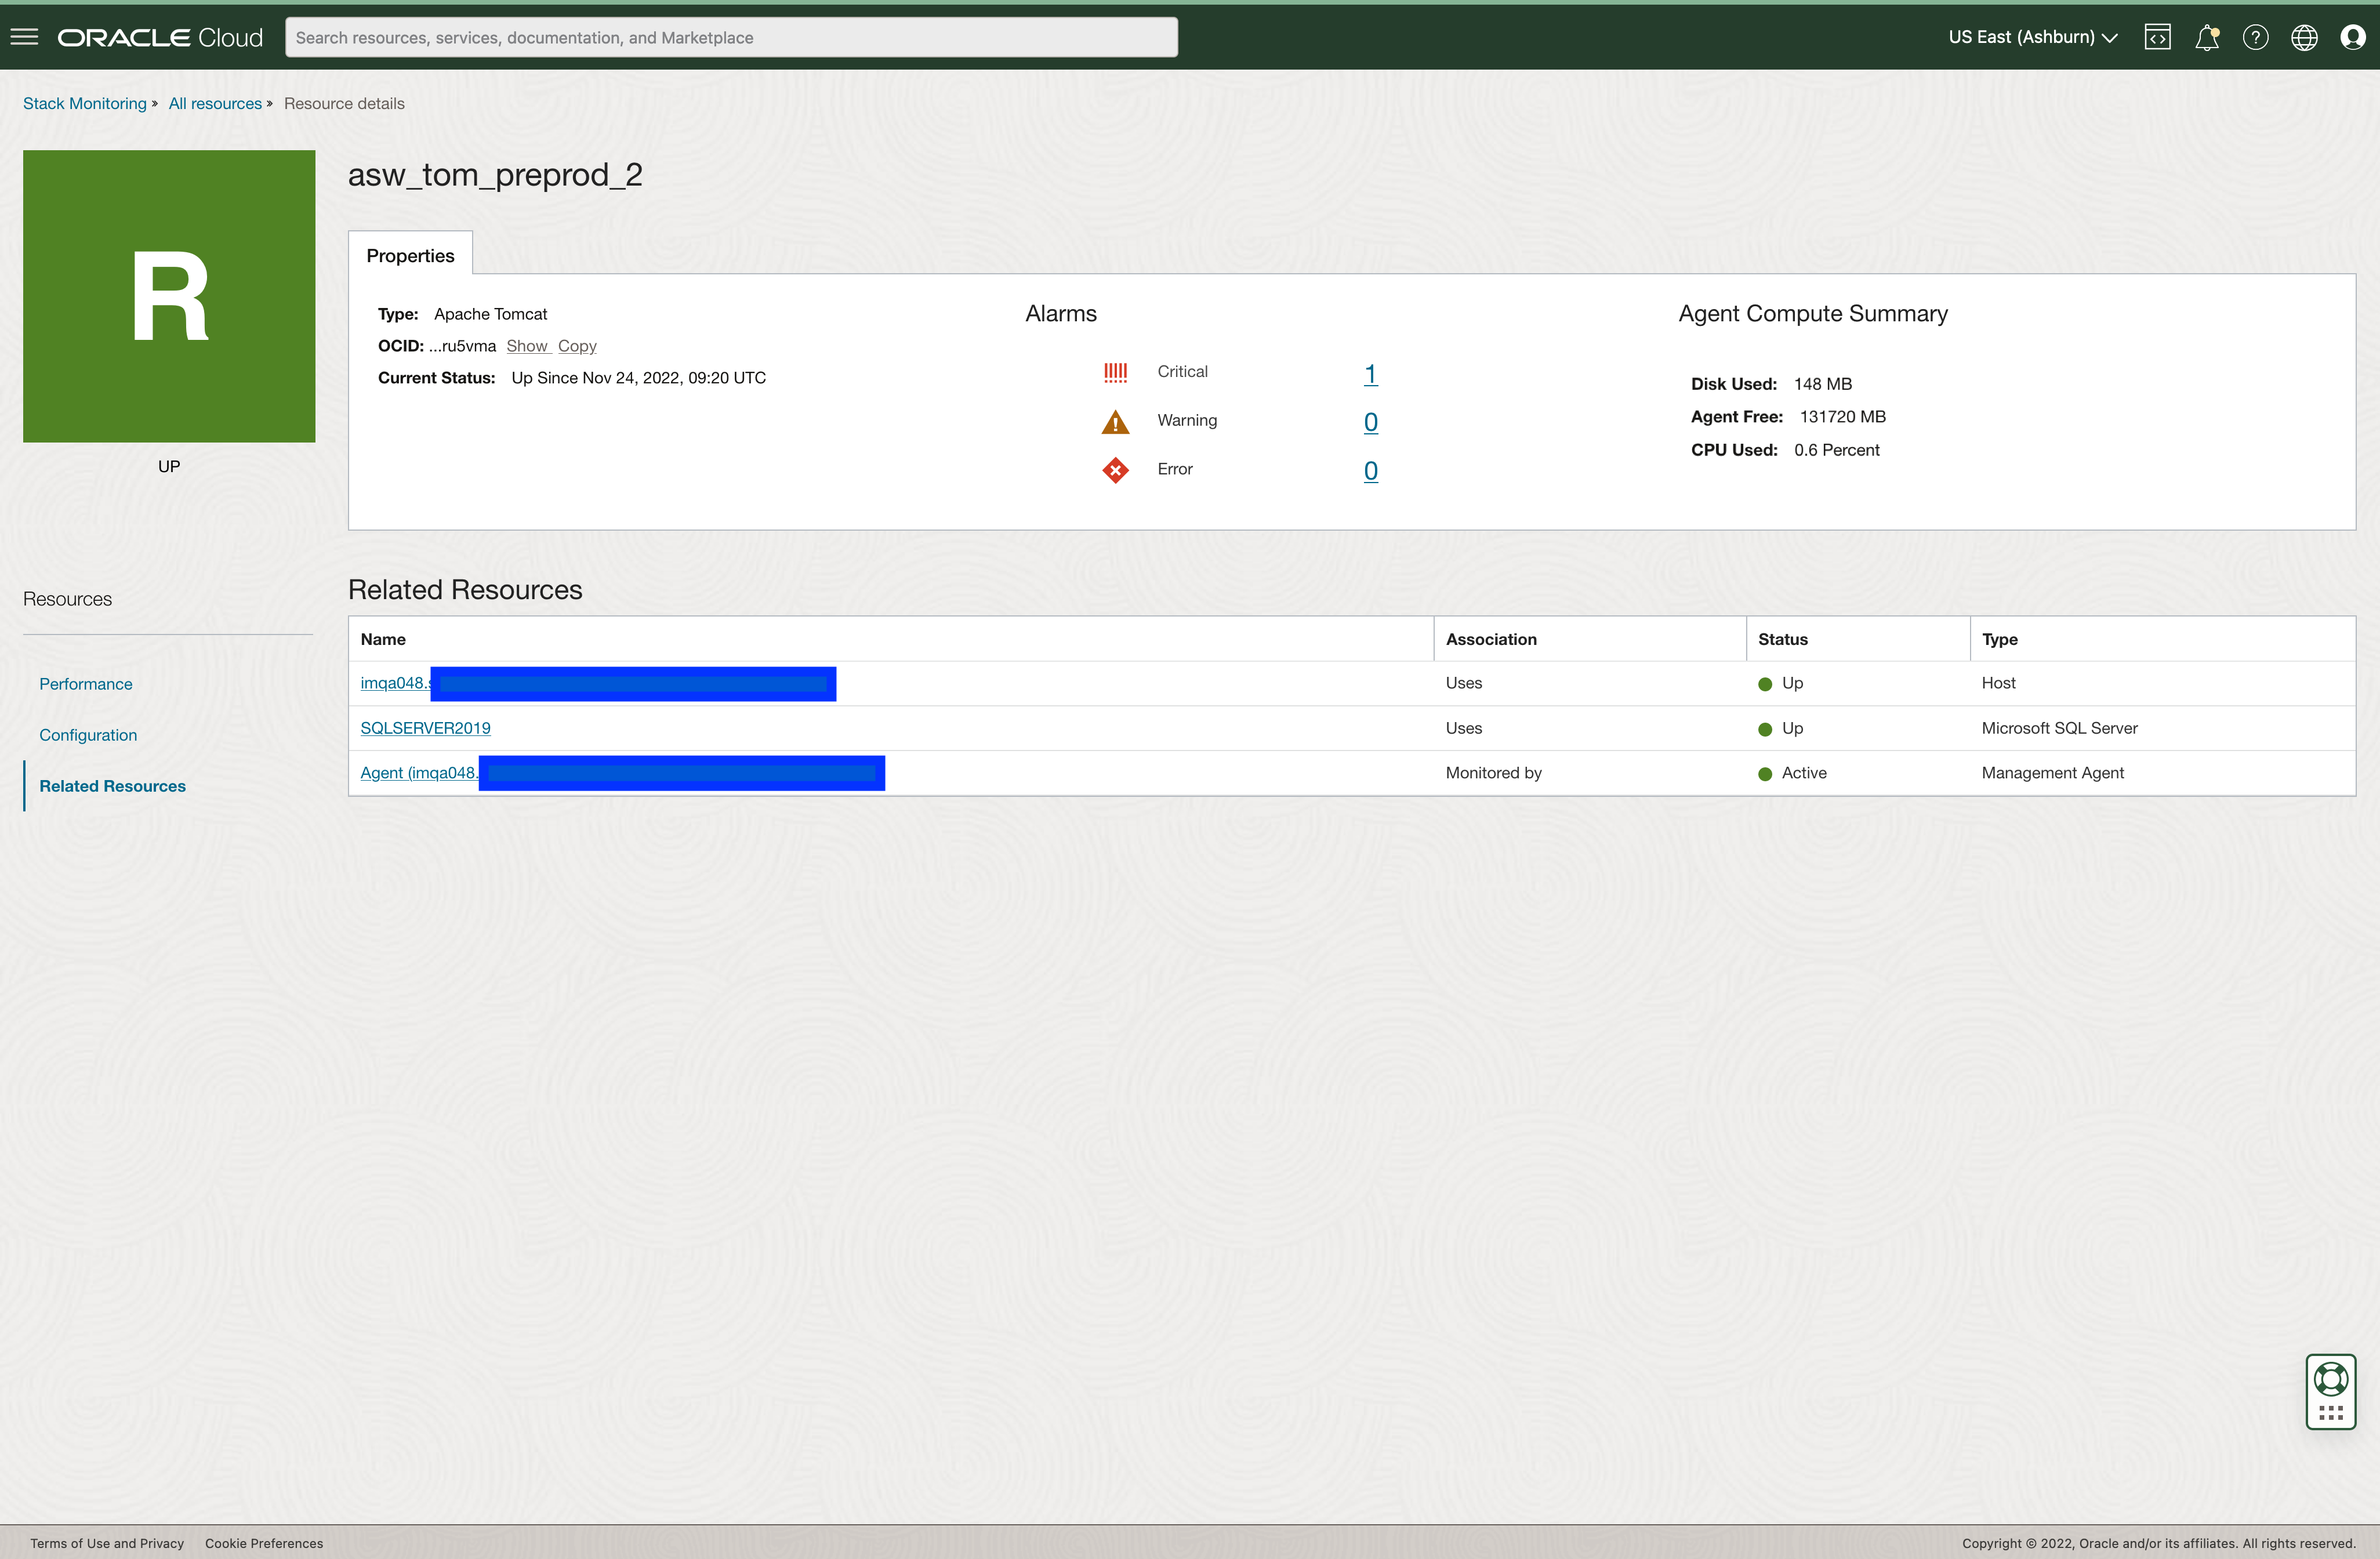
Easy navigation up and down the Tomcat’s application stack
When investigating a java application, knowing the health and performance of Apache Tomcat is one part of the puzzle. Stack Monitoring’s Related Resources page provides insight into Tomcat’s entire application stack. When investigating memory issues, a DevOps engineer can quickly identify what host the Tomcat instance is running on. Stack Monitoring provides easy navigation to the host’s homepage by clicking the host’s name, allowing the engineer to review the host’s memory and CPU utilization. Alternatively, should the engineer want to review the application’s SQL Server database performance, Stack Monitoring again provides an ability to relate the resources. Relating the resources provides a link to quickly navigate to the database’s homepage. This allows the engineer to quickly triage database-specific issues such as execution rates.
Monitoring the entire application stack is imperative to meeting today’s business SLAs. Knowing the health and performance of Apache Tomcat is crucial to meeting these SLAs. Stack Monitoring provides immediate value in many ways. From the reporting of the availability of Tomcat instances across an enterprise with the Enterprise Summary, to leveraging the out-of-the-box metrics, Stack Monitoring provides the necessary insight to meeting today’s stringent SLAs for your Apache Tomcat instances.
Get started today!