Monitoring your Oracle Multitenant database is easy with OCI Stack Monitoring. Stack Monitoring is an OCI cloud-native monitoring solution for monitoring Oracle Multitenant Container Databases (CDBs) and Pluggable Databases (PDBs). Stack Monitoring provides monitoring and alarm management of applications such as E-Business Suite (EBS) and its underlying application stack components such as Oracle Database and WebLogic Servers. The support for Oracle Multitenant further enhances this support. Stack Monitoring can discover and monitor Oracle Multitenant Databases running on on-premises hosts or on your OCI Compute instances.
Monitoring Oracle Multitenant CDBs and PDBs feature overview
Stack Monitoring’s UI enables quick and easy discovery of CDB and PDB databases. The discovery interface is made simple with fill-in-the-blanks fields. ‘Discovery’ is the onboarding of the CDB into the Stack Monitoring appilcation (discover the CDB, then discover the PDBs). The discovery automatically associates the CDB with all of the member PDBs.
The CDB homepage provides a plethora of information to help proactively monitor CDBs. The metrics provided within the CDB homepage give the necessary information to triage database issues. Easily review metrics such as Database Time, Current Logons, Logical Block Reads, and IO Throughput. Viewing historical data is easy, simply select the dropdown and choose a time period up to 14 days, or use a custom time period to review data up to 90 days. The time picker can help quickly drill into a point in time.

The CDB homepage includes a summary of alarms for the CDB and all relating PDBs. Any alarms relating to a PDB will be displayed on the CDB homepage. The Related Resource Status pie chart provides an availability summary of all related PDBs running within the CDB. Use the Members page to view the availability status of all of the PDBs in the CDB, as well as easily navigate to any PDB homepage.

Clicking a PDB name from the Members page will navigate to the PDB homepage. From this homepage, you can monitor the PDB health. The PDB homepage provides a quick access to critical health information about the PDB. Quickly view the database CPU time or gain visibility into the tablespace utilization. Quickly determine if the performance is expected using baselines with anomaly detection. And similar to the CDB homepage, historical performance can easily be reviewed by selecting the dropdown, or by sliding the time picker. Sliding the time picker pinpoints a specific time period for investigation.

Proactive monitoring and alarms of Oracle Databases
Easily monitor your entire fleet of Oracle Databases with Monitoring Templates. Monitoring Templates help reduce downtimes and shorten incidents with out-of-the-box Oracle-certified monitoring best practices for the entire Oracle Database system and the underlying hosts. In this example, a notification was sent when a PDB tablespace utilization was greater than 80%.

Full Stack E-Business Suite Monitoring with Oracle PDB
When using a PDB as the EBS database, Stack Monitoring can monitor the PDB as part of the application stack. The recommended workflow is to 1) discover the CDB, 2) discover the PDB within the CDB, 3) discover the EBS application. The EBS workflow discovers the EBS application and its components (Forms System, Workflow System, and Concurrent Manager) and the WebLogic Servers. Then the EBS workflow creates the dependency association between the EBS application and the PDB. The result of this discovery is a fully formed application topology. Following the discovery, navigate to the EBS homepage to view and monitor the entire EBS application from one location.
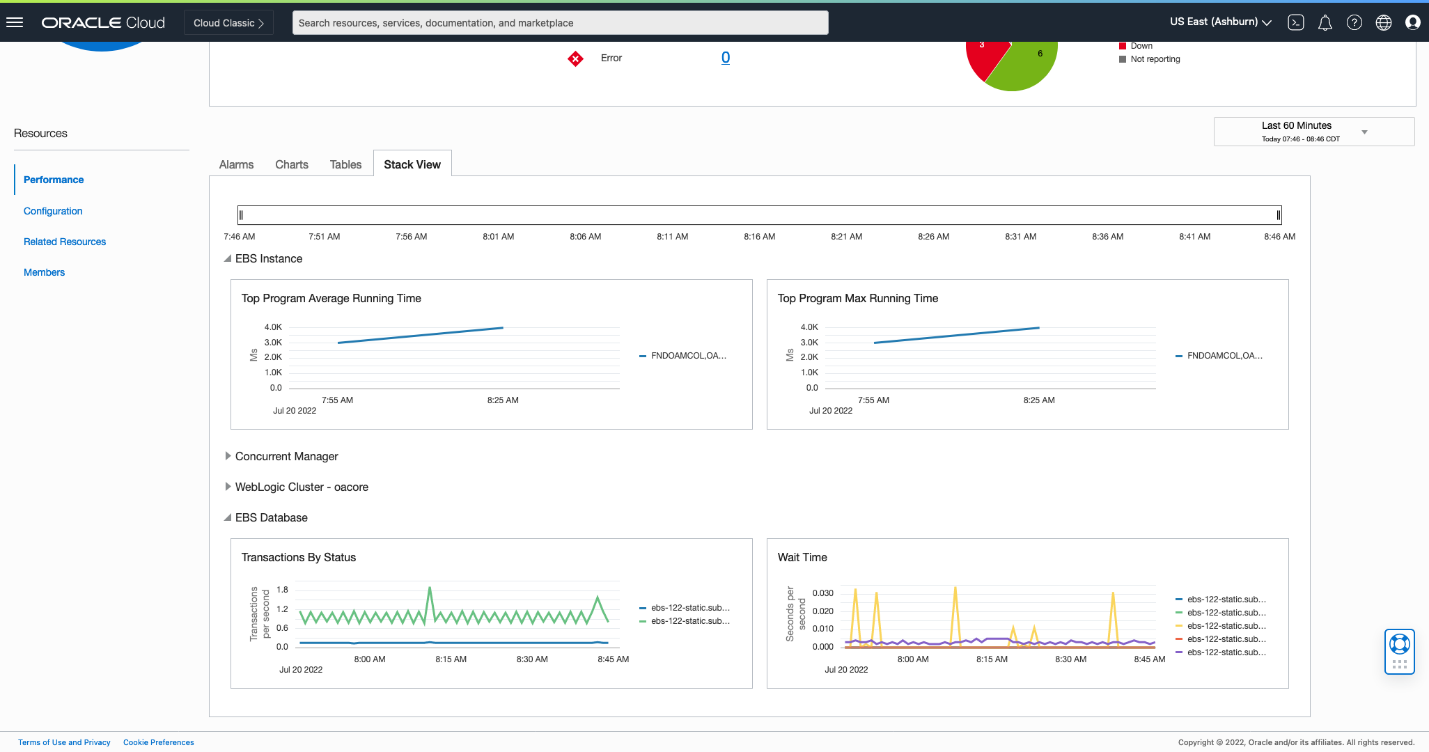
The EBS homepage provides a holistic view of an entire EBS application. This includes alarms, availability status of all EBS components, configuration details, and performance metrics of the EBS application, WebLogic Server, and the PDB. The EBS homepage has a Stack View page which provides detailed information on critical performance details of the entire EBS application stack. This view includes a grouping of specially curated charts to quickly review and diagnose performance problems within the EBS application stack. Charts in the Stack View include Top Programs by Running Time of the EBS application, Completed Concurrent Requests from the Concurrent Manager, JVM memory utilization of the WebLogic Servers, Transaction rate by status, and Wait Time from the PDB. All this data in one place and out-of-the-box!
Get started onboarding Oracle CDBs and PDBs in Stack Monitoring today!
Find Stack Monitoring in the Observability and Management menu in the OCI Console, under Application and Performance Monitoring. The service is accessible through the Console, CLI, and REST API and is already available in all commercial regions.
Resources
Stack Monitoring Documentation
Stack Monitoring release announcement