Stack Monitoring just added support for Microsoft SQL Server. Let’s review together how this capability can help identify performance problems faster and reduce downtime in your SQL Server environments. Stack Monitoring is a full-stack monitoring solution, part of Oracle Cloud Infrastructure’s (OCI) Observability and Management Platform. DevOps engineers and DBAs can use it to easily identify problems and reduce downtimes.
Getting started with SQL Server discovery made easy
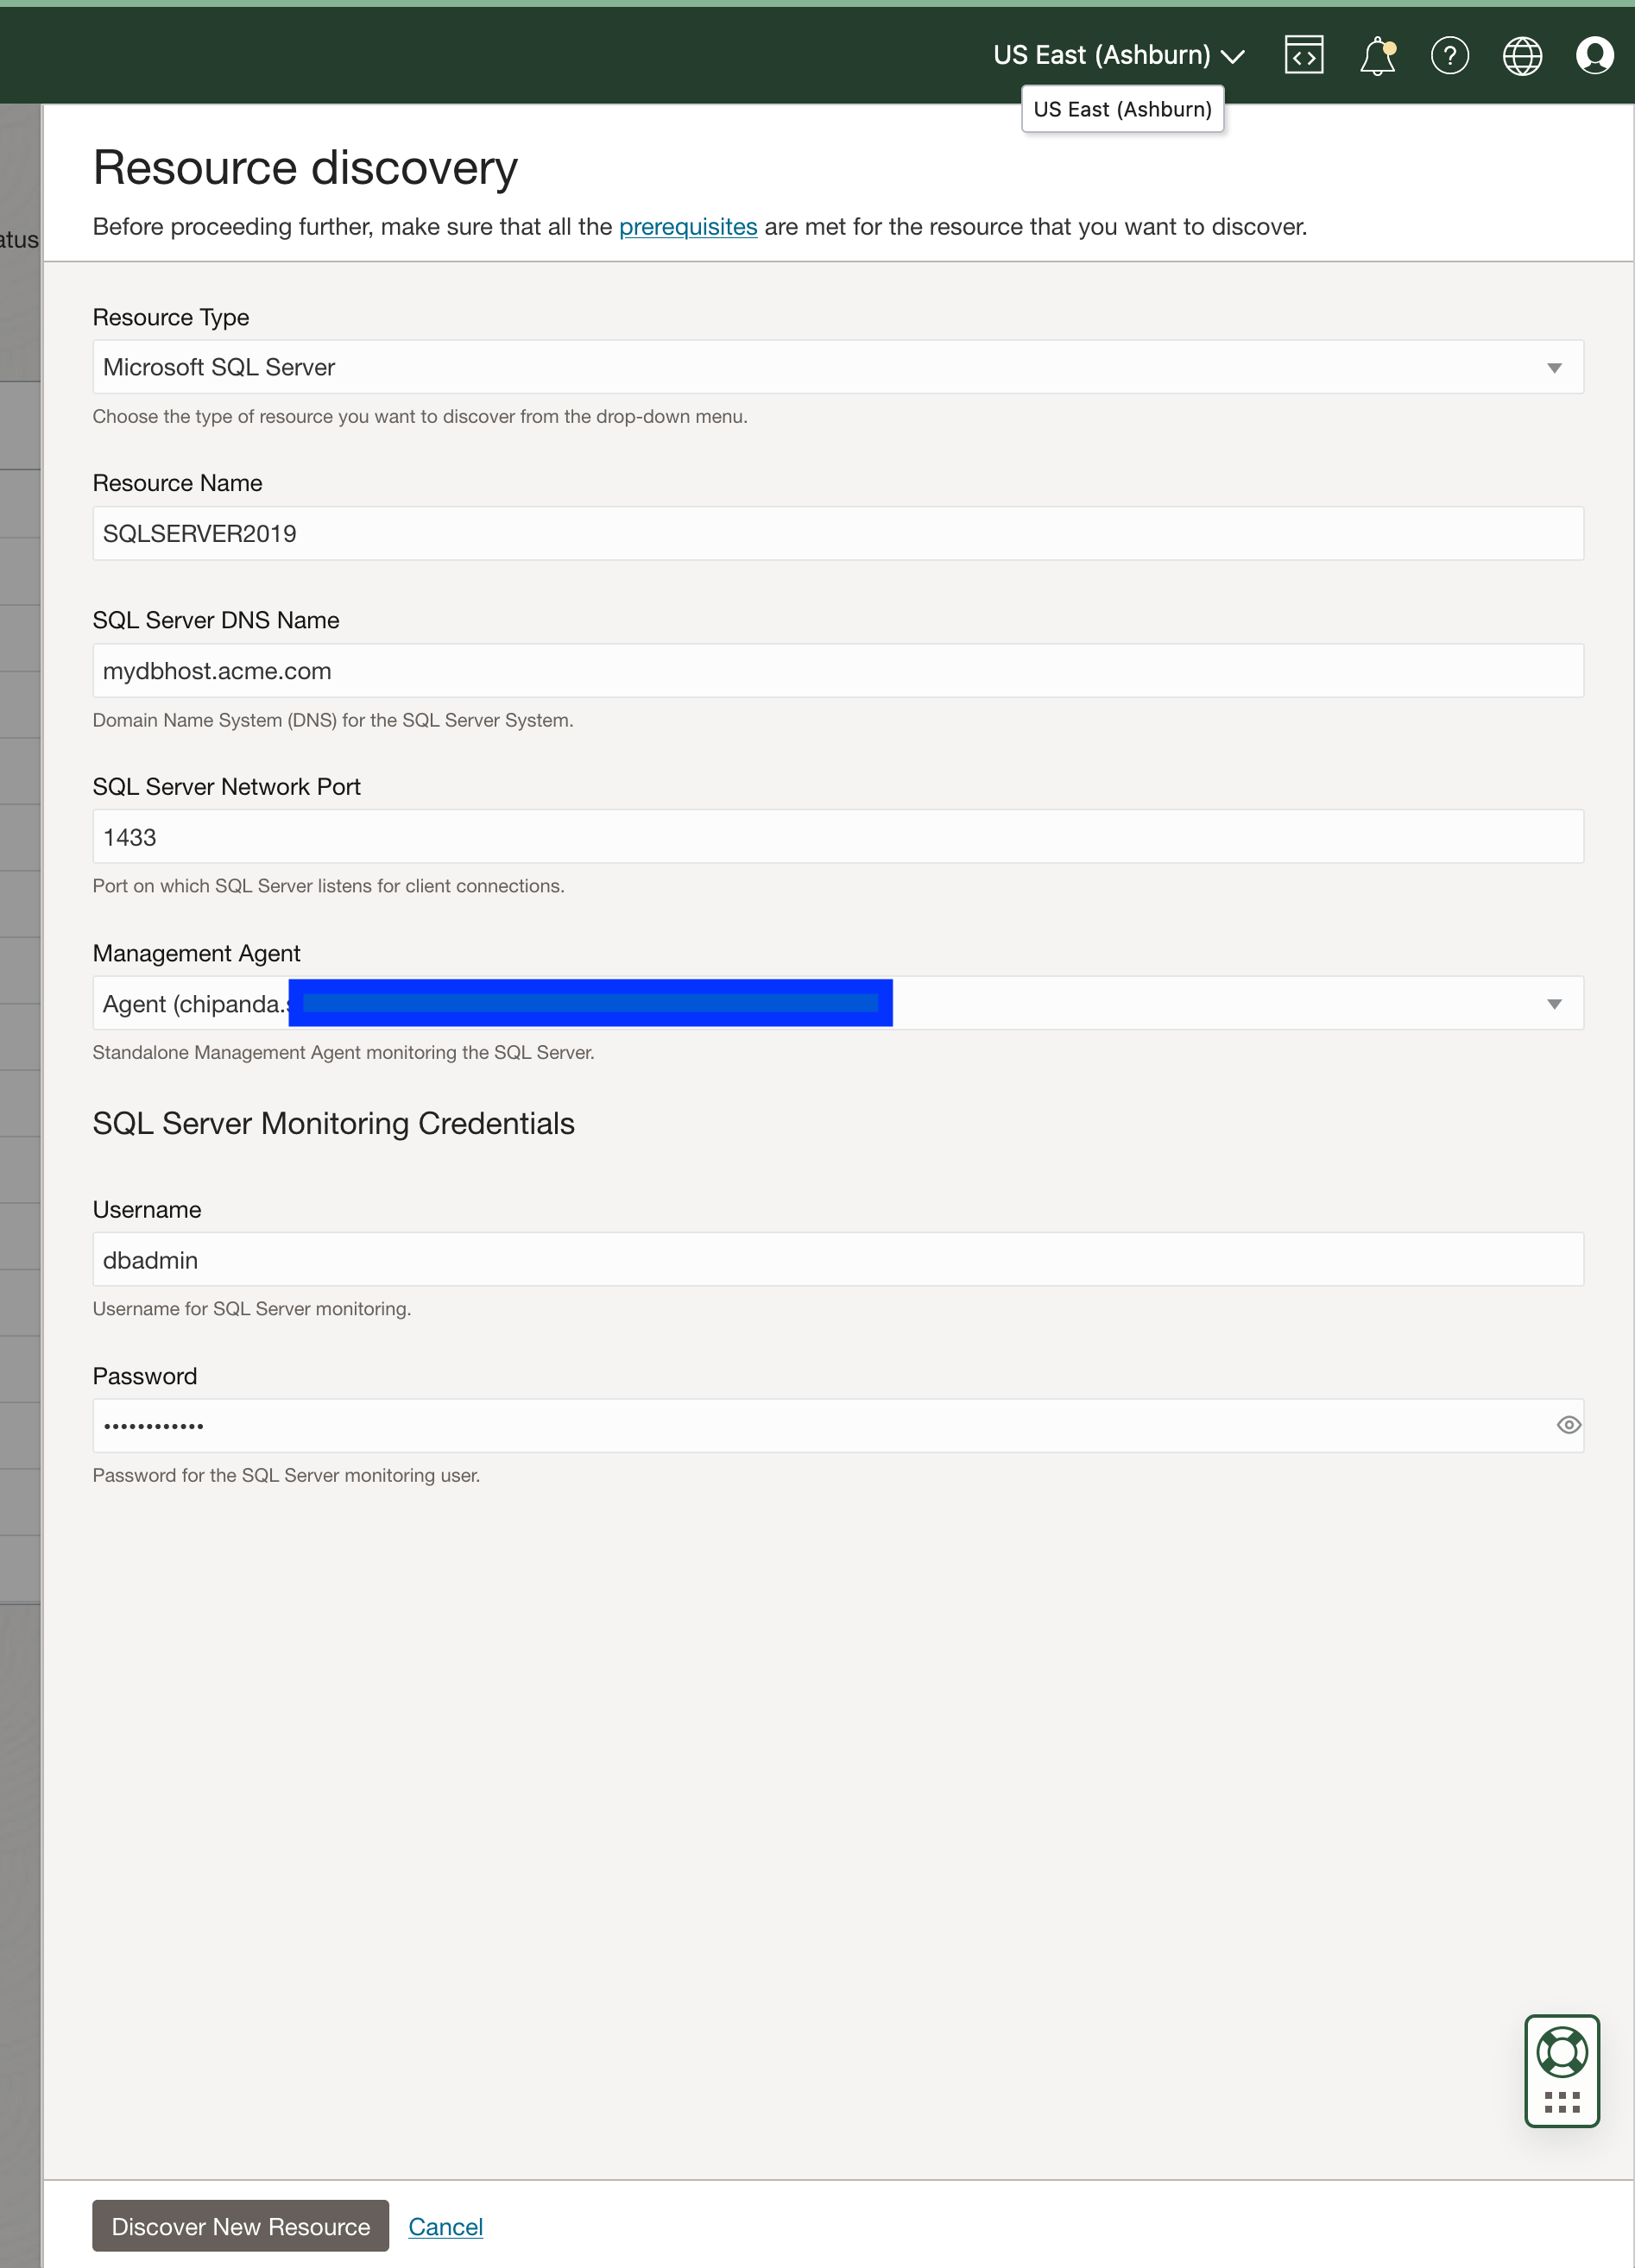
The discovery of a SQL Server database can be completed with a few clicks using the fill-in-the-box UI. Simply fill in the required fields, such as server name, port, and username/password, and click discover. Stack Monitoring will submit a job that onboards SQL Server into Stack Monitoring. The discovery job progress can be viewed at any time from the Resource Discovery page. Once the job completes, a new SQL Server homepage is created, and Stack Monitoring immediately begins collecting health and performance metrics.
Home pages provide insight into the health and performance of SQL Server
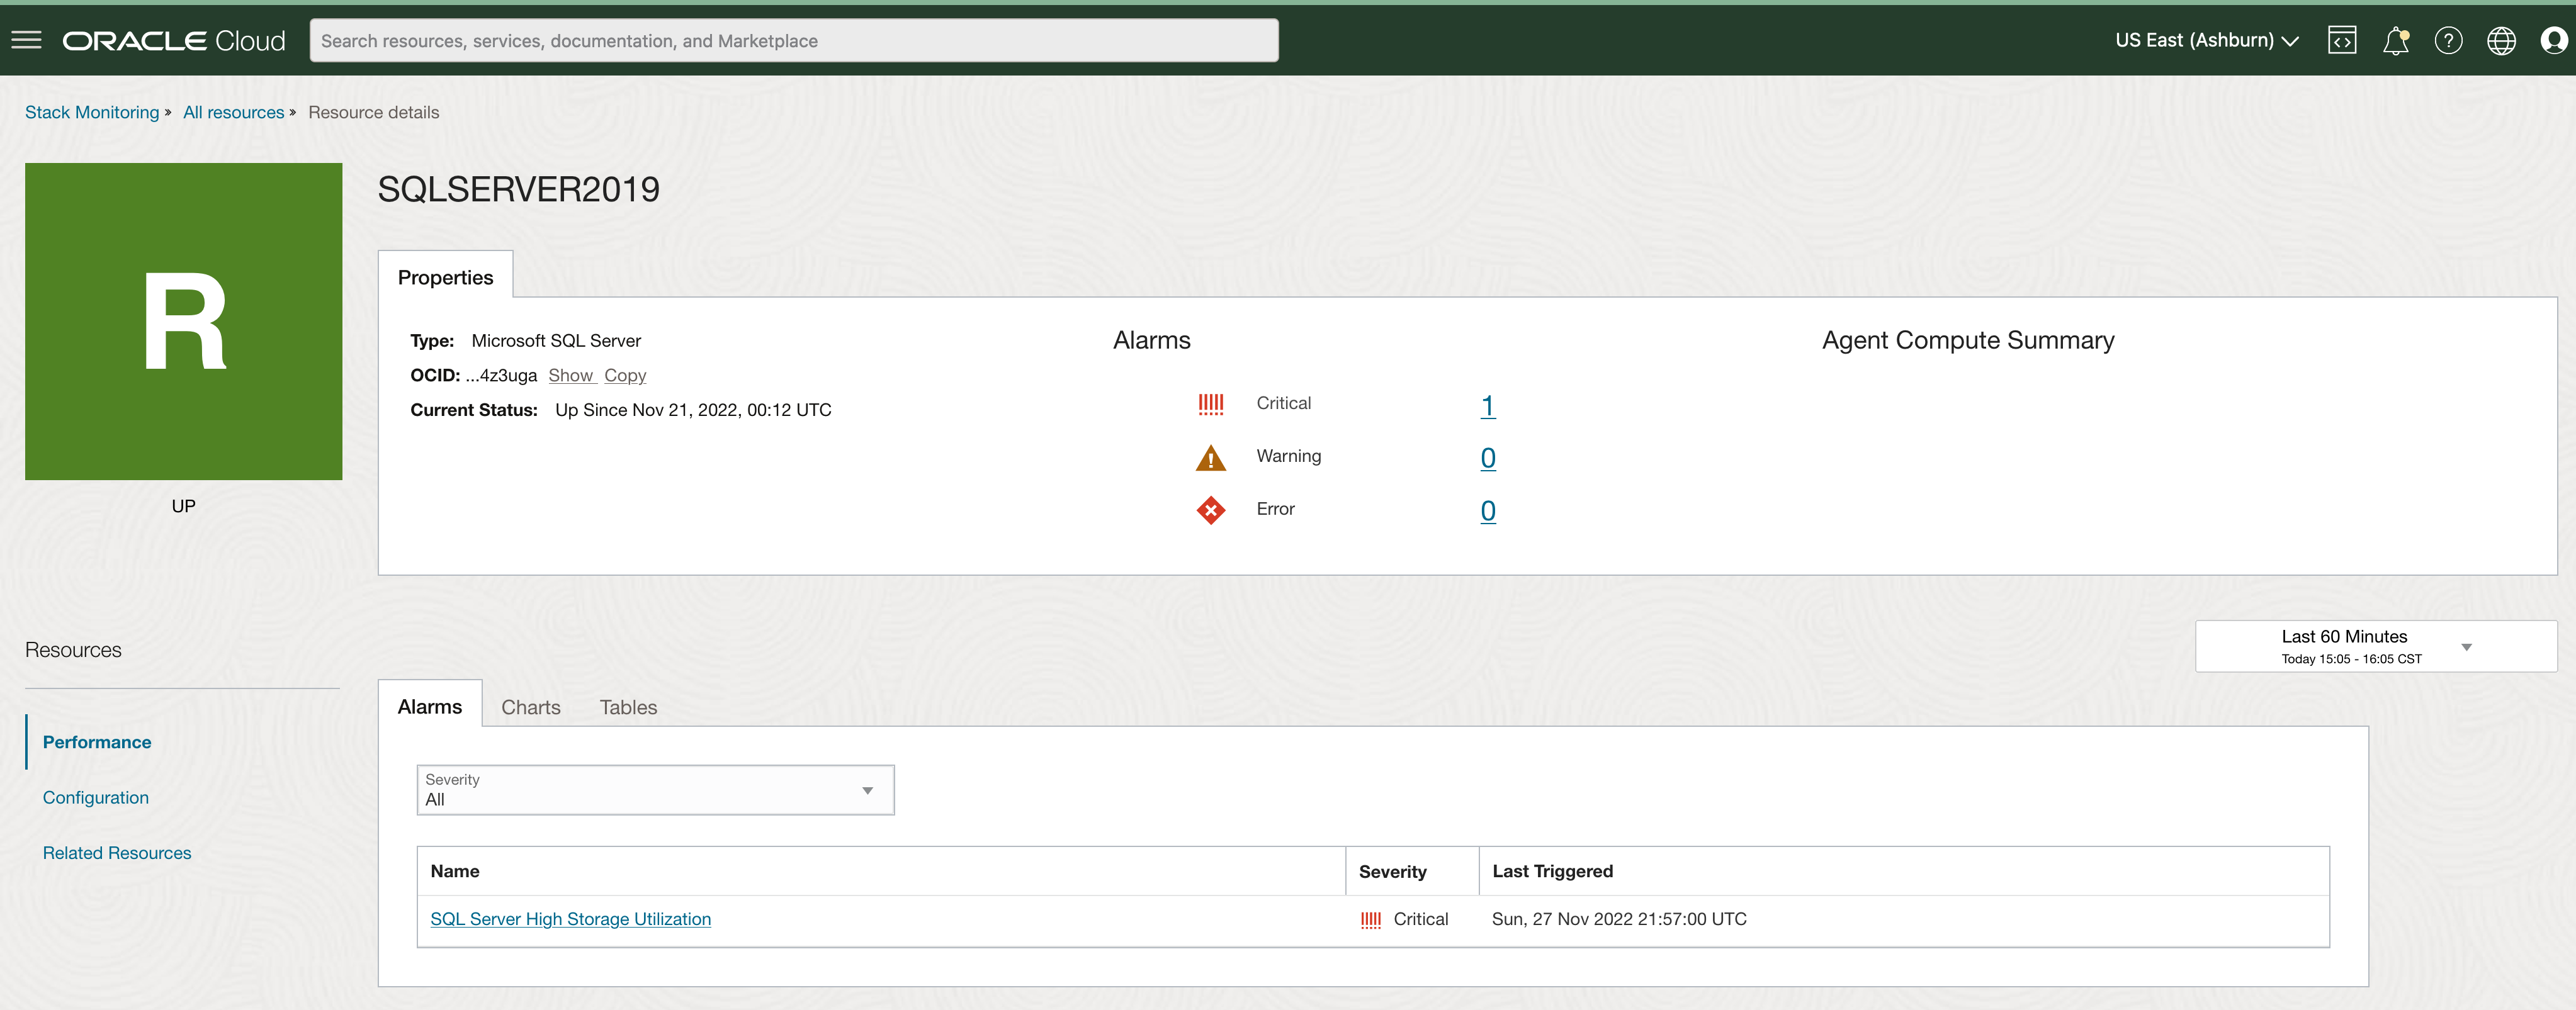
Stack Monitoring’s home page provides critical metrics to aid in the determination of the health and performance of a SQL Server database. The SQL Server home page summarizes open alarms by severity as well as providing a detailed list of all open alarms. Clicking an alarm name, such as SQL Server High Storage Utilization, opens a new tab within the OCI notification service providing additional information into the alarm and the firing state.
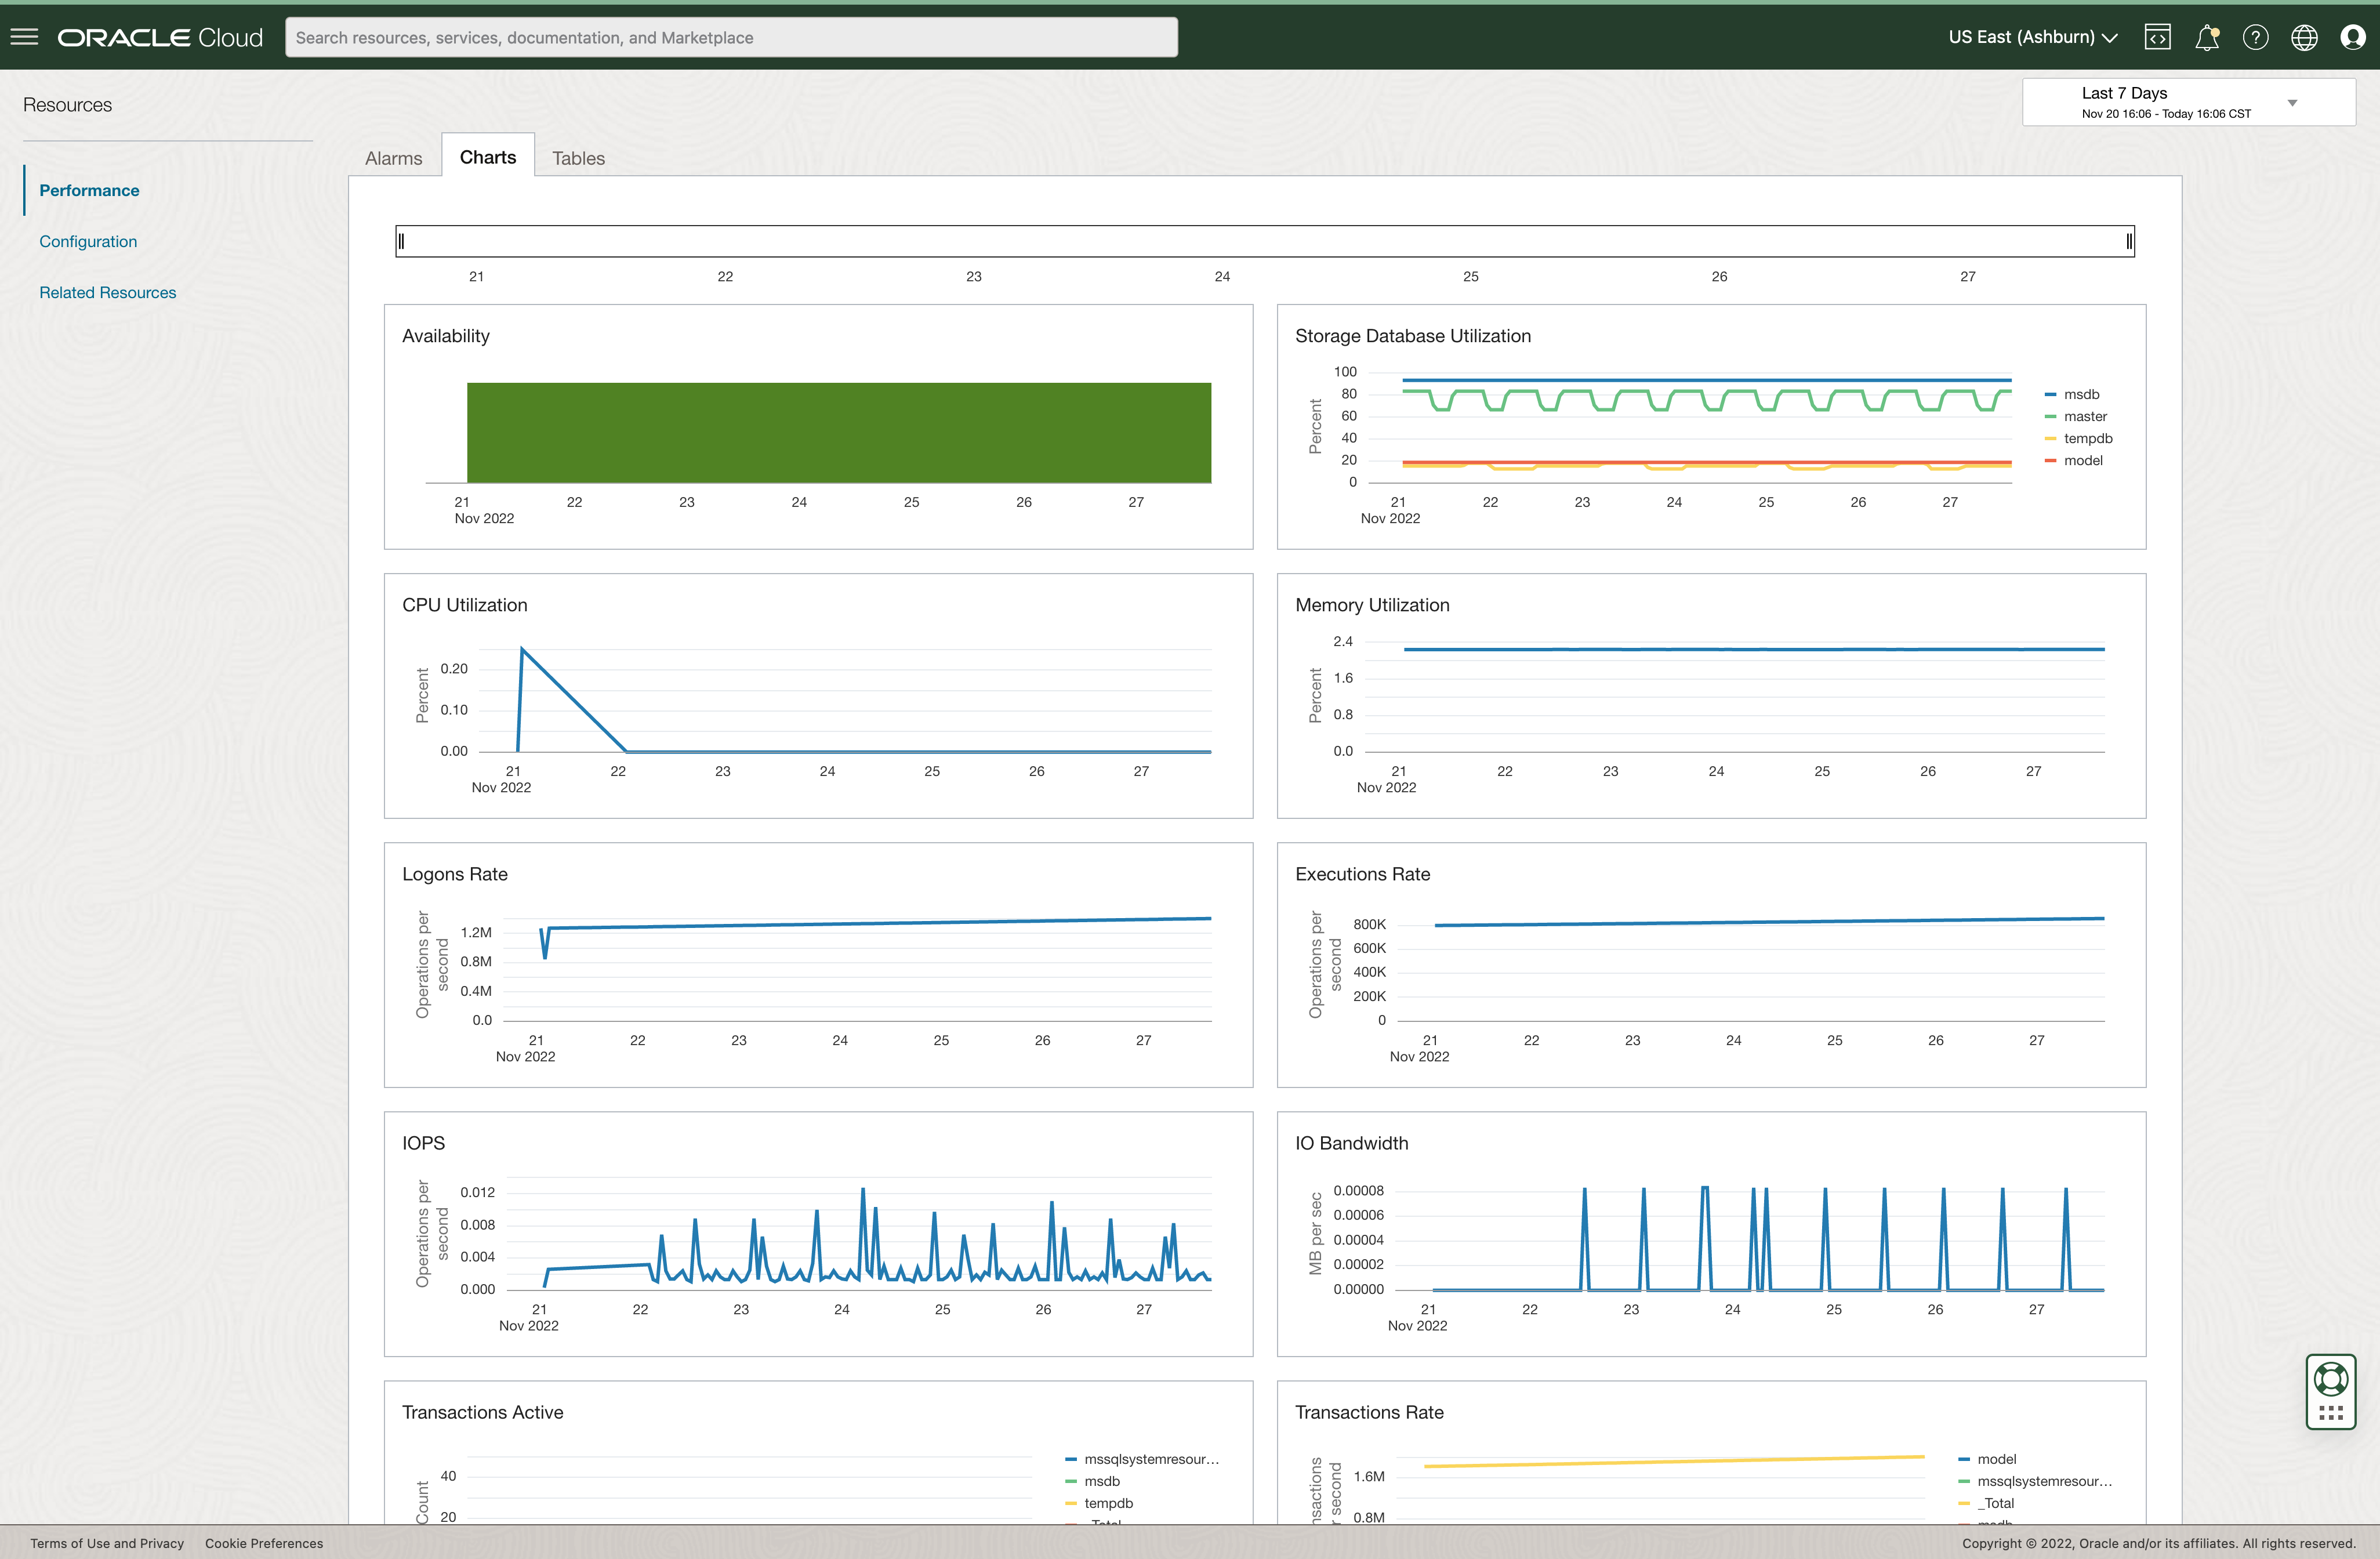
When an alarm e.g., SQL Server High Storage Utilization has triggered, DBAs and DevOps engineers can leverage Stack Monitoring’s curated metric charts with anomaly detection to provide details in understanding the context of the alarm and making timely decisions. Engineers can use the time picker to easily trend the storage utilization over a variety of timeframes including the last 7 days. When investigating high storage utilization, combining data from multiple metrics (CPU, IO, memory, etc.), provides necessary context to make actionable resolutions. In the figure below, the Storage Database Utilization metric shows no growth over the last 7 days and the Execution Rate appears steady. The database does not appear to be busier than normal, and the growth is slow, this may suggest a smaller amount of additional space may need to be added to the SQL Server database.
Tables provide additional dimensions to metrics
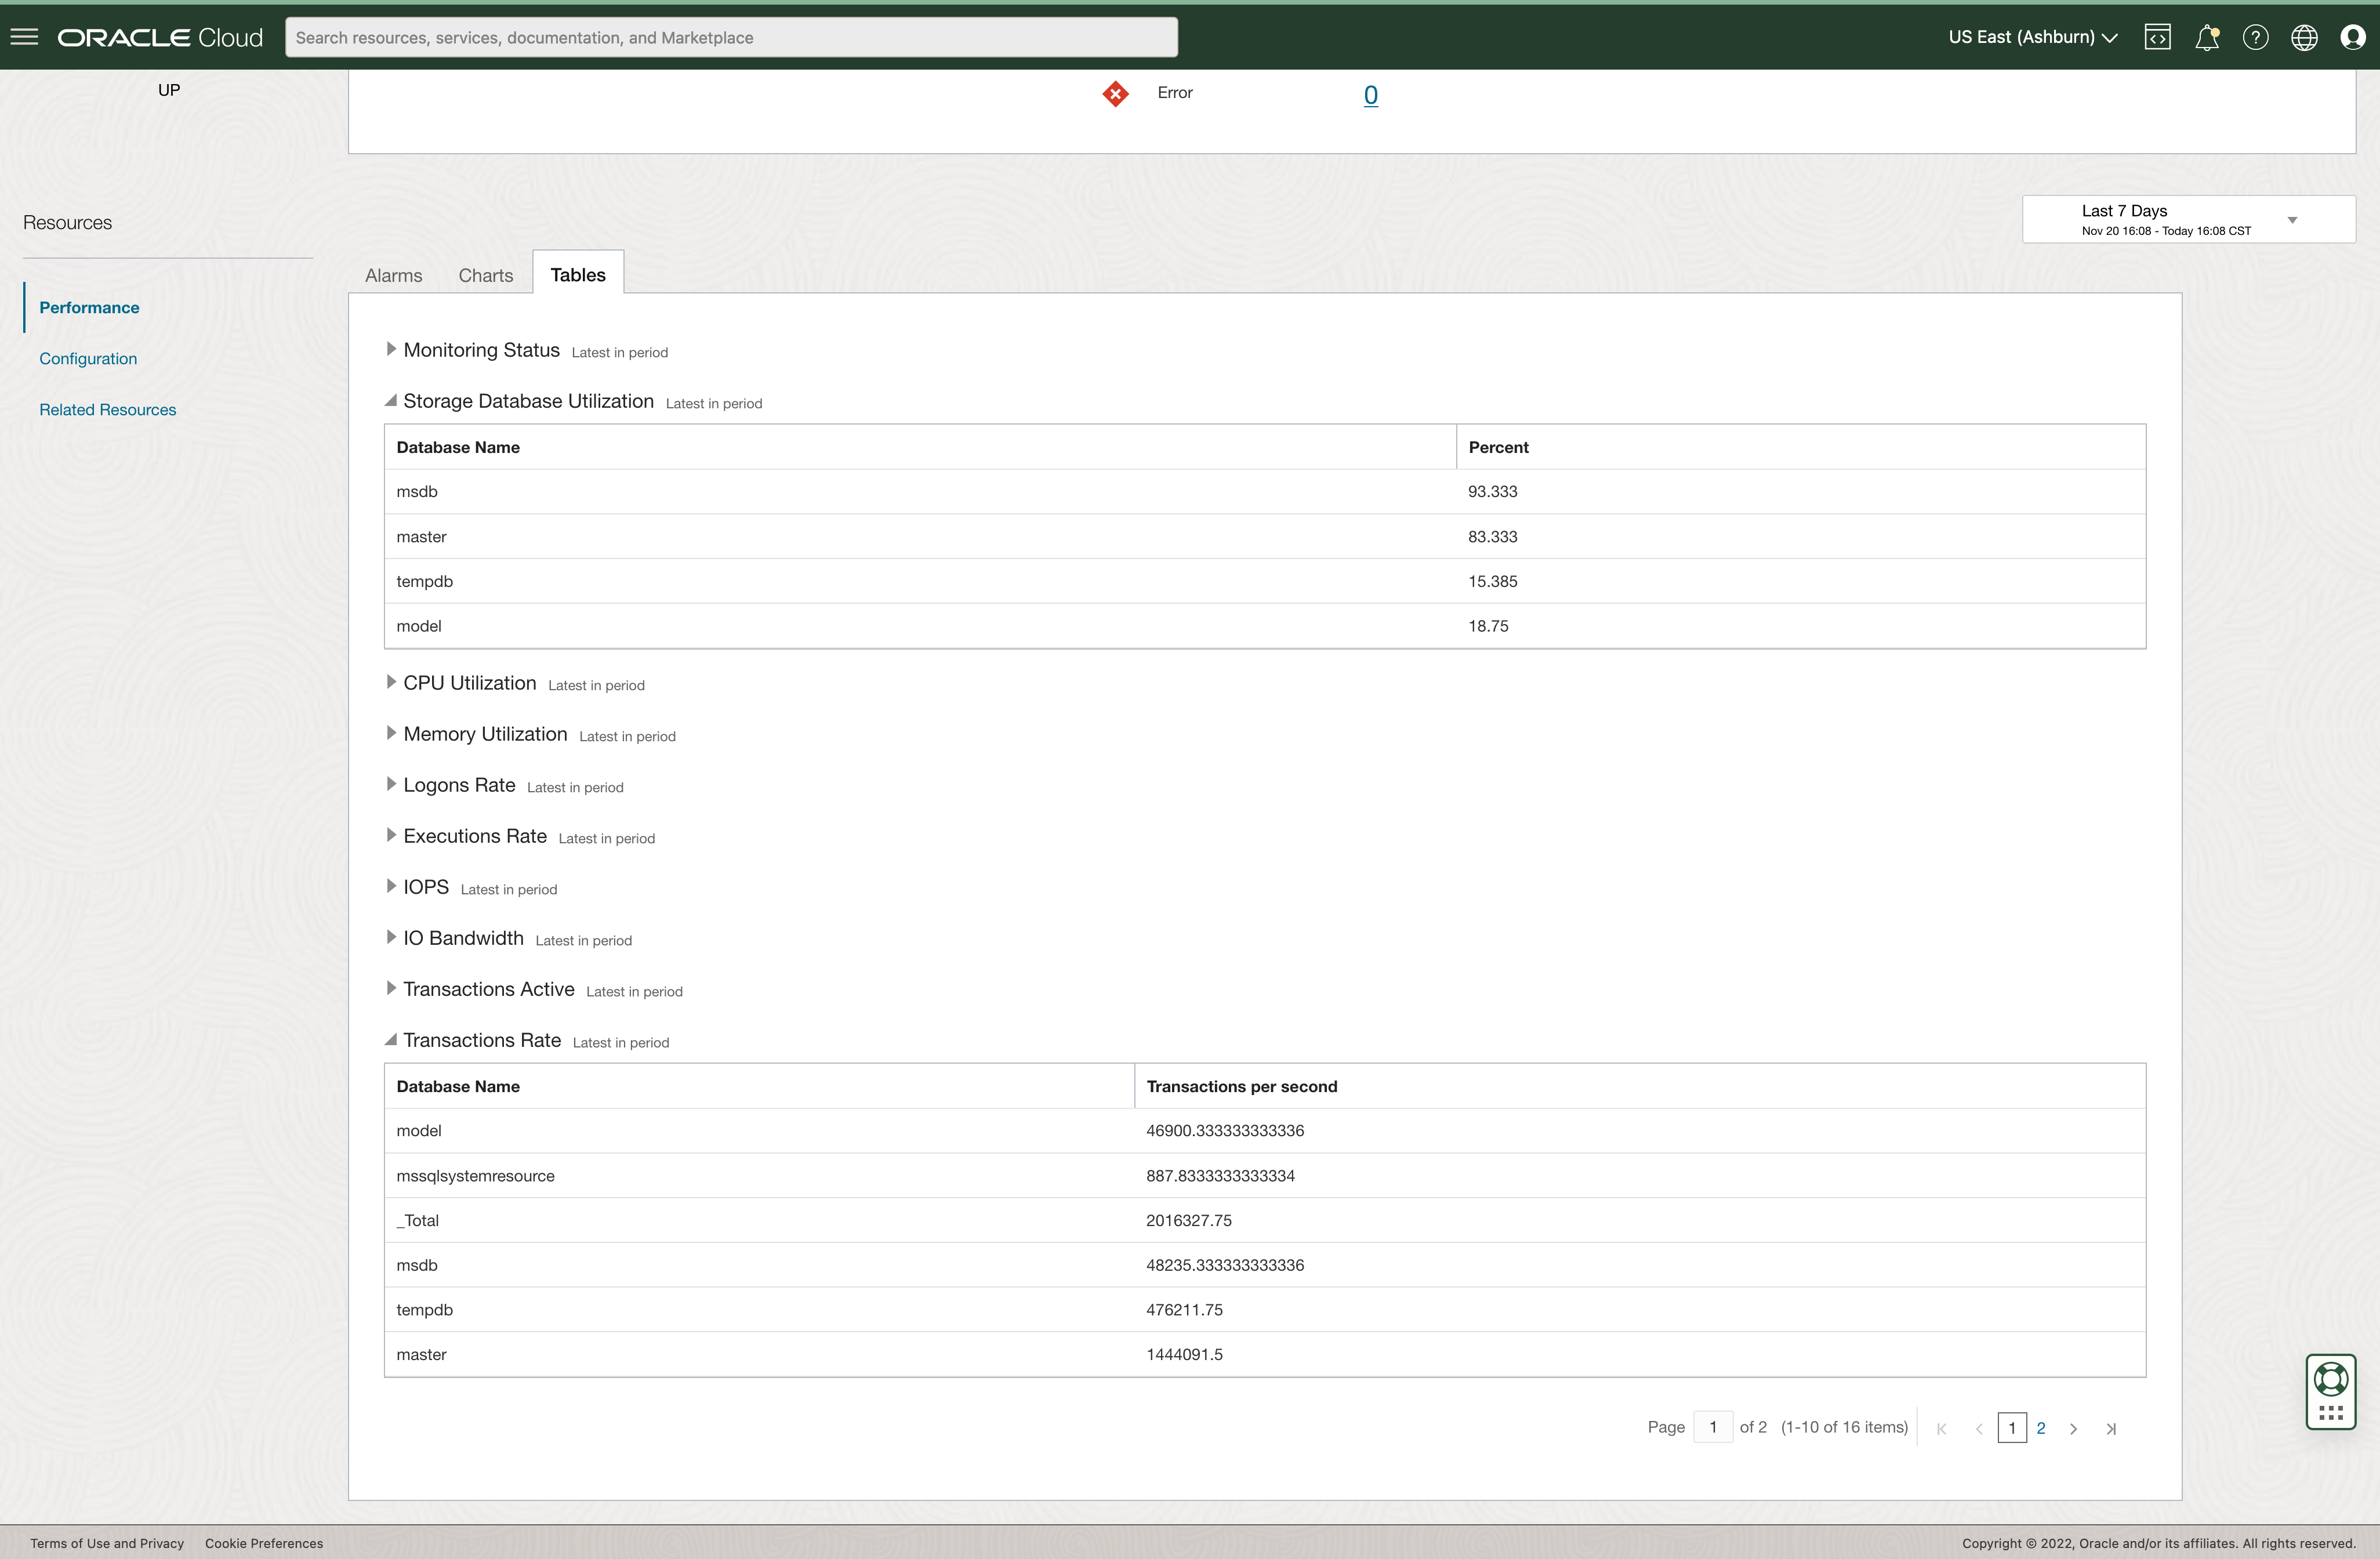
Stack Monitoring’s Tables provide all dimensions of any given metric. This becomes especially useful when reviewing metrics such as Transaction Rate. Tables provide the ability to see the transaction rate of every database contained within this SQL Server instance.
Navigating the application stack for holistic monitoring
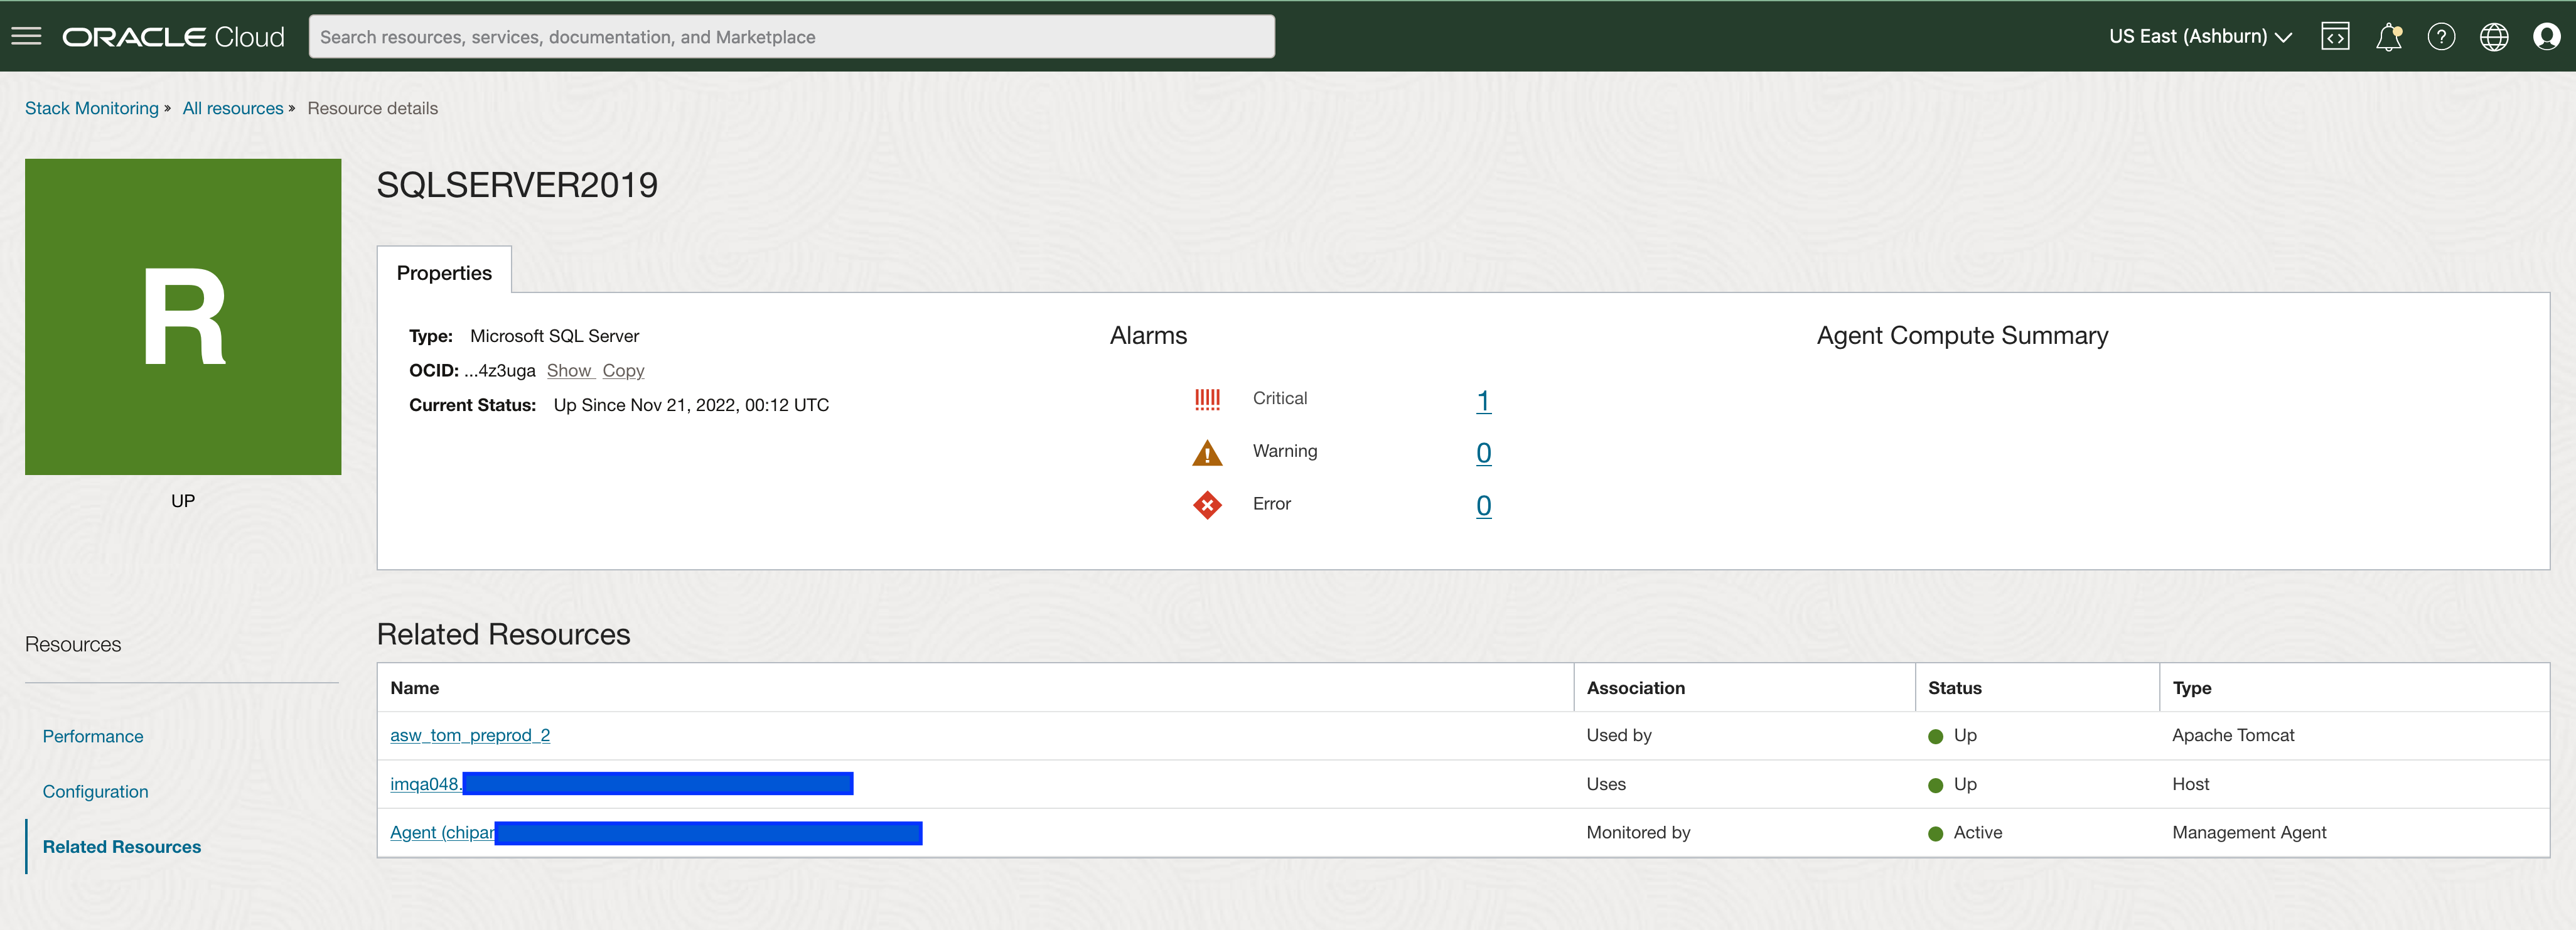
Stack Monitoring provides the ability to build relationships with the SQL Server database. These relationships can include the SQL Server’s host and the application tier that uses the database and are viewed within Stack Monitoring’s Related Resources page. Once the associations are created, Related Resources help provide a quick understanding of what uses the database and easy navigation up and down the application stack. This is especially helpful when troubleshooting application performance issues, to quickly review the performance of the entire application stack.
Understanding the health and performance of SQL Server is critical to the holistic monitoring of an application stack. Stack Monitoring provides the insight to evaluate SQL Server performance problems and the information necessary to take action, resulting in fewer downtimes.
Get Started Today!
Resources