Oracle Cloud Infrastructure (OCI) Resource Analytics provides a comprehensive solution for discovering, inventorying, and analyzing cloud resources across your OCI environment. As organizations scale their cloud footprint across multiple compartments, regions, and tenancies, maintaining visibility into what’s running—and how it’s all connected—becomes critical for operational efficiency, governance, and cost management.
OCI Resource Analytics addresses this challenge by functioning as a Configuration Management Database (CMDB) built directly into your tenancy. The service automatically collects resource metadata, stores it in a structured Autonomous Data Lakehouse (ADW), and provides pre-built Oracle Analytics Cloud (OAC) dashboards for immediate visibility. Beyond simple inventory, the service’s extensible architecture enables you to build a living knowledge base that combines OCI resource data with custom organizational context.
This blog post provides a comprehensive guide to understanding OCI Resource Analytics, covering its architecture, pre-built dashboards, data enrichment capabilities, and practical use cases for building an intelligent cloud knowledge base.
Service Overview: OCI Resource Analytics
OCI Resource Analytics is a service within OCI Observability and Management (O&M) that went generally available in October 2025 AI World. The service provides:
- Resource Discovery: Automatic collection and cataloging of OCI resource metadata across tenancies and regions
- Structured Data Store: All resource data stored in an Autonomous Data Lakehouse within your own tenancy
- Pre-Built Analytics: Out-of-the-box OAC dashboards for immediate operational visibility
- SQL Query Access: Full SQL access to resource metadata tables for ad-hoc analysis
- Data Enrichment: Ability to extend the ADW with custom data sources and organizational metadata
- AI Capabilities: Built on Autonomous AI Lakehouse, supporting vector search, in-database ML, and Select AI natural language queries
Supported Resource Types: Compute instances, networking resources, block storage, load balancers, network load balancers, tenancies, accounts, subscriptions, and OCI database types.
Architecture: How It Works Under the Hood
When you provision OCI Resource Analytics, three components are created in your tenancy:
- Autonomous Data Warehouse (ADW): A 4-ECPU Autonomous AI Lakehouse database is provisioned as your data store. This ADW lives in your tenancy—not in a shared backend—giving you full control over access and data ownership.
- Data Pipelines: Resource metadata flows into the ADW through event-driven Kafka streams from the OCI backend. This is not a REST API polling mechanism; changes are captured as they happen. Same-region sync completes within one minute. Cross-region sync completes within five minutes.
- Oracle Analytics Cloud (OAC): A 2-OCPU OAC instance is provisioned pre-configured with dashboards and reports. No additional setup is required on the analytics side.
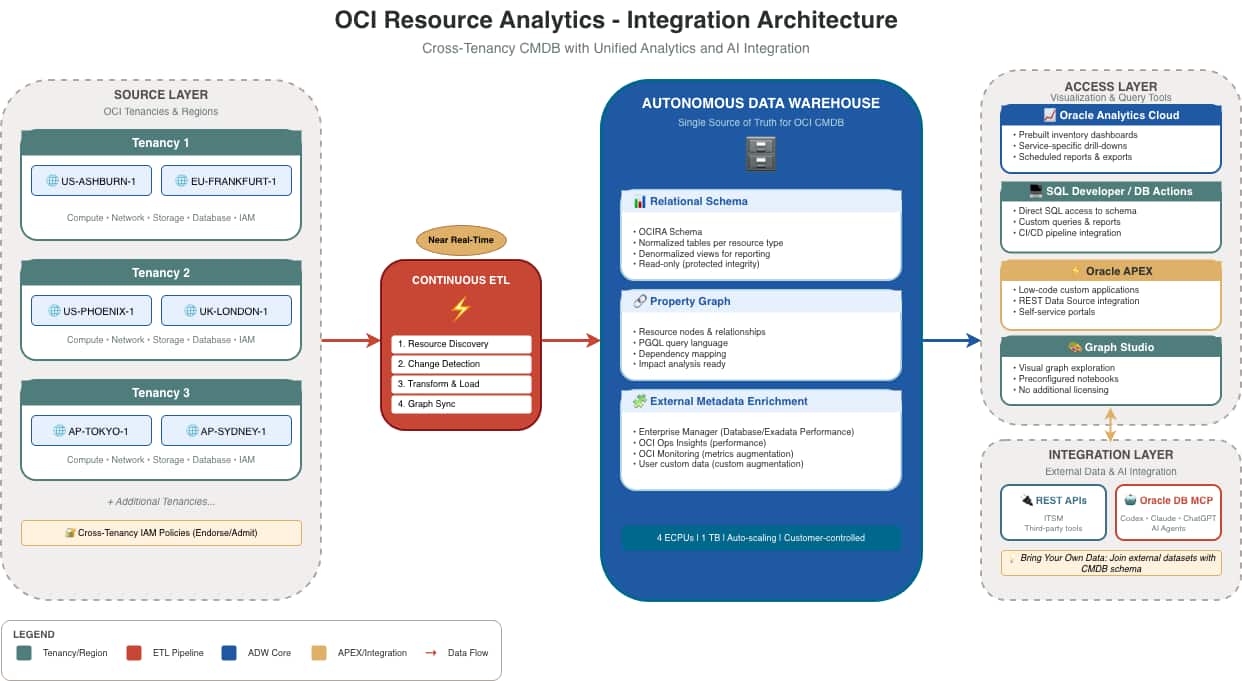
Note: The ADW and OAC instances are provisioned in your tenancy. You control access, you own the data, and you can extend both with custom content. This is the foundation of the knowledge base concept.
Get Quick Insights from the Oracle Analytics Cloud Out-of-the-Box Dashboards
OCI Resource Analytics ships with a comprehensive set of pre-built OAC dashboards covering the most common operational questions. Instead of spending weeks building custom reports, administrators can immediately access valuable insights directly from these out-of-the-box visualizations:
- Resource Inventory and Breakdown: Access cross-tenancy views with total resource counts across all connected regions, filterable by resource type, region, or compartment.

- Tagging & Compliance: Dedicated views highlighting resources with and without mandatory tags to enforce governance policies across the organization.
- OCI Backup Dashboard: Critical for audit and compliance requirements, this comprehensive view tracks coverage across block volume backups, boot volume backups, and database backups.
- Category-Specific Dashboards: Broad structural insights across specific infrastructure domains. Out-of-the-box dashboards include Resource Discovery, Compute Infrastructure, Network, Database, Load Balancer, Logging, OKE (Oracle Kubernetes Engine), Integration Cloud, Object Storage, and more.

- Detailed CMDB and Drill-Down Reports: Explore structured, detailed configuration views for resources (Compute, Databases, and Load Balancers) incorporating dependency mapping and interactive exploration to answer ad-hoc questions without writing custom SQL.
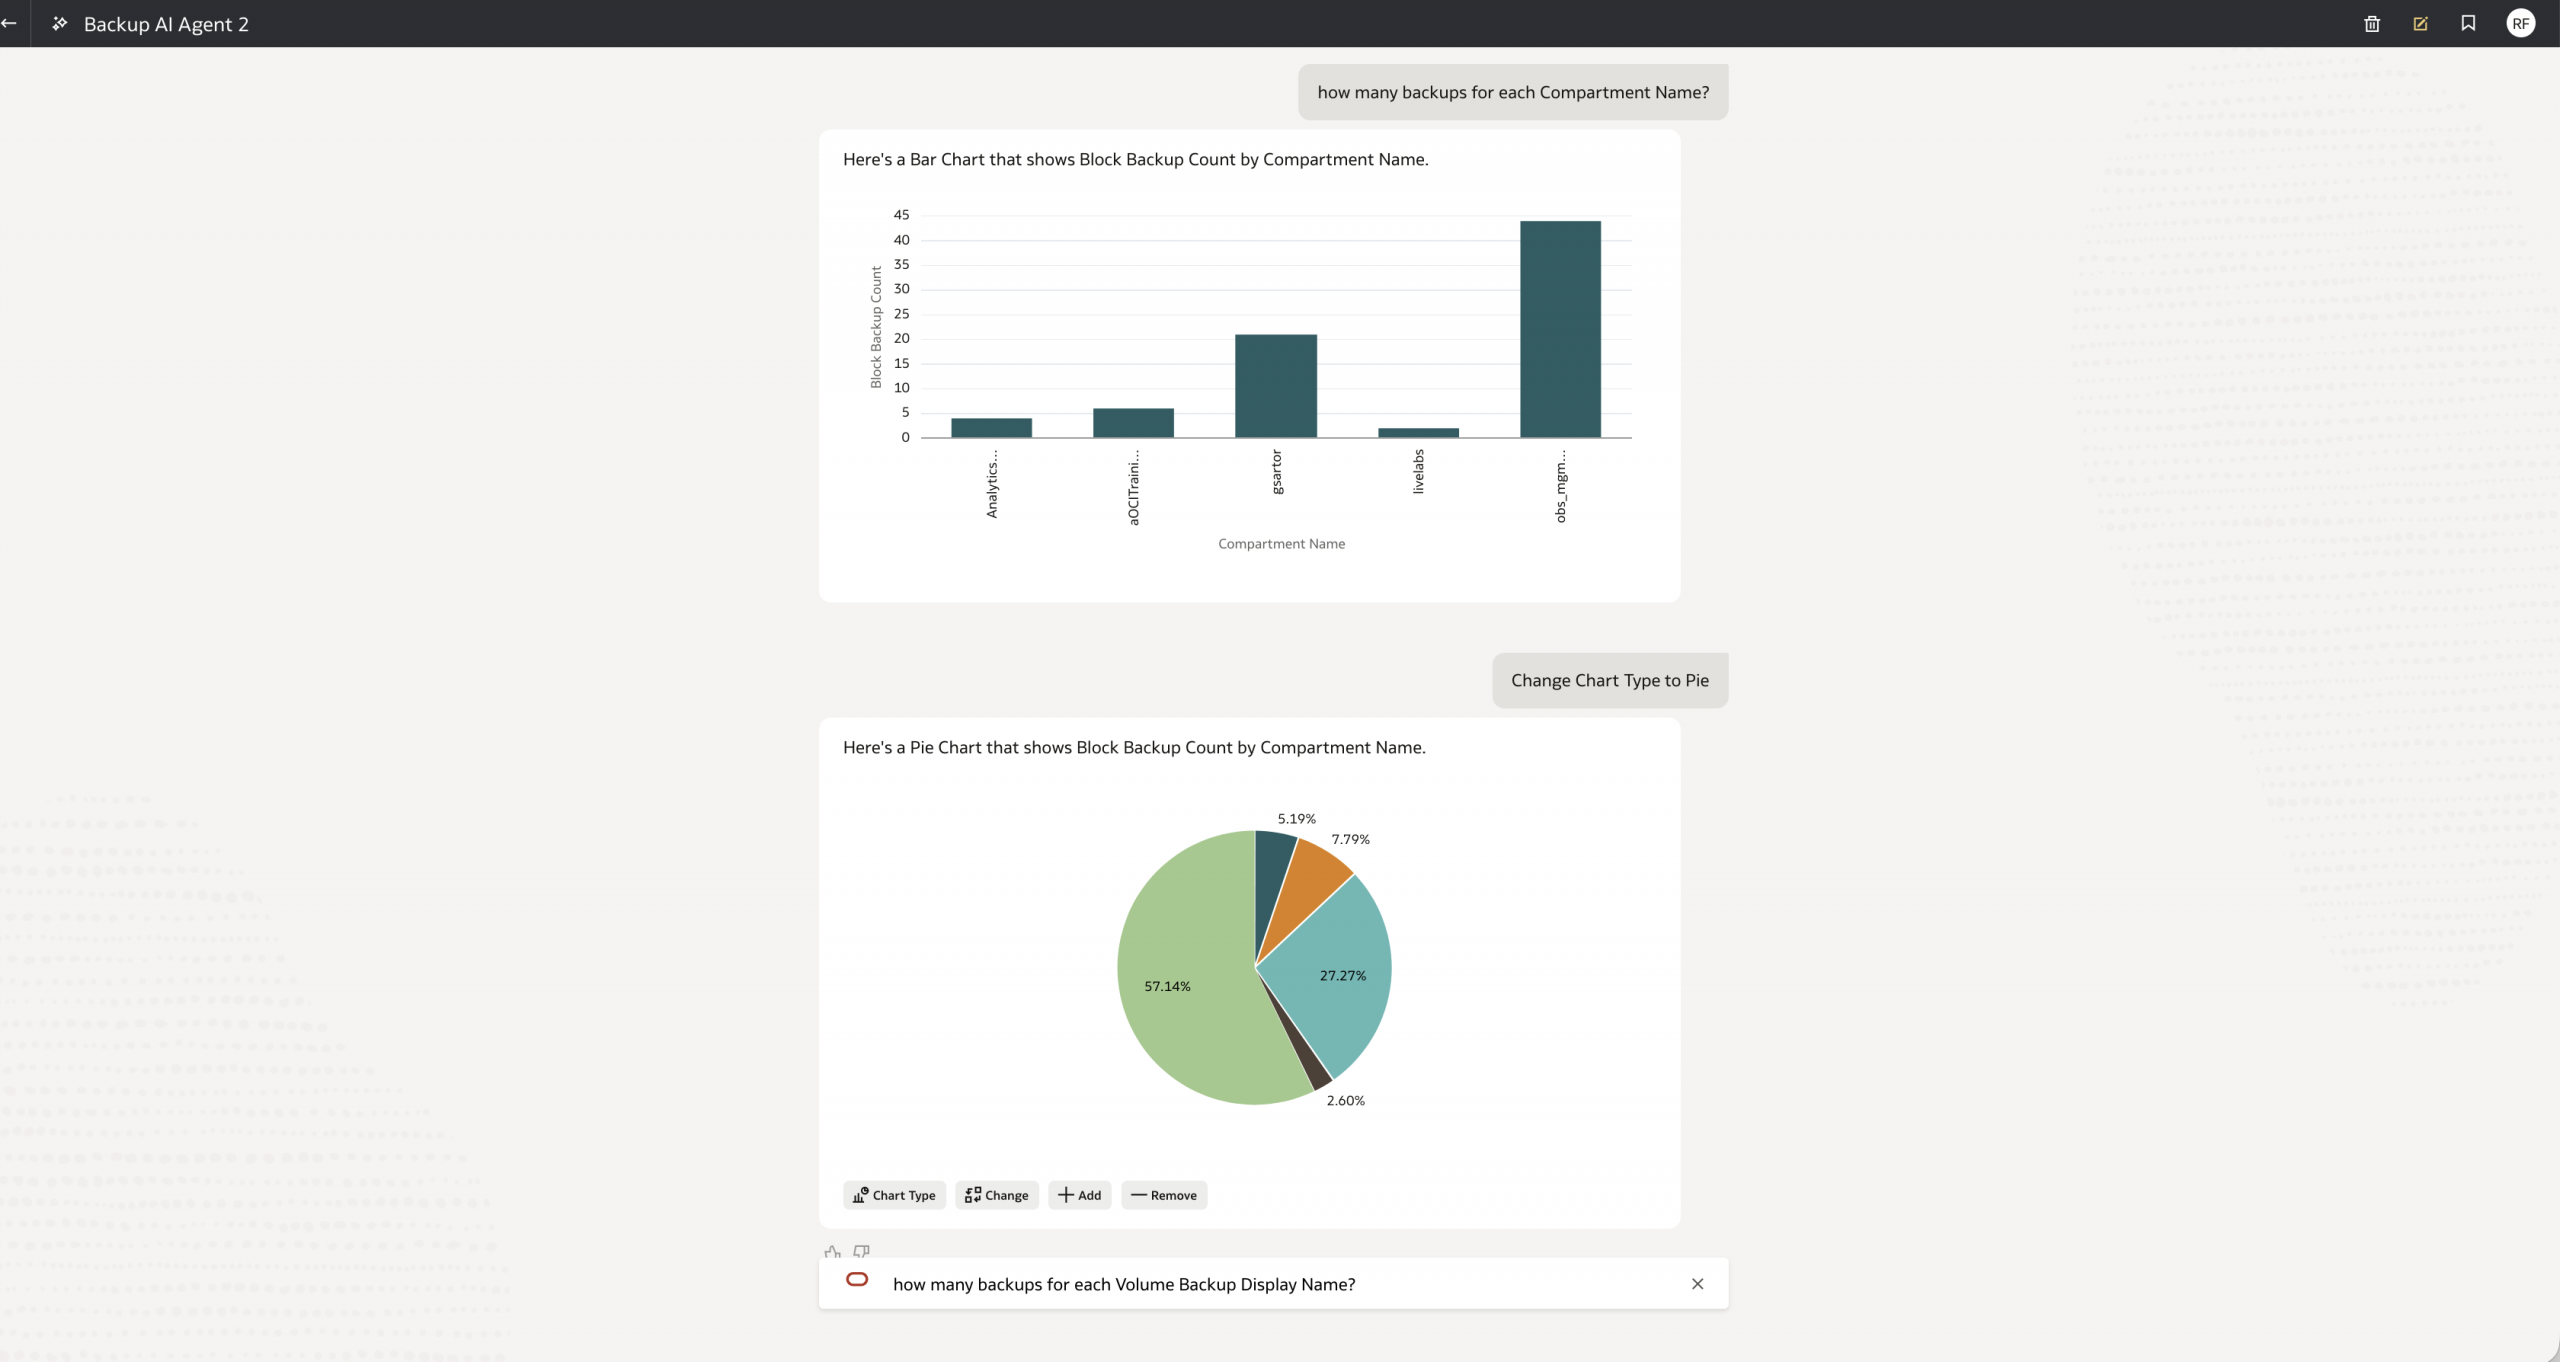
- OAC AI Agent Integration: Elevate your data exploration by creating an AI Agent directly on top of the dataset. This allows users to “chat” with their OCI resource data natively within the Oracle Analytics Cloud interface.
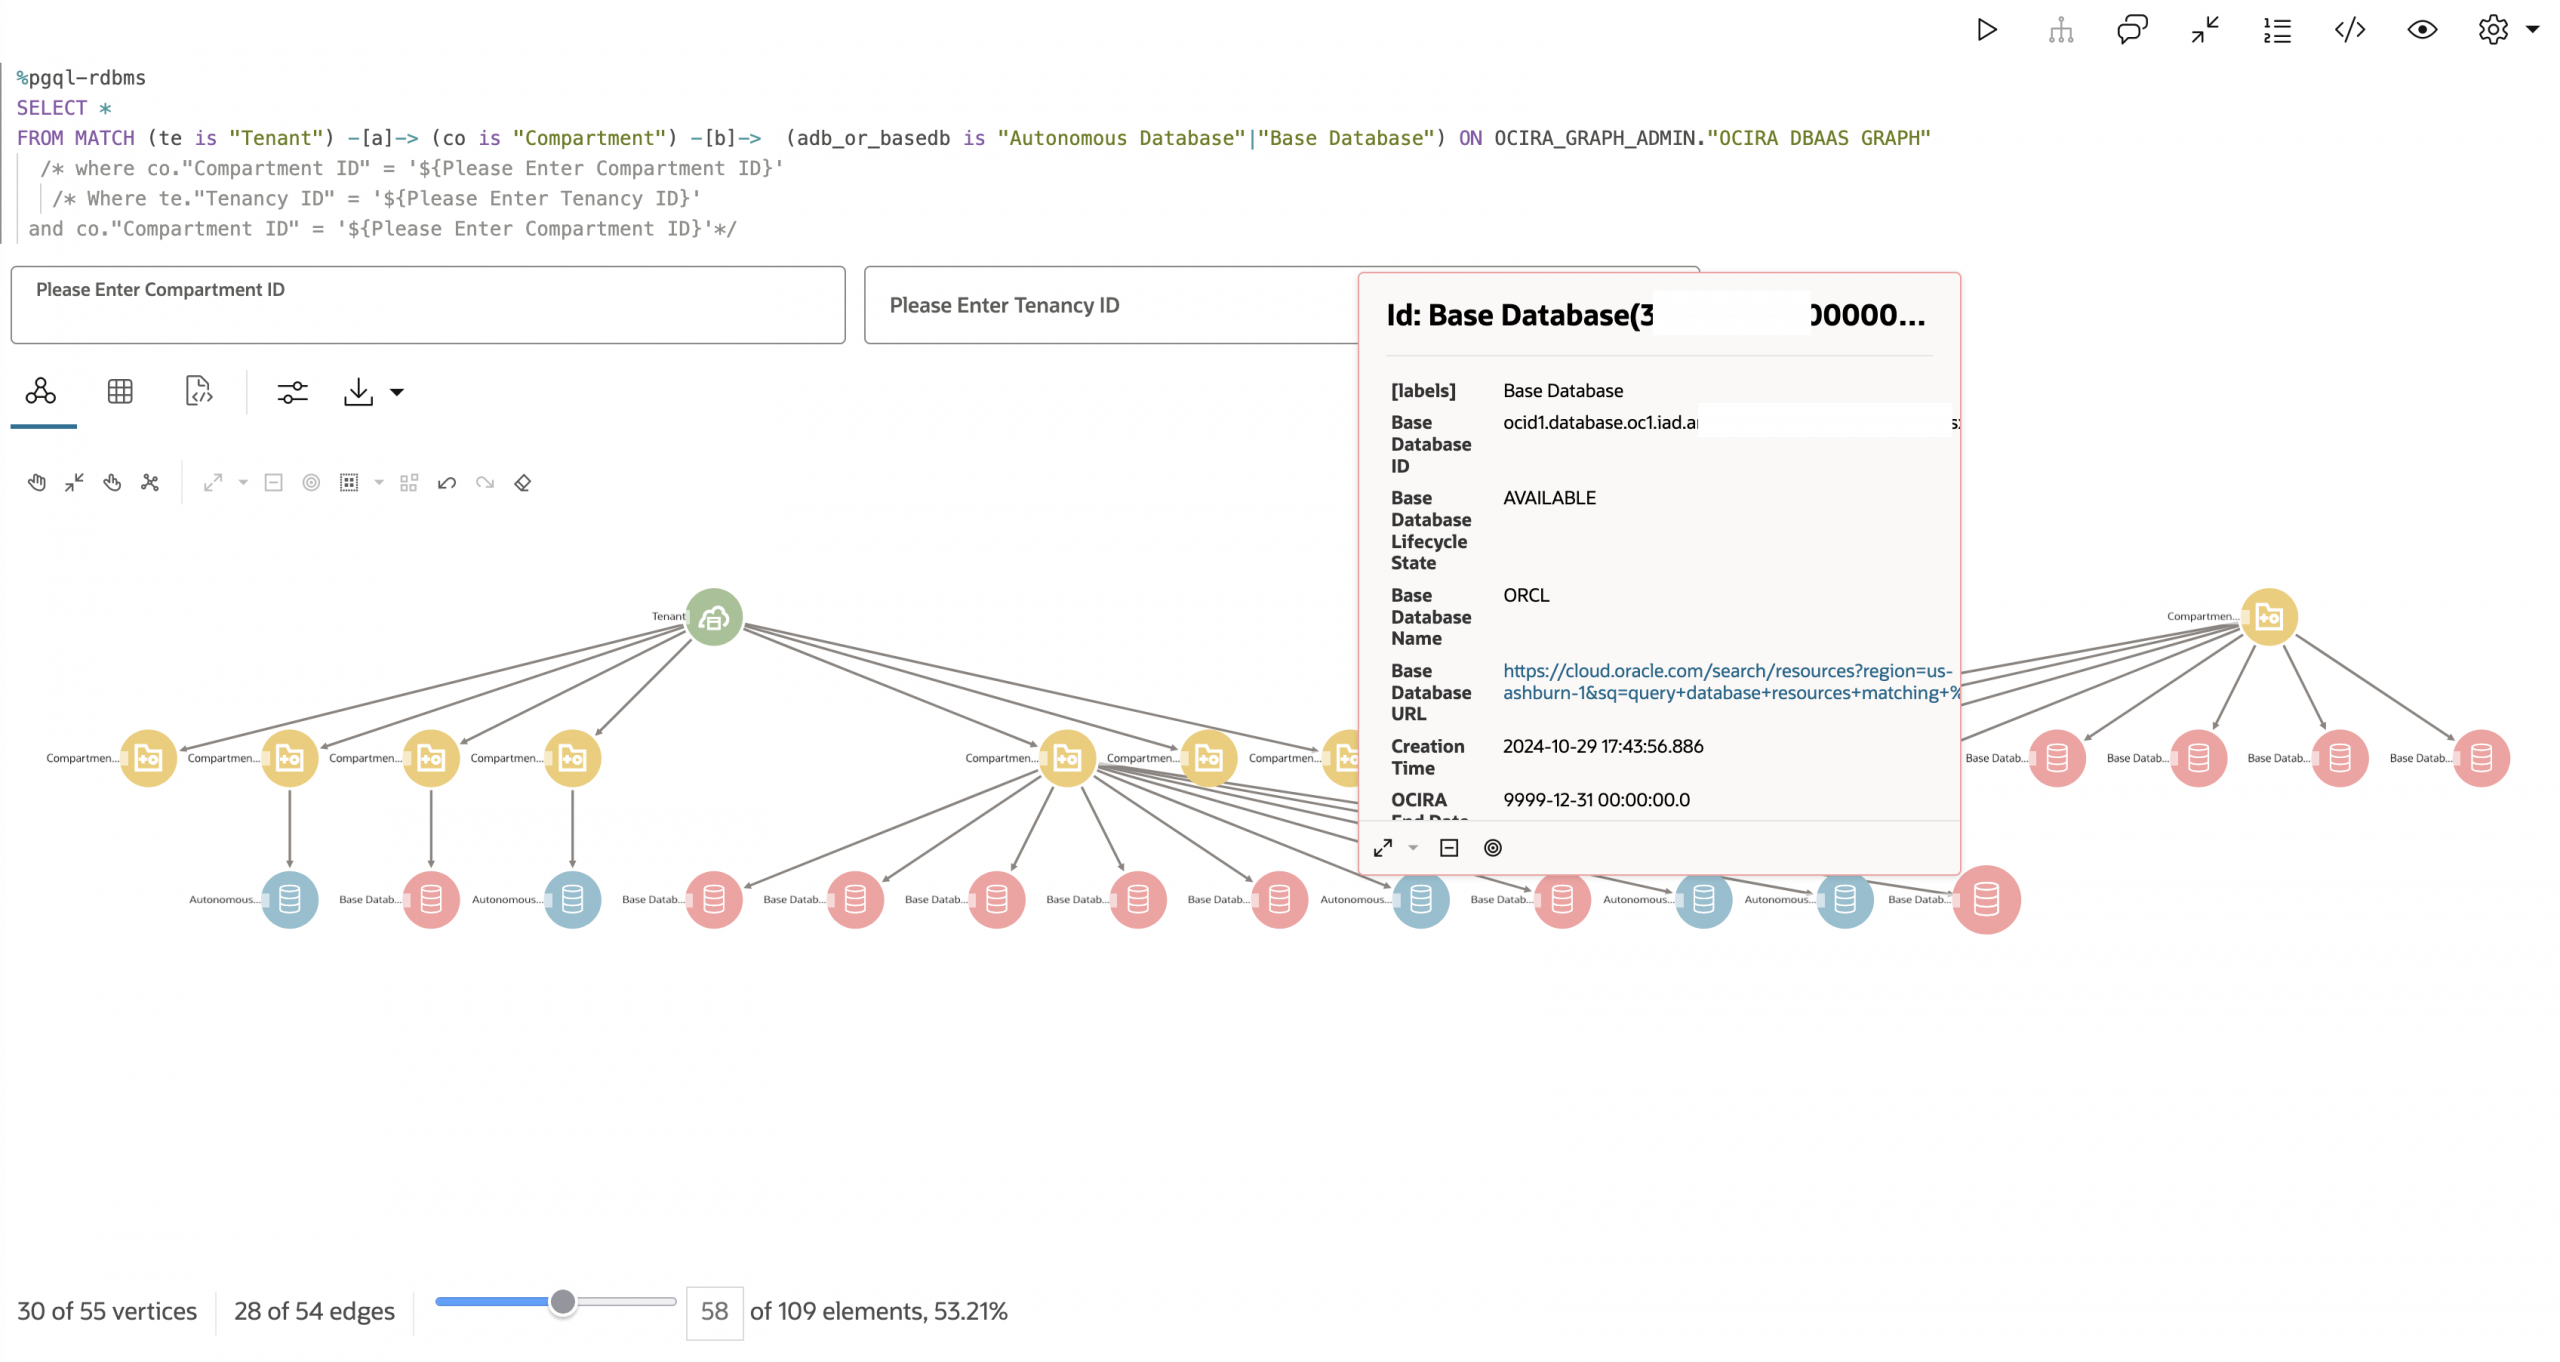
Resource Relationship Visualization with Graph Studio
The Autonomous Database that underpins OCI Resource Analytics includes Graph Studio, a built-in environment for modeling, analyzing, and visualizing data as property graphs. OCI Resource Analytics ships with out-of-the-box Graph Studio notebooks that are pre-configured to work with the OCIRA resource metadata—enabling operators to visualize resource relationships immediately without building graph models from scratch. Because the OCIRA resource metadata already captures relationships between resources—compute instances attached to block volumes, subnets within VCNs, databases in compartments—these pre-built notebooks transform relational data into interactive graph visualizations without moving or replicating data.
The out-of-the-box Resource Explorer notebooks cover the following resource domains:
- OCIRA Compute and Volume Explorer: Explore compute instances and their associations with storage resources, including boot volumes, block volumes, and volume attachment details. Trace the dependency chain from tenancy and compartment down to individual volume attachments.
- OCIRA Network Explorer: Visualize network resources and their complex associations—VCNs, subnets, Network Security Groups (NSGs), local peering gateways, and Dynamic Routing Gateways (DRGs)—to understand network topology and connectivity paths.
- OCIRA Subscription Explorer: Explore the hierarchy of subscriptions, tenancies, and compartments. This is particularly valuable for multi-tenancy environments where understanding the organizational structure at a glance is essential for governance and policy enforcement.
- OCIRA DBaaS Explorer: Navigate the relationships between DB Systems, Autonomous Databases, Exadata Infrastructure, and their associated network subnets to understand database service dependencies.
- OCIRA LBaaS Explorer: Trace the connection chain within Load Balancer services—from load balancers and listeners to backend sets and individual backends—to understand traffic routing and backend health relationships.
- OCIRA NLB Explorer: Explore resource associations within Network Load Balancers, providing visibility into network-level load balancing topology.
Create Data-Driven APEX Application for OCI Resource Analytics using APEX Generative AI App Builder
With the rich, structured metadata continuously flowing into your Resource Analytics data store, you can rapidly build custom, data-driven applications to manage your cloud environment. While you can build these applications manually, leveraging the APEX Generative AI App Builder—incorporated natively within your Autonomous Database—accelerates this development process exponentially.
By simply configuring a Generative AI API key (such as an OpenAI, Cohere, or OCI Generative AI key) into your APEX workspace, developers and cloud operators can use detailed natural language prompts to dictate the exact application they need.
Consider the following example. Instead of manually coding pages and writing SQL extraction scripts, you can supply a comprehensive prompt to the AI App Builder:
“Create an APEX application for the OCI Resource Analytics data. Map each menu and submenu to the corresponding entries in the Resource Analytics Data Model Reference. For each menu, include visualizations that best represent the underlying data—such as a pie chart for compute instance state distributions, and a bar chart showing instance counts by region. Please use the OCI Resource Analytics related views for reference.”


Providing this level of context allows the generative AI to understand the underlying relational model of OCI resources. It instantly generates the core application blueprint, maps the schema tables to the application UI, and builds out the requested visualizations without a single line of code.
The resulting output is a fully functional APEX application—complete with intuitive navigation, interactive grids, and tailored analytical charts mapping exactly to your live Resource Analytics data. What traditionally takes weeks of requirements gathering, data modeling, and low-level development is effectively reduced to a few minutes of prompt engineering.

Ad-Hoc Infrastructure Analysis via SQL
Because all resource metadata is stored in a full Autonomous Database, you have complete SQL access to query your infrastructure directly. This shifts the operational model from “open the console and click around” to “ask your infrastructure a question and get an answer.” For organizations managing thousands of resources across multiple tenancies and regions, this is a fundamental change in how teams interact with their environment.
Data Enrichment: Extending the Knowledge Base
Because the ADW is provisioned in your tenancy, you can extend it with custom data sources. This turns the service from a read-only CMDB into a living knowledge base that reflects your organization’s specific context.
- Custom Data Integration: Add application ownership mappings, business unit assignments, compliance classifications, or other organizational metadata that doesn’t exist natively in OCI. Join this data with the resource tables to answer business questions alongside infrastructure questions.
- Performance Metrics: Ingest monitoring data from OCI Monitoring or third-party tools. Correlate resource configuration with actual performance to identify right-sizing opportunities or underutilized resources.
- Cost and Usage Data: Cost and usage data is not natively available in Resource Analytics today. However, because the ADW is fully extensible, teams can integrate this data with some additional engineering effort—for example, by leveraging the OCI Usage Reports samples on GitHub to ingest cost and usage data into the ADW and join it with resource metadata for FinOps analysis.
Resource Analytics Use Cases Consideration
OCI Resource Analytics goes beyond being a static inventory—it acts as an extensible, living knowledge base. The following OCI O&M user engagements illustrate what becomes possible when teams start building on this foundation.
Use Case 1: Backup Compliance and Governance Reporting
An OCI O&M user needed to answer a deceptively simple question: which block volumes are backed up, and which instances are they attached to? In a large environment, this requires correlating data across disparate resource types. Block volumes, backup policies, and compute instances are separate entities in the OCI console, and manually cross-referencing them across hundreds or thousands of resources is error-prone and unsustainable.
The Vision: Using OCI Resource Analytics, the team built a custom OAC report that joins compute instance data with volume backup information. The report provides a single view showing backup compliance status at the instance level, with drill-down filters for compartment, region, and backup policy type. Because the data flows continuously through the Kafka pipeline, the report stays current without any manual intervention.
The team entirely eliminated the need for custom scripts and manual cross-referencing. Governance teams now have a continuously updated, auditable view of backup compliance across the entire environment.
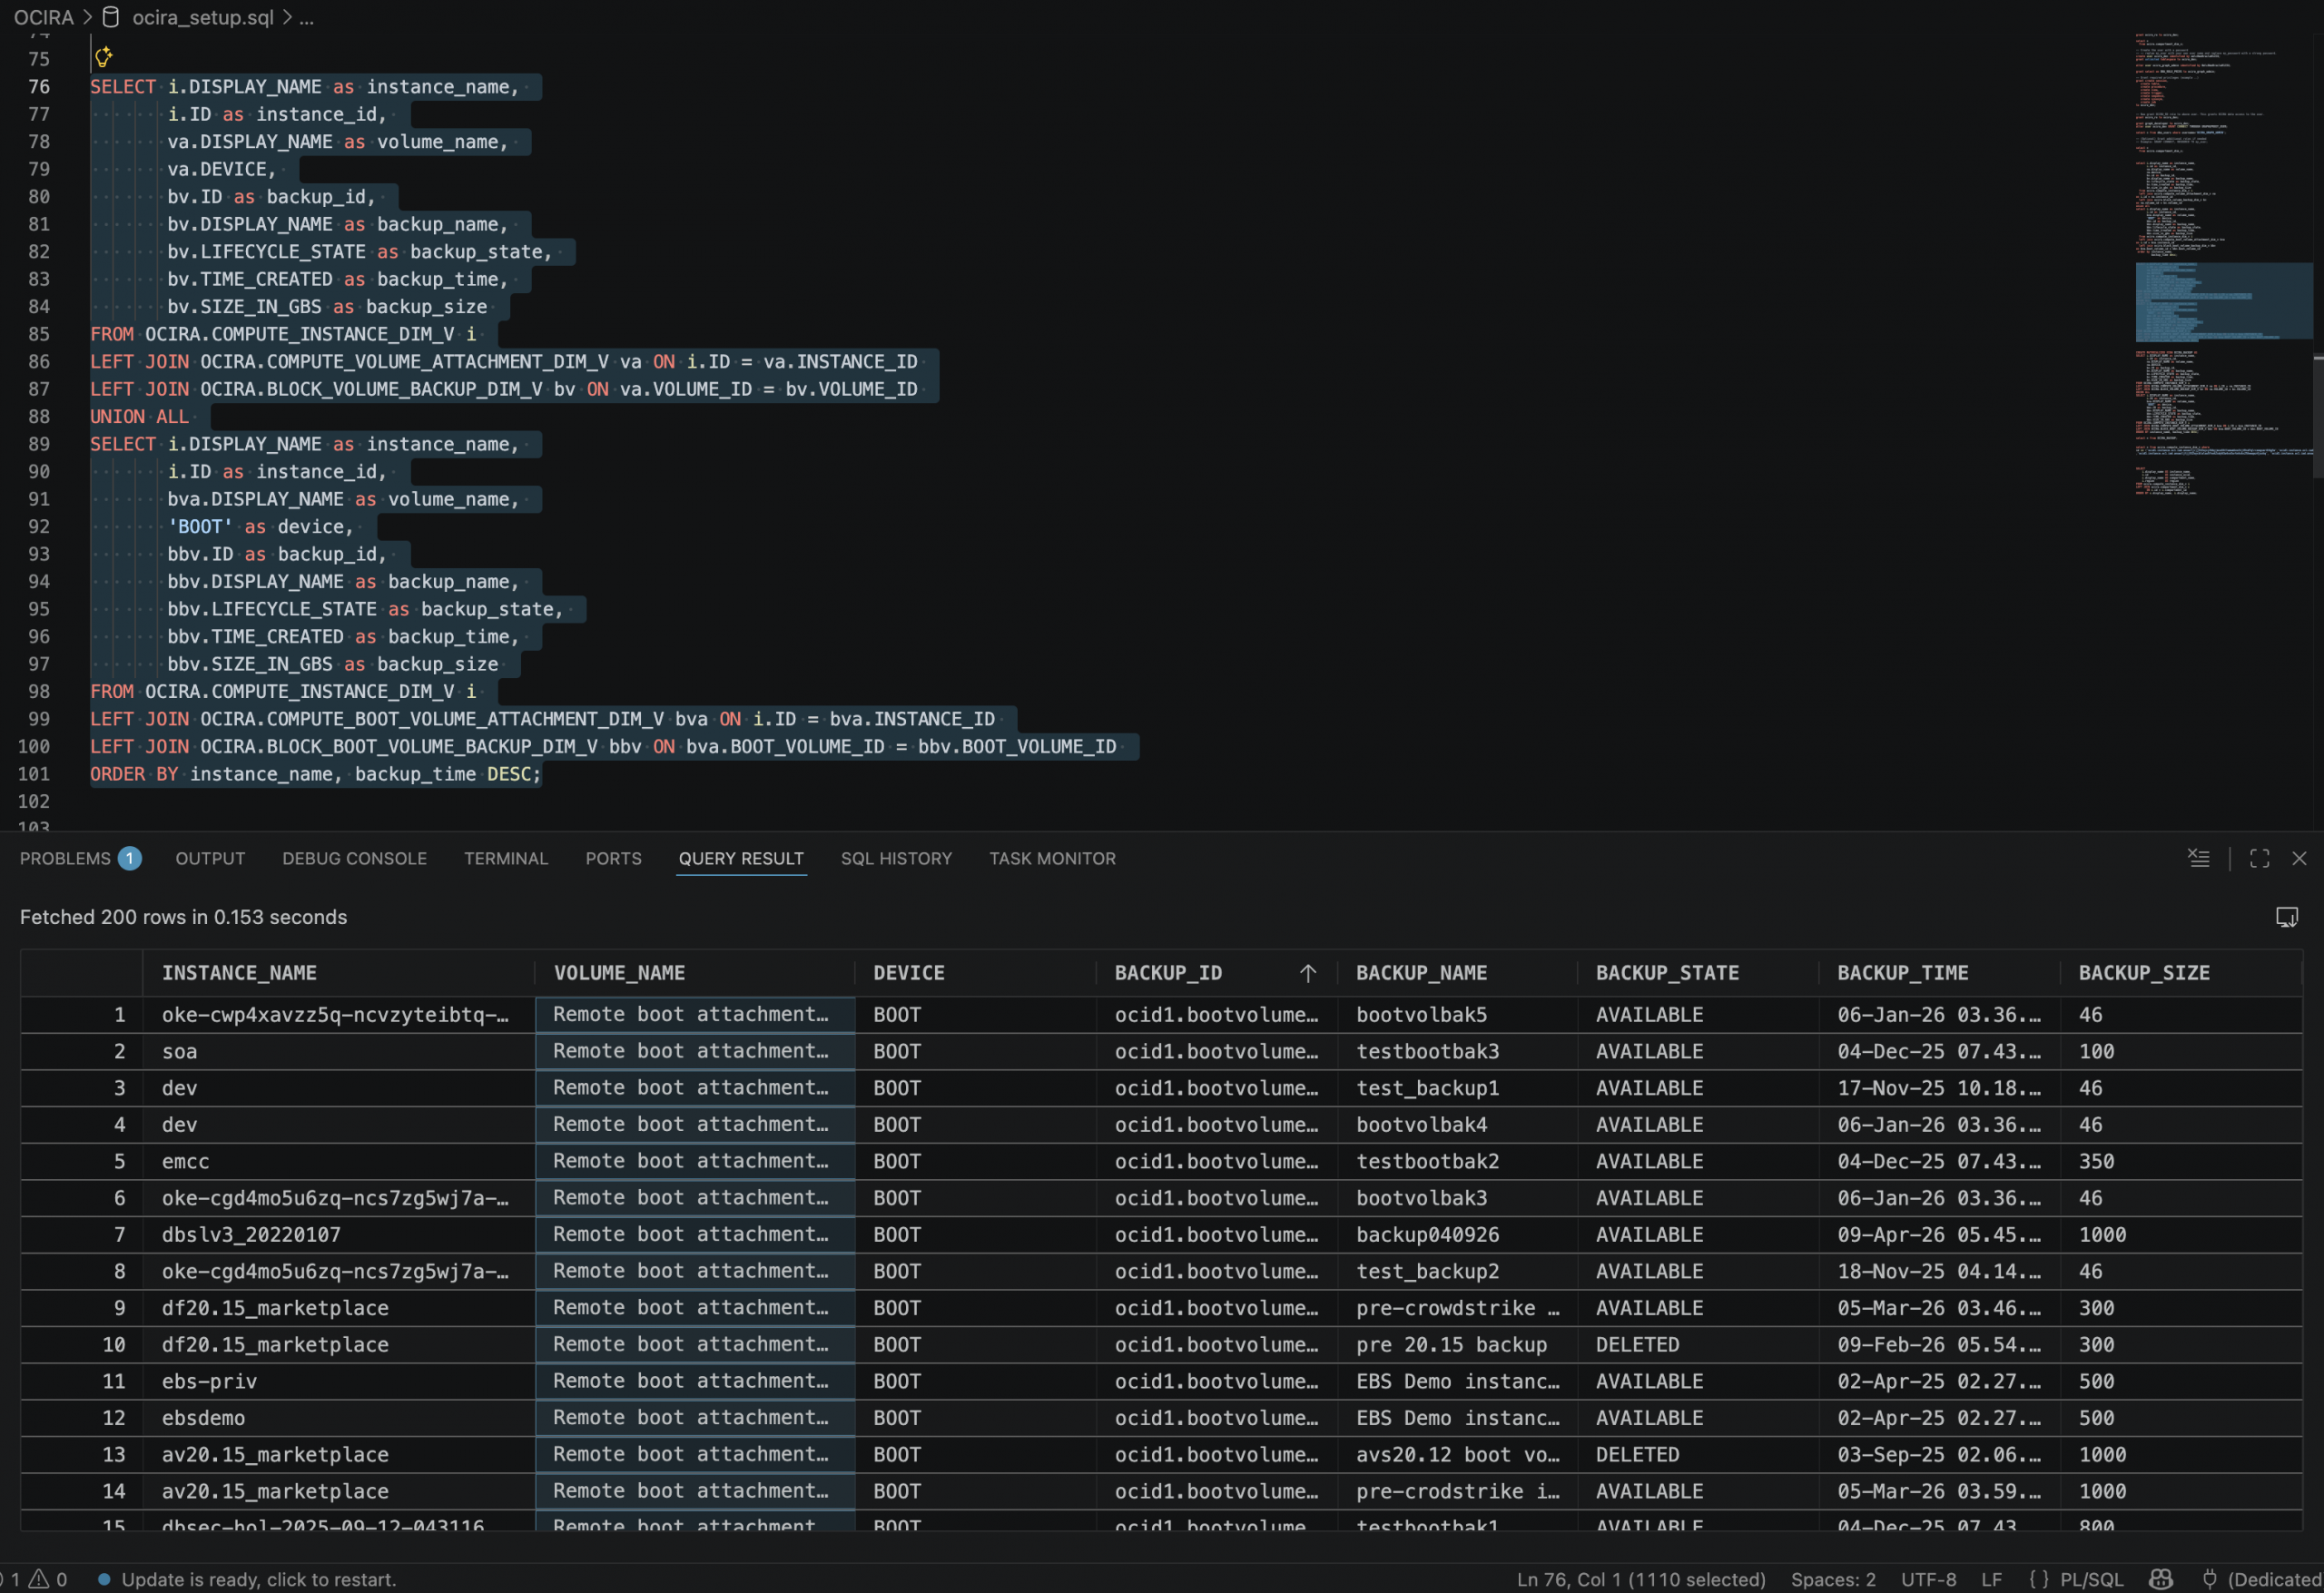
For instance, finding out the compute instance block volume and boot volume backup information becomes much easier with the following SQL:
SELECT i.DISPLAY_NAME as instance_name,
       i.ID as instance_id,
       va.DISPLAY_NAME as volume_name,
       va.DEVICE,
       bv.ID as backup_id,
       bv.DISPLAY_NAME as backup_name,
       bv.LIFECYCLE_STATE as backup_state,
       bv.TIME_CREATED as backup_time,
       bv.SIZE_IN_GBS as backup_size
FROM OCIRA.COMPUTE_INSTANCE_DIM_V i
LEFT JOIN OCIRA.COMPUTE_VOLUME_ATTACHMENT_DIM_V va ON i.ID = va.INSTANCE_ID
LEFT JOIN OCIRA.BLOCK_VOLUME_BACKUP_DIM_V bv ON va.VOLUME_ID = bv.VOLUME_ID
UNION ALL
SELECT i.DISPLAY_NAME as instance_name,
       i.ID as instance_id,
       bva.DISPLAY_NAME as volume_name,
       'BOOT' as device,
       bbv.ID as backup_id,
       bbv.DISPLAY_NAME as backup_name,
       bbv.LIFECYCLE_STATE as backup_state,
       bbv.TIME_CREATED as backup_time,
       bbv.SIZE_IN_GBS as backup_size
FROM OCIRA.COMPUTE_INSTANCE_DIM_V i
LEFT JOIN OCIRA.COMPUTE_BOOT_VOLUME_ATTACHMENT_DIM_V bva ON i.ID = bva.INSTANCE_ID
LEFT JOIN OCIRA.BLOCK_BOOT_VOLUME_BACKUP_DIM_V bbv ON bva.BOOT_VOLUME_ID = bbv.BOOT_VOLUME_ID
ORDER BY instance_name, backup_time DESC;
Use Case 2: Toward a Single-Pane-of-Glass for Holistic Cloud Operations
We have consistently identified a common operational pain point: operators are forced to switch between the OCI console for resource information (configuration, relationships, tags), OCI Ops Insights for cloud-native performance metrics, and Oracle Enterprise Manager for database and Exadata performance management. This context switching slows incident response and makes it difficult to correlate resource configuration changes with performance degradation—especially in hybrid environments spanning on-premises and cloud infrastructure.
The Vision: Because the Resource Analytics ADW is provisioned in the user’s tenancy and fully extensible, it opens the door to a layered integration approach—enriching the resource metadata with multiple observability data sources to achieve a truly holistic operational view. While this vision requires additional engineering effort, OCI O&M users have shared compelling use cases that validate the direction:
- OCI Ops Insights Host Insights and Database Insights: Host-level and database-level performance metrics—CPU utilization, memory consumption, I/O throughput, SQL performance statistics—can be ingested into the ADW alongside the OCIRA resource metadata, providing the cloud-native performance layer.
- Oracle Enterprise Manager Repository Data: Enterprise Manager is one of the mainstream monitoring platforms for Oracle Database and Exadata performance, and its repository database is one of the richest sources of database and Exadata performance data available. EM repository metrics—covering database health, Exadata cell statistics, middleware performance, and application server telemetry—can be enriched into the ADW and joined with OCIRA resource metadata. This would unify the deep, established EM performance visibility with cloud resource context in a single queryable data store.
- Metrics Augmentation Across Integration Dependencies: Beyond individual resource metrics, the data model can be augmented with metrics that span integration dependencies—tracking health and performance across resources that are functionally linked (e.g., an Integration Cloud instance calling an Autonomous Database, or a load balancer fronting a set of compute instances running middleware). By modeling these dependency chains and associating metrics at each integration point, operators would gain visibility into end-to-end service health rather than isolated resource health.
The extensible ADW architecture makes this possible: OCIRA metadata, Ops Insights metrics, Enterprise Manager repository data, and custom dependency metrics can all coexist in a single, queryable data store, with custom OAC dashboards joining resource configuration with near real-time performance data across all layers.
This direction points toward a holistic operational view where an operator can see what a resource is, how it is behaving, what it depends on, and how those dependencies are performing—without building a separate data platform. The combination of Enterprise Manager’s deep database and Exadata performance insights with cloud-native observability data and OCIRA resource metadata would give organizations a single source of truth for Multicloud and Hybrid cloud health. We encourage teams to explore these integration possibilities and discover additional use cases that the extensible Resource Analytics platform can support.
Use Case 3: AI-Powered Cloud Operations
The Autonomous AI Lakehouse database that Resource Analytics provisions is not just a data store—it supports Oracle’s AI capabilities natively, including vector search, in-database machine learning, and natural language query through Select AI. The resource metadata in the ADW serves as the foundation layer, and the AI capabilities serve as the intelligence layer built on top. Together, they point toward a future where your cloud environment doesn’t just report its state—it helps you understand and optimize it.
Key AI-enabled scenarios include:
- Natural Language Queries via SQLcl MCP Server: Starting with Oracle SQLcl 25.2, the built-in Model Context Protocol (MCP) server enables AI-powered assistants—such as VS Code, OpenAI Codex, Claude, Copilot, or custom agents—to query the Resource Analytics ADW using natural language. The AI agent uses exposed SQLcl MCP tools (
run-sql,list-connections,connect) to translate these requests into SQL, execute them securely against the ADW, and return structured results. Instead of writing complex SQL, operators can ask questions in plain English, such as- “Which Autonomous Databases have not had a backup in the last 7 days?”
- “Which compute instances in the finance compartment are missing backup policies?”
- “Get all the compartments’ names within the tenancy and the reationships of the parent-child compartments, create a graph visualization for the compartments hierachical structure”

- AI-Driven Pattern Recognition: By combining resource metadata with performance data in the same database, AI models can rapidly scan across the entire environment to surface gaps, risks, and outliers that would take hours to find manually. For example, AI can quickly identify databases missing recent backups, compute instances running unpatched OS images, resources without required tags, or databases overdue for critical patches—patterns that are difficult to detect at scale through manual review or static reporting.
- “Analyze all databases across the environment and identify any that deviate from the backup pattern of their peer group—which ones are missing backups that similar databases have?”
- “Scan all Exadata and DB System resources and flag any that are more than two patch levels behind their peers in the same compartment”
- “Correlate compute instance configurations with their performance metrics and identify instances that are consistently over-provisioned relative to similar workloads”

- Intelligent Recommendations: In the future, by combining resource configuration, utilization metrics, and cost data (once cost integration is available), the system can generate AI-driven optimization recommendations. These include right-sizing suggestions for over-provisioned instances, cleanup candidates for orphaned resources, and architecture improvements based on utilization patterns across the environment.
- “Do I have capacity constraints in the OracleDB@Azure VM cluster test-cluster? If so, which DB systems are impacted?”
- “Which compute instances have averaged less than 10% CPU utilization over the past 30 days and could be downsized?”
- “Find block volumes that have no attachments and no recent I/O activity—are they candidates for cleanup?”
- “Compare the provisioned ECPU capacity versus actual usage across all Autonomous Databases and recommend right-sizing opportunities”
- “Identify resources created more than 180 days ago that have no associated tags, no recent activity, and no dependencies—flag them for decommissioning review”

Conclusion
OCI Resource Analytics provides a structured, queryable, and extensible foundation for managing cloud resource visibility at scale. The service’s architecture—placing the ADW and OAC instances in your tenancy—enables organizations to move from static inventory tracking to a living knowledge base that combines OCI resource metadata with custom organizational context and AI-powered analysis.
For organizations managing OCI resources at any meaningful scale, Resource Analytics provides immediate value through pre-built dashboards while offering the extensibility to address organization-specific operational, governance, and optimization requirements.
We welcome OCI customers to share their use cases, integration ideas, and any capabilities they find valuable for Resource Analytics. Whether it’s a new data source you’d like to see integrated, a custom dashboard pattern that’s working well in your environment, or a use case we haven’t covered here—your feedback directly shapes the direction of this service. Please reach out to your Oracle account team or engage with us through the OCI Community Forum to start the conversation.