APIs are the backbone of modern cloud-native applications. If you are running APIs on Oracle Cloud Infrastructure (OCI), your API Gateway is where performance, reliability, and user experience converge.
You may already be generating API Gateway logs. The bigger question is whether you are turning those logs into operational insights quickly enough to matter.
With Oracle Log Analytics, you can ingest, analyze, and visualize OCI API Gateway logs end-to-end. And now, instead of building every view from scratch, you can start with the Oracle-defined OCI API Gateway Overview dashboard and customize it to your needs.
Why API Gateway logs matter
OCI API Gateway provides two complementary log types:
- Access logs capture request and response summaries, including route, status code, and duration.
- Execution logs show what happened inside the gateway during request processing, including warnings, errors, and policy or backend activity.
Together, they help you answer critical operational questions:
- Which APIs are receiving the most traffic?
- Where are failures occurring?
- Which routes or backends are adding latency?
- Are issues isolated to one deployment or visible across the environment?
From ingestion to insight
The workflow is straightforward: enable API Gateway logging, ingest the logs into Oracle Log Analytics, and analyze them using Log Explorer and dashboards.
Oracle Log Analytics also provides an Oracle-defined OCI API Gateway Overview dashboard, giving you a starting point for observability without having to build your first dashboard from scratch. Because Oracle-defined dashboards are read-only, you can duplicate the dashboard and customize the copy as needed.
With that baseline in place, you can quickly understand:
- traffic volume and request activity over time
- access status distribution across successful and failed requests
- duration analysis to highlight latency trends
- execution-log severity levels that highlight warnings and errors
- access traffic correlation analysis to connect traffic patterns with incidents
End-to-end workflow: Ingest and analyze API Gateway logs
Before you begin, ensure that the required IAM and service policies are in place for Oracle Log Analytics, OCI Logging, and OCI Connector Hub. See Prerequisite IAM Policies and Allow Collection of Logs from OCI Logging Service.
1. Enable API Gateway logging
In the OCI Console, navigate to your API Gateway and select the specific API Deployment.
Open the deployment details page.
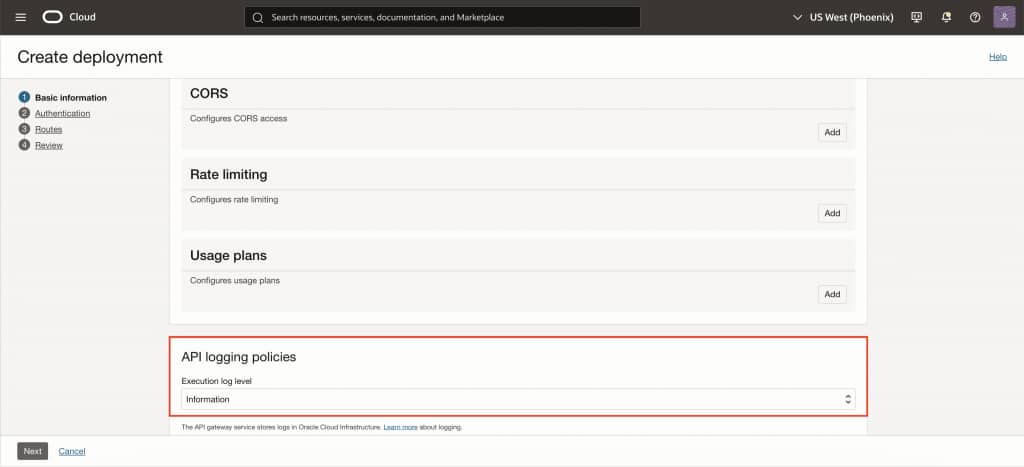
Next, navigate to Logs for the deployment.
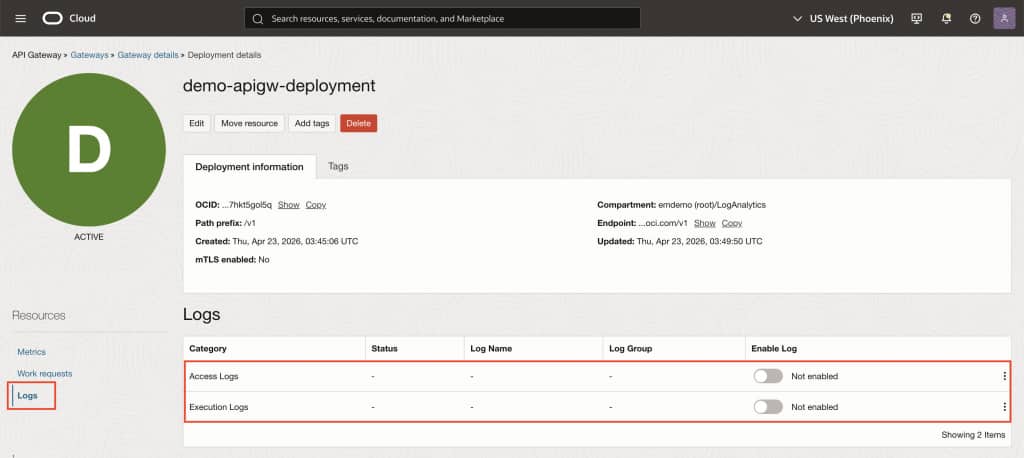
Enable Access Logs for request-level visibility.
Enable Execution Logs for deeper diagnostics.
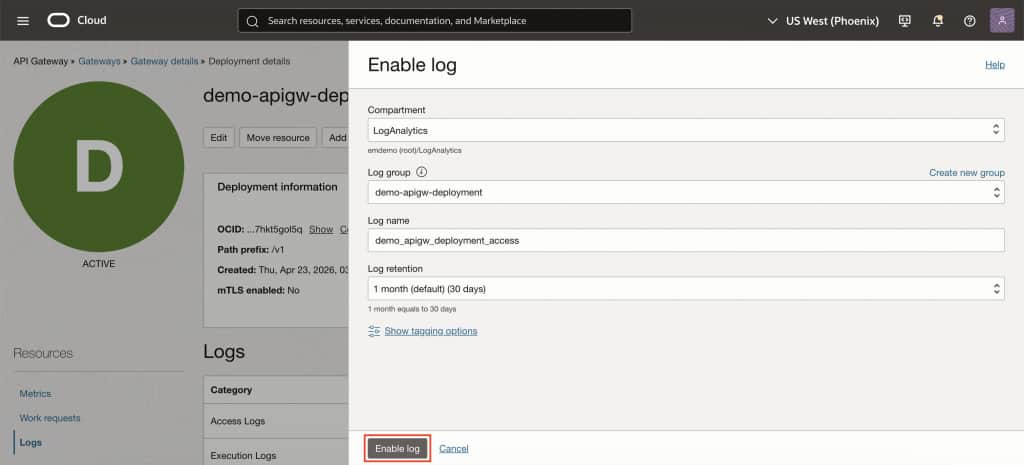
Select or create the OCI Logging log group where the logs will be stored.
Once enabled, API Gateway automatically publishes the deployment logs to OCI Logging.
2. Ingest the logs into Oracle Log Analytics
Oracle recommends using the Compass and selecting Add Data workflow in Oracle Log Analytics to quickly configure log collection for OCI resources. This guided flow helps set up the required resources and ingestion path with less manual work.
If you prefer a manual setup, you can use OCI Connector Hub to route logs from OCI Logging into Oracle Log Analytics:
- Set the Source as Logging
- Select the log group and the API Gateway access and execution logs
- Set the Target as Logging Analytics
- Choose the Oracle Log Analytics log group where the ingested logs will be stored
This creates a managed ingestion pipeline from API Gateway to Oracle Log Analytics.
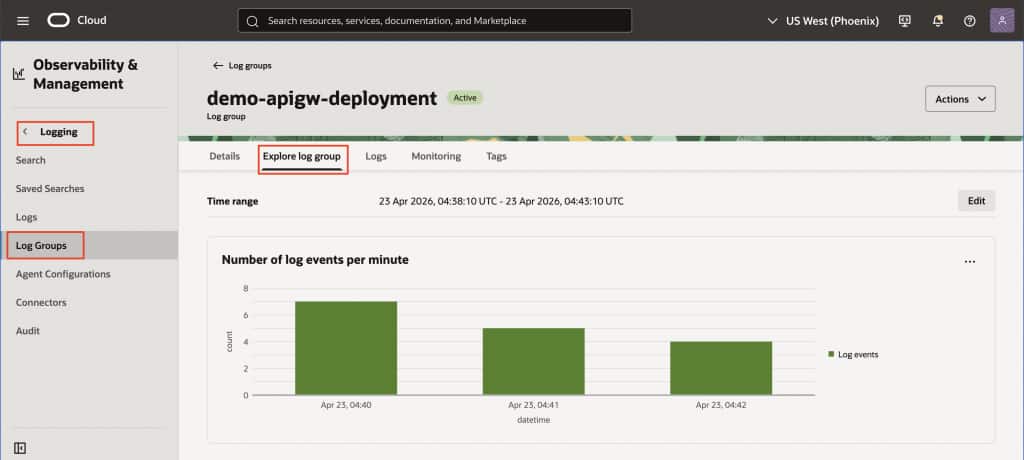
3. Verify log ingestion
Once the ingestion path is active, verify that the logs are arriving in Oracle Log Analytics.
- Verify ingestion from the Log Analytics service page
- Ensure the appropriate log source is associated (Oracle-defined sources are typically available for OCI services)
- Confirm fields such as status, latency, route, and request details are parsed correctly
At this stage, the raw log data becomes structured and searchable. Fields such as request URI, status, duration, and request identifiers can now be used for filtering, correlation, and analysis.
4. Analyze with Log Explorer and dashboards
With logs ingested, you can begin analyzing API activity in Oracle Log Analytics:
- use Log Explorer to search and filter request activity drill into specific errors, latency spikes, or request paths
- create saved searches for recurring troubleshooting scenarios
- use dashboards for broader operational visibility
This supports both day-to-day monitoring and deeper incident investigation.
5. Start with the OCI API Gateway Overview dashboard
After the logs are ingested, navigate to Oracle Log Analytics, open Dashboards, and search for the Oracle-defined OCI API Gateway Overview dashboard. This gives you a curated view of your API landscape, providing a practical baseline for observability that you can build on by duplicating and customizing the dashboard for your environment if needed.
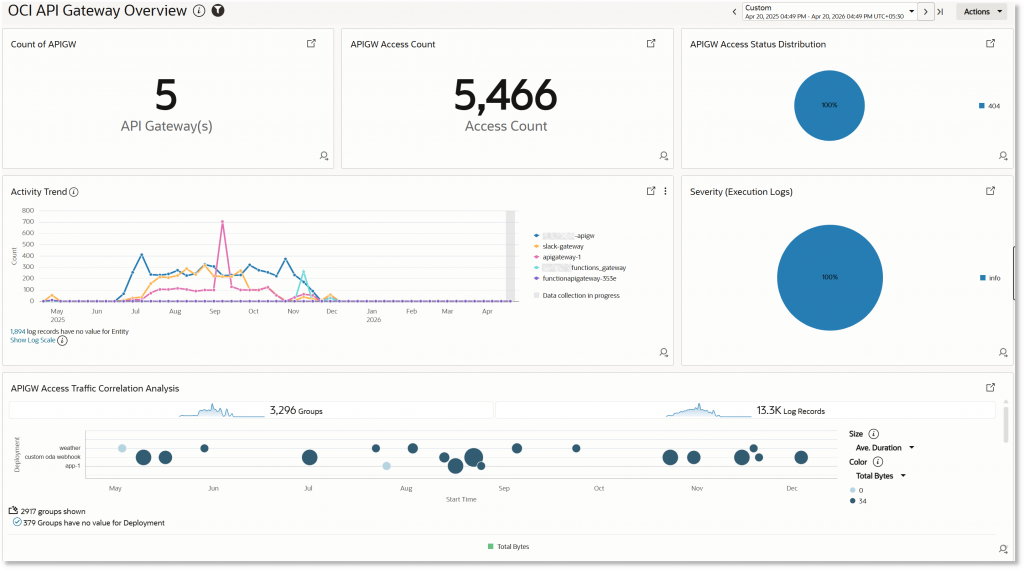
The dashboard includes widgets that help you move quickly from traffic overview to root-cause analysis:
- Count of APIGW
Shows the number of monitored API Gateways, giving you a quick sense of coverage across your environment. - APIGW Access Count
Tracks total request volume so you can understand load, adoption, and traffic growth. - APIGW Access Status Distribution
Breaks down requests by HTTP status to help you distinguish successful calls from client-side or server-side failures. - Activity Trend
Shows request activity over time, making spikes, drops, and unusual patterns easy to spot. - Severity (Execution Logs)
Surfaces execution-log severity so you can focus on warnings and errors that require attention. - APIGW Access Traffic Correlation Analysis
Helps correlate access traffic with anomalies and failures, giving you better context for investigating incidents.
Each widget is interactive, allowing you to drill down into the underlying logs in Log Explorer. That lets you move from high-level monitoring to detailed investigation without losing context.
This is your out-of-the-box operational view, ready to use after ingestion and designed to help you move from detection to diagnosis in seconds.
What you gain
By combining managed ingestion with built-in analytics, you get a complete observability workflow for your APIs:
- Faster troubleshooting and reduced mean time to resolution
- Near real-time visibility into traffic, failures, and latency
- Better performance analysis using duration trends
- Correlation across API Gateway and other OCI logs in Oracle Log Analytics
- A consistent observability model for platform and DevOps teams
A modern approach to API observability
Observability is no longer just about collecting logs. It is about making them instantly useful.
With OCI API Gateway logs and Oracle Log Analytics, you now have:
- A streamlined ingestion pipeline
- Prebuilt intelligence through Oracle-defined dashboards
- A unified analytics layer for all your telemetry
This helps you to move from reactive troubleshooting to proactive operations, while keeping the workflow familiar and easy to extend.
Get started
If you are running OCI API Gateway today, your logs already contain valuable operational insights. Oracle Log Analytics gives you a faster way to see and use them.
With the Oracle-defined OCI API Gateway Overview dashboard, you can move from ingestion to analysis quickly and start understanding API health, traffic, failures, and performance without building every visualization from scratch.
It is not about replacing the workflow you already know. It is about making that workflow more immediate, more visual, and more useful.