In today’s cloud-native landscape, Observability is crucial for ensuring the reliability, performance, and scalability of applications built with Kubernetes and microservices. Observability provides a comprehensive view of an application’s behavior, allowing developers to identify performance bottlenecks, troubleshoot issues, and optimize their applications.
Oracle offers Observability and Management solutions for automatic instrumentation to support Observability. The Oracle Application Performance Monitoring (APM) Java Agent is one such solution that provides deep visibility into Java-based applications. Additionally, the OpenTelemetry Operator is another key offering that simplifies the process of instrumenting applications with OpenTelemetry.
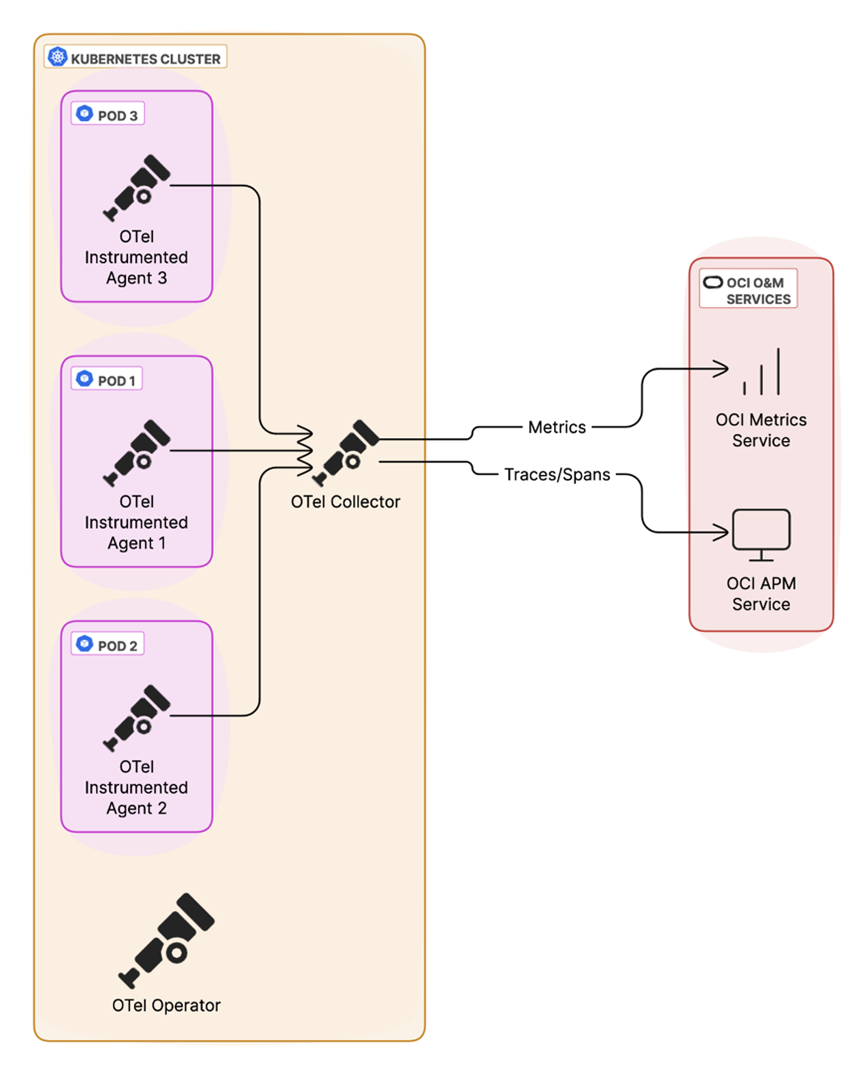
This blog showcases a fully OpenTelemetry (OTel) based approach of sending telemetry data from Kubernetes applications to Oracle’s Observability and Management (O&M) APM and Monitoring Services. This allows for standardization on OTel components like the Agent, Collector, and Operator. The approach provides flexibility and choice, allowing you to pick the solution that fits your needs. In addition, we will highlight how to send logs to Logging Analytics.
Choice is important when designing an Observability solution
We already understand that a comprehensive observability solution is key, which may mean different solutions are needed depending on requirements. You may be looking at a single vendor for a solution or have a vendor-neutral view, or you may have a requirement to integrate with other systems to provide a consistent monitoring approach. Oracle offers several solutions that can be used in combination to meet these requirements. Let’s examine the OpenTelemetry option of sending telemetry data to OCI services.
Oracle Application Performance Monitoring Agents to instrument applications
Oracle Application Performance Monitoring service provides several agents to instrument your applications, which can be configured to send telemetry data directly to APM without the need of an OTel collector, if required:
- APM Java Agent: For automatic instrumentation of Java applications
- APM .NET Agent: For .NET applications running on Windows
- APM Browser Agent: For monitoring performance in user browsers
- APM Java Tracer: Provides more control over tracing of java applications
These agents, along with the support for OpenTelemetry and open-source tracing tools like Jaeger and Zipkin (as detailed here), demonstrate Oracle’s diverse observability solutions. You can also send metrics to the OCI Monitoring service and logs to the Logging Analytics Service from Kubernetes and your applications. This combined provides a comprehensive view of your application performance, health, and troubleshooting.
OpenTelemetry approach to collect and export data
OpenTelemetry provides a set of tools that work together to collect and export telemetry data. Let’s look at the key components in the ecosystem:
- OpenTelemetry Agent: The Agent resides within your Kubernetes pods or containers, automatically capturing telemetry data from your applications. There are multiple language specific agents that can be used and an auto-instrumentation option, depending on your application environment. We will look at the auto-instrumentation option.
- OpenTelemetry Collector: Although the Collector is optional when sending data to the backend it has great advantages dependent on your setup. The Collector can act as a central hub for receiving telemetry data from Agents. It filters out or enriches telemetry data and can be configured to send to multiple backends. It allows data to be routed and processed according to your specific needs.
- OpenTelemetry Operator: The Operator simplifies the management and deployment of OpenTelemetry components in Kubernetes. It automates tasks such as installation, scaling, and upgrades.
Installing OpenTelemetry toolset in Kubernetes environment
Integrating OpenTelemetry into your Kubernetes environment involves a few steps. There are several ways to install the OTel Operator, Collector and Agents. Below is just one example. Please refer here for options and detailed information.
Step1: Install the OpenTelemetry Operator
The Operator automates the lifecycle management of our instrumentation. In most cases a prerequisite of the cert-manager is required.
Install the Cert-Manager:
kubectl apply -f https://github.com/cert-manager/certmanager/releases/latest/download/cert-manager.yaml
Then, install the OpenTelemetry Operator manifest:
kubectl apply -f https://github.com/open-telemetry/opentelemetry-operator/releases/latest/download/opentelemetry-operator.yaml
Check the Operator pod is in a Running state before proceeding:
kubectl get pods -n opentelemetry-operator-system
Step 2: Configure the OpenTelemetry Collector
The Collector acts as the intermediary between your applications and O&M Services. See below an example of an OpenTelemetry-collector.yaml file which creates a OpenTelemtryCollector Custom Resource (CR) that defines the configuration for this collector.
apiVersion: opentelemetry.io/v1alpha1

kind: OpenTelemetryCollector  # The type of resource we are creating

metadata:

  name: OpenTelemetry-collector # Name of the collector (can be anything descriptive)

  namespace: my-app # Namespace where the app is installed (adjust as needed)

spec:

  mode: deployment # Deployment mode for the collector

  serviceAccount: default

  config: >

    receivers: # Defines where to receive telemetry data

      otlp: # Receiver for OpenTelemetry Protocol messages

        protocols:

          grpc: # Enable gRPC protocol

          http: # Enable HTTP protocol

    processors: # Modify or enrich telemetry data before sending it to exporters

      batch: # Batch processor for efficiency

    exporters:

       otlphttp/ociapm: # Exporter for sending traces to OCI APM

         endpoint: "https://123456789abcdefgh.apm-agt.us-ashburn-1.oci.oraclecloud.com/20200101/opentelemetry/" # Endpoint URL (see note below, to find your endpoint)

         headers:

            Authorization: "dataKey ABCDEFGH123456789" # APM private key

       otlphttp/ocimetrics: # Exporter for sending metrics to OCI Metrics

         endpoint: "https:// 123456789abcdefgh.apm-agt.us-ashburn-1.oci.oraclecloud.com/20200101/observations/metric?dataFormat=otlp-metric&dataFormatVersion=1" # Endpoint URL (see note below, to find your endpoint)

         headers:  # Authorization header

           authorization: "dataKey ABCDEFGH123456789"

         tls:

           insecure: false # Disable insecure connections

    service:

      pipelines:

        traces:   # Pipeline configuration for traces

          receivers: [otlp]

          processors: [batch]

          exporters: [otlphttp/ociapm]

        metrics:  # Pipeline configuration for metrics

          receivers: [otlp]

          processors: [batch]

          exporters: [otlphttp/ocimetrics]

  resources: # Resource limits and requests

    limits:

      cpu: 1

      memory: 2Gi

    requests:

      cpu: 0.5

      memory: 1G
Note: The Endpoint URL is where the data is uploaded. The authorization data key allows APM to accept telemetry data. To find your endpoint and data key please follow the instructions here.
Step 3: Deploy the Collector
Once the configuration is ready, deploy the collector using:
kubectl apply -f OpenTelemetry-collector.yaml
After running this command, Kubernetes will create the necessary resources based on your OpenTelemetry-collector.yaml definition.
You can check if the OpenTelemetry Collector is running:
kubectl get pods -n <your_namespace>
You should see a pod name something like OpenTelemetry-collector-xxxx in a running status.
Step 4: Instrument the application with the agent
Now let’s look at how to automatically instrument your application to send traces and metrics.
Below is a YAML (my-app-instrumentation.yaml) example of a Custom Resource (CR) that will instrument the application in Kubernetes – a Java application in our case.
apiVersion: opentelemetry.io/v1alpha1

kind: Instrumentation

metadata:

  name: my-app-instrumentation # Name of the instrumentation resource

  namespace: my-app # Namespace where your application is running

spec:

  java:

    image: ghcr.io/open-telemetry/opentelemetry-operator/autoinstrumentation-java:2.5.0 # Java auto-instrumentation image


  env:

    exporting

    - name: OPENTELEMETRY _TRACES_EXPORTER # Enable OTLP (OpenTelemetry Protocol) for trace

      value: otlp

    - name: OPENTELEMETRY _EXPORTER_OTLP_ENDPOINT # Endpoint where traces will be sent (see note below)

      value: "http://OpenTelemetry -collector.my-app:4318"

    - name: OPENTELEMETRY _EXPORTER_OTLP_PROTOCOL # Define the protocol used for trace exporting

      value: "http/protobuf"

    - name: OPENTELEMETRY _METRICS_EXPORTER # Enable OTLP for metrics exporting

      value: otlp

    - name: OPENTELEMETRY _EXPORTER_OTLP_METRICS_ENDPOINT # Endpoint where metrics will be sent

      value: "http://OpenTelemetry -collector.my-app:4317"

    - name: OPENTELEMETRY _EXPORTER_OTLP_METRICS_PROTOCOL # Define the protocol used for metrics exporting

      value: grpc

    - name: OPENTELEMETRY _SERVICE_NAME # Define a unique service name to identify telemetry data from this application

      value: "my-java-app"
Note: The OPENTELEMETRY _EXPORTER_OTLP_ENDPOINT varies depending on your setup. To find out how to construct your Endpoint:
kubectl get services -n <namespace>
Look for a service name and add the namespace and port, i.e. <service-name>. <namespace>.<port>
Now that the YAML is ready, let’s apply it:
kubectl apply -f my-app-instrumentation.yaml
Let’s check if the instrumentation has been applied:
kubectl get instrumentation -n my-app
Step 5: Integrate the agent into the application using Annotation
Now that we have our OTel toolset installed, the final step is to tell Kubernetes to integrate the agent into our application, this is done by annotation. Annotation can be applied at different levels (Deployments, StatefulSets and Namespaces) in this example we will use StatefulSets.
kubectl edit statefulset <statefulset-name> -n <namespace>
Under metadata, add the annotation:
metadata:

  annotations:

    instrumentation.opentelemetry.io/inject-java: "true"
Now, restart the StatefulSet to apply the changes:
kubectl rollout restart statefulset <statefulset-name> -n <namespace>
Or, restart the pods where auto-injection should be applied:
kubectl delete pod <your-pod-name> -n <your-namespace-name>
The setup is complete, and we should see the traces/spans and metrics in the OCI O&M services.
Completing Observability with Logs for Kubernetes cluster visibility
We have shown how to get traces, spans and metrics. Logs can also be sent to OCI O&M Services to give complete visibility into your Kubernetes cluster by using the OCI Management Agent and Fluentd. For easy to follow instructions on this, see here.
Observability is paramount in cloud-native application environments, and we have a variety of ways to achieve it. Oracle provides an array of agents for specific technologies, including Java, .NET, and browsers, while supporting open-source tracing solutions. The OpenTelemetry toolset – Agent, Collector, and Operator, offers a flexible and vendor-neutral alternative for those seeking standardisation and control.
The best path for your organization depends on your specific requirements and preferences. Please explore all solutions, both Oracle’s and OpenTelemetry’s to find the one that best meets your needs. Whichever path you choose to send your telemetry data, OCI’s Observability and Management Services will enhance your troubleshooting, monitoring performance and provide great insights into your applications. Why not get started by trying APM for free?
Resources:
- Read about O&M’s latest insights, trend, blogs.
- Visit OpenTelemetry Operator for the Kubernetes page.
- Try some O&M Labs.
- Read the APM documentation.