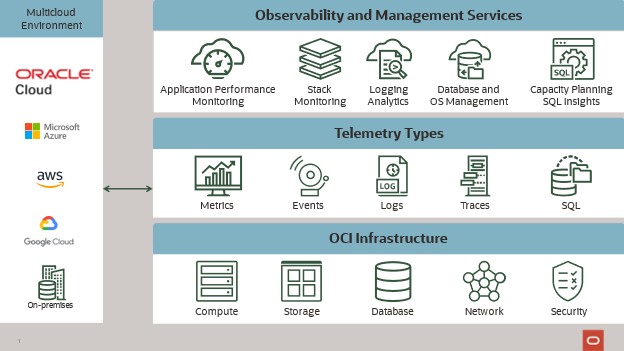
Monitoring solutions are pivotal in providing insights into technology stacks and applications. The monitoring landscape typically includes specialized tools for logs, application performance, and database performance. While these tools excel in their specific areas, integrating insights across services can significantly enhance monitoring operations.
OCI Observability and Management offers a holistic solution by uniting application performance, database performance, log analysis, stack monitoring, and capacity planning. These services are interconnected through cross-service dashboards and defined drilldowns, enabling seamless navigation between services for deeper insights.
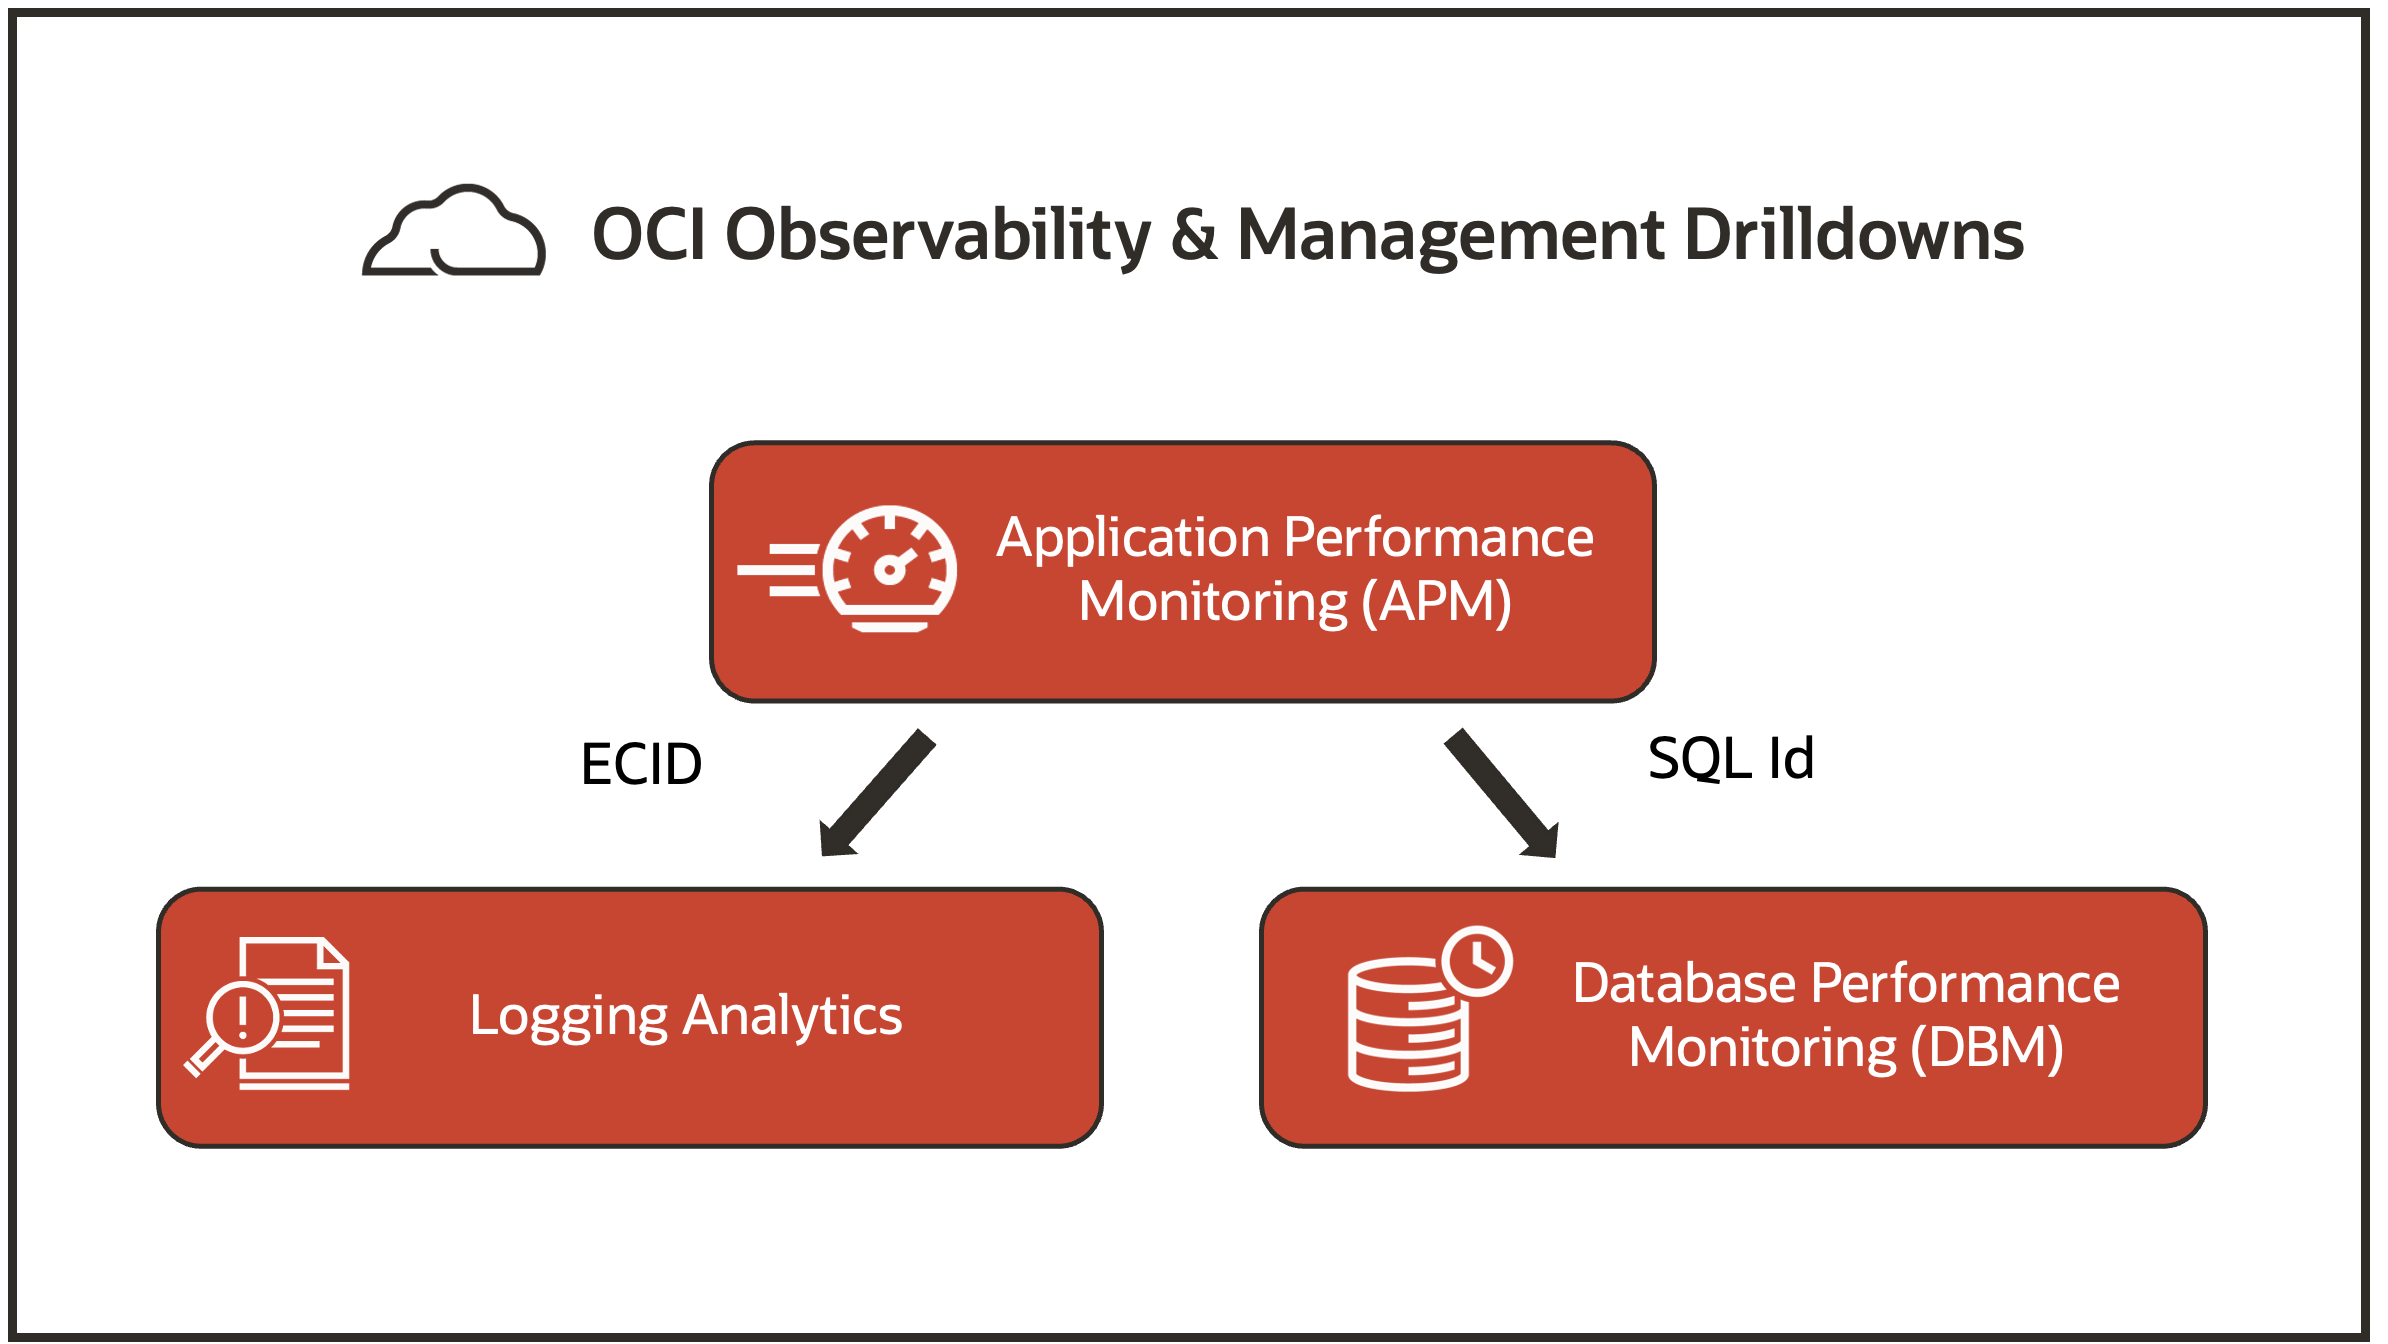
In this blog, we demonstrate how to configure drilldowns from OCI Application Performance Monitoring (APM) to OCI Database Management (DBM) and OCI Logging Analytics for addressing performance issues in an Oracle E-Business Suite (EBS) environment. The goal is to streamline triaging actions for better performance management.
OCI Application Performance Monitoring tracing for visibility into application performance
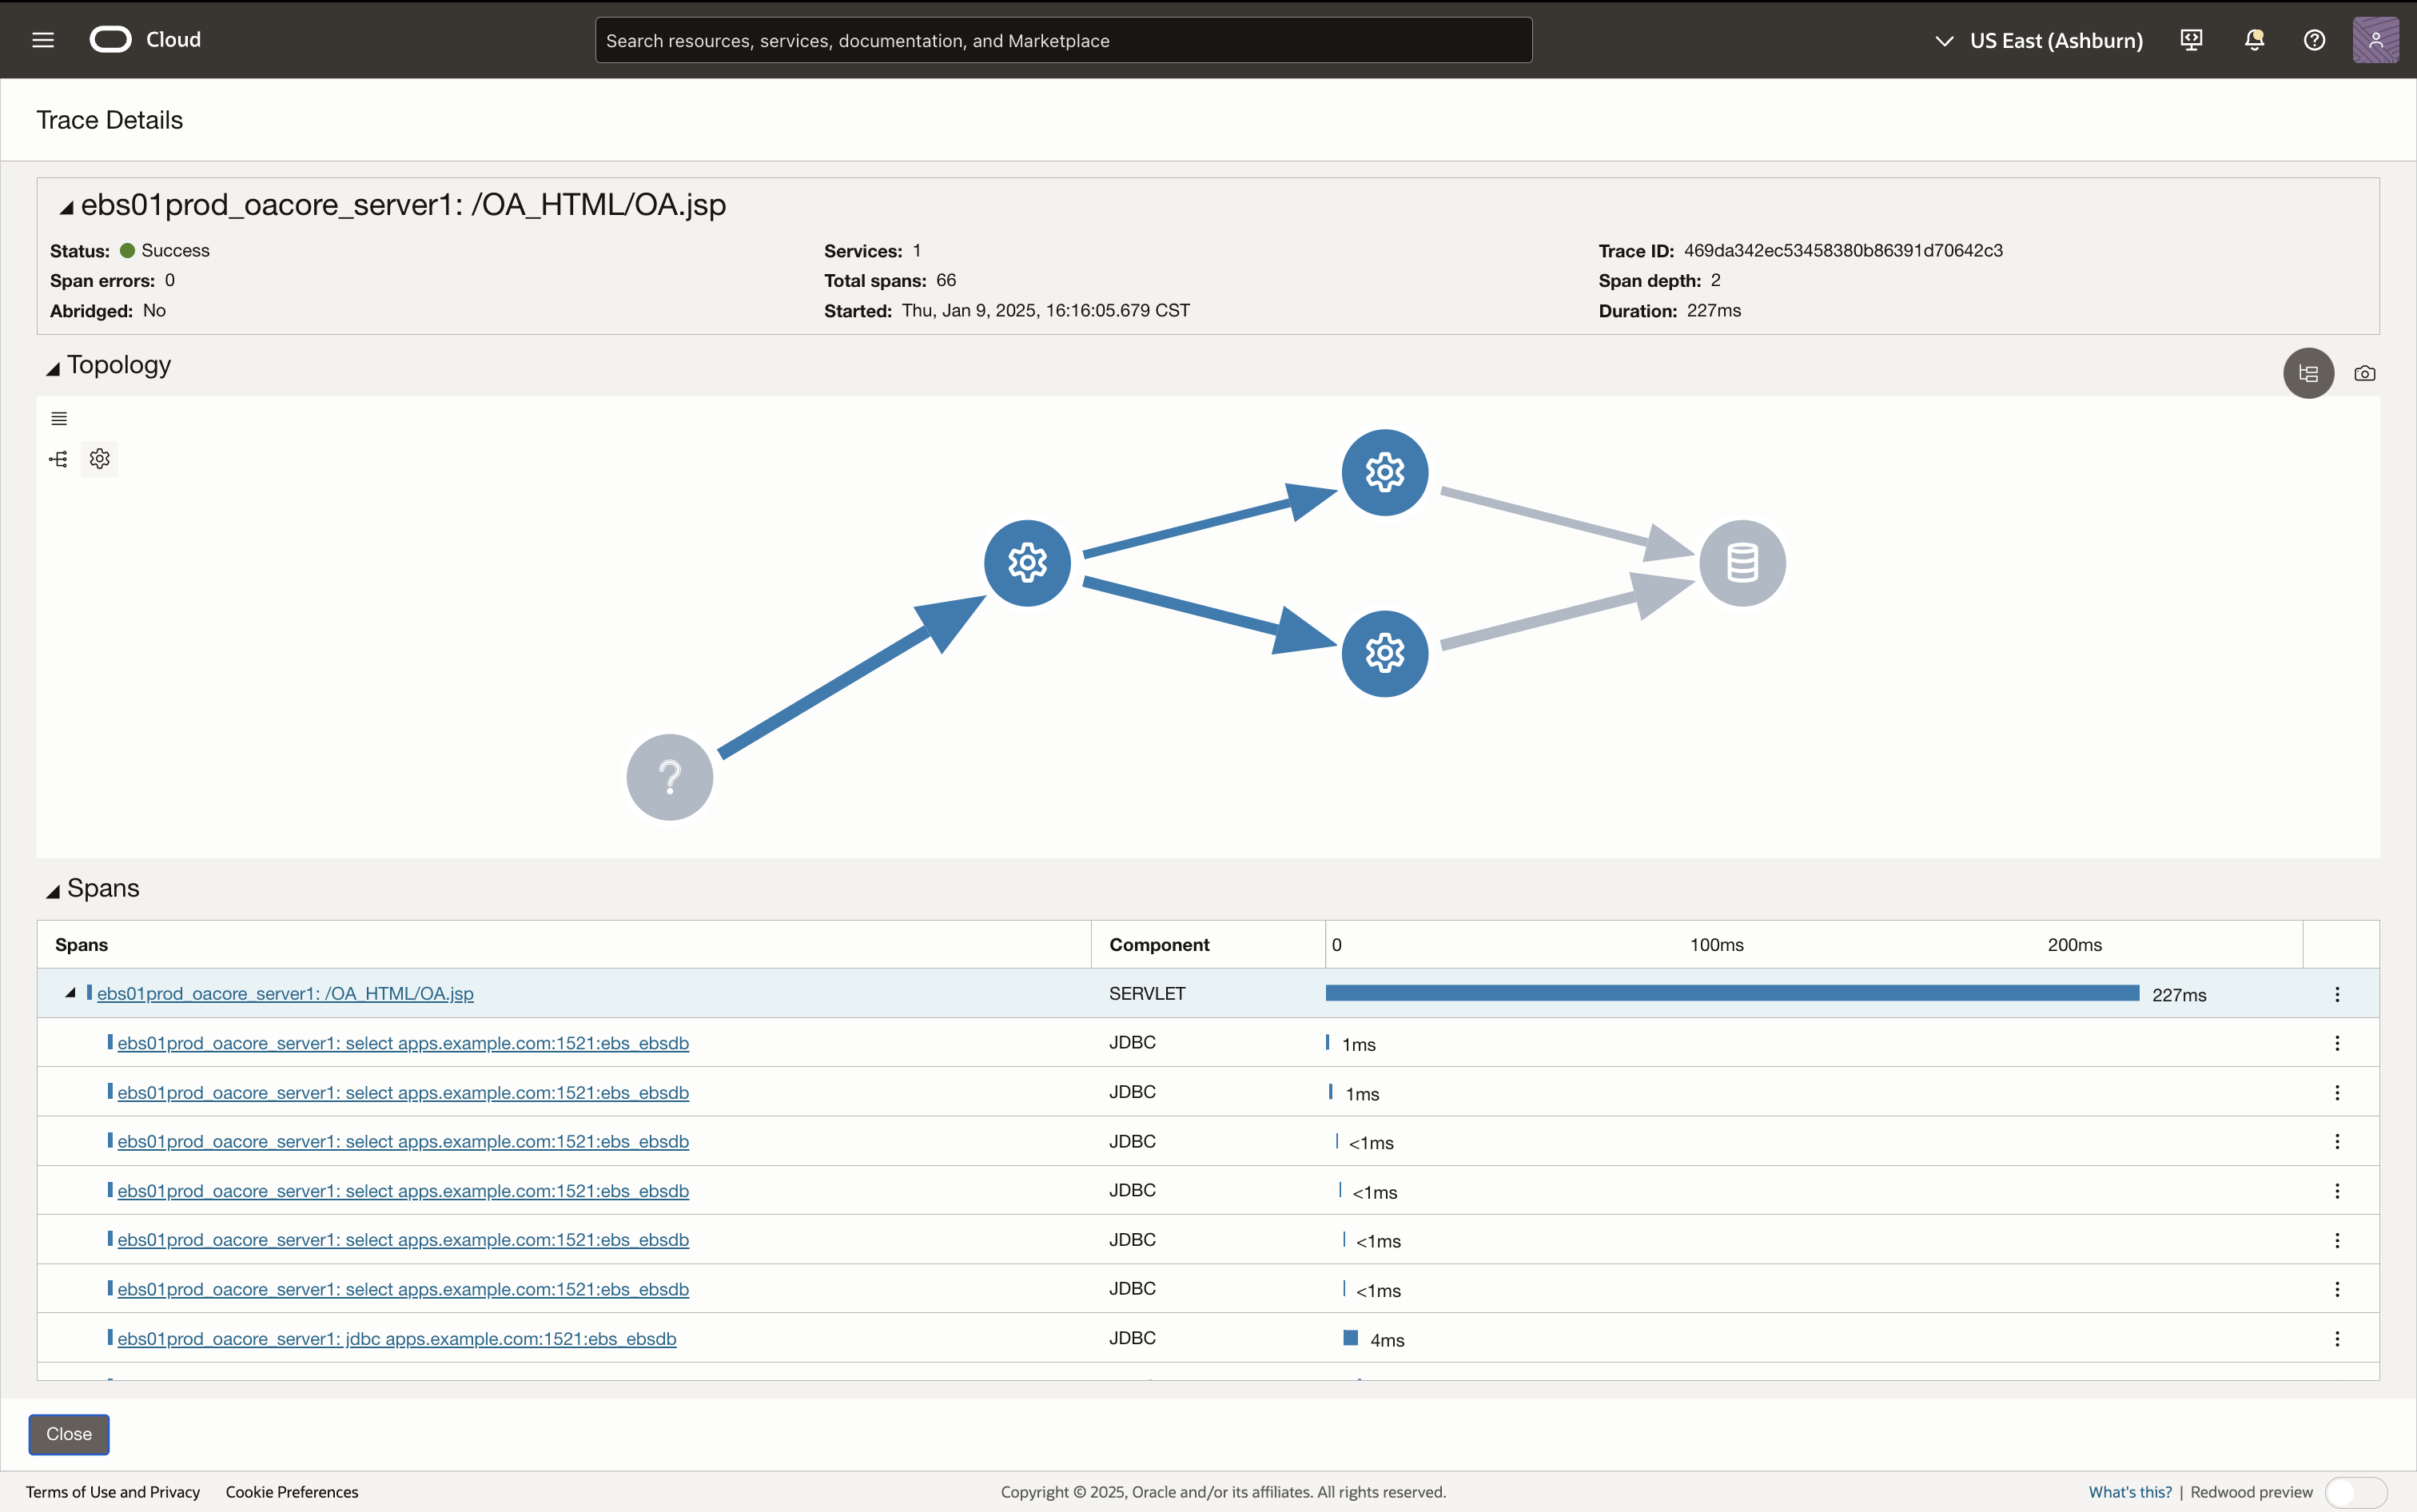
OCI Application Performance Monitoring (APM) provides end-to-end visibility into application performance using OpenTelemetry standards. It collects trace data from applications, allowing users to search:
- Calls made by the application
- User experience
- Errors details
- Latency
- Topology
APM allows you to quickly identify and resolve application bottlenecks, ensuring optimal performance and a seamless user experience.
OCI Database Management Performance Hub simplifies views with a unified interface
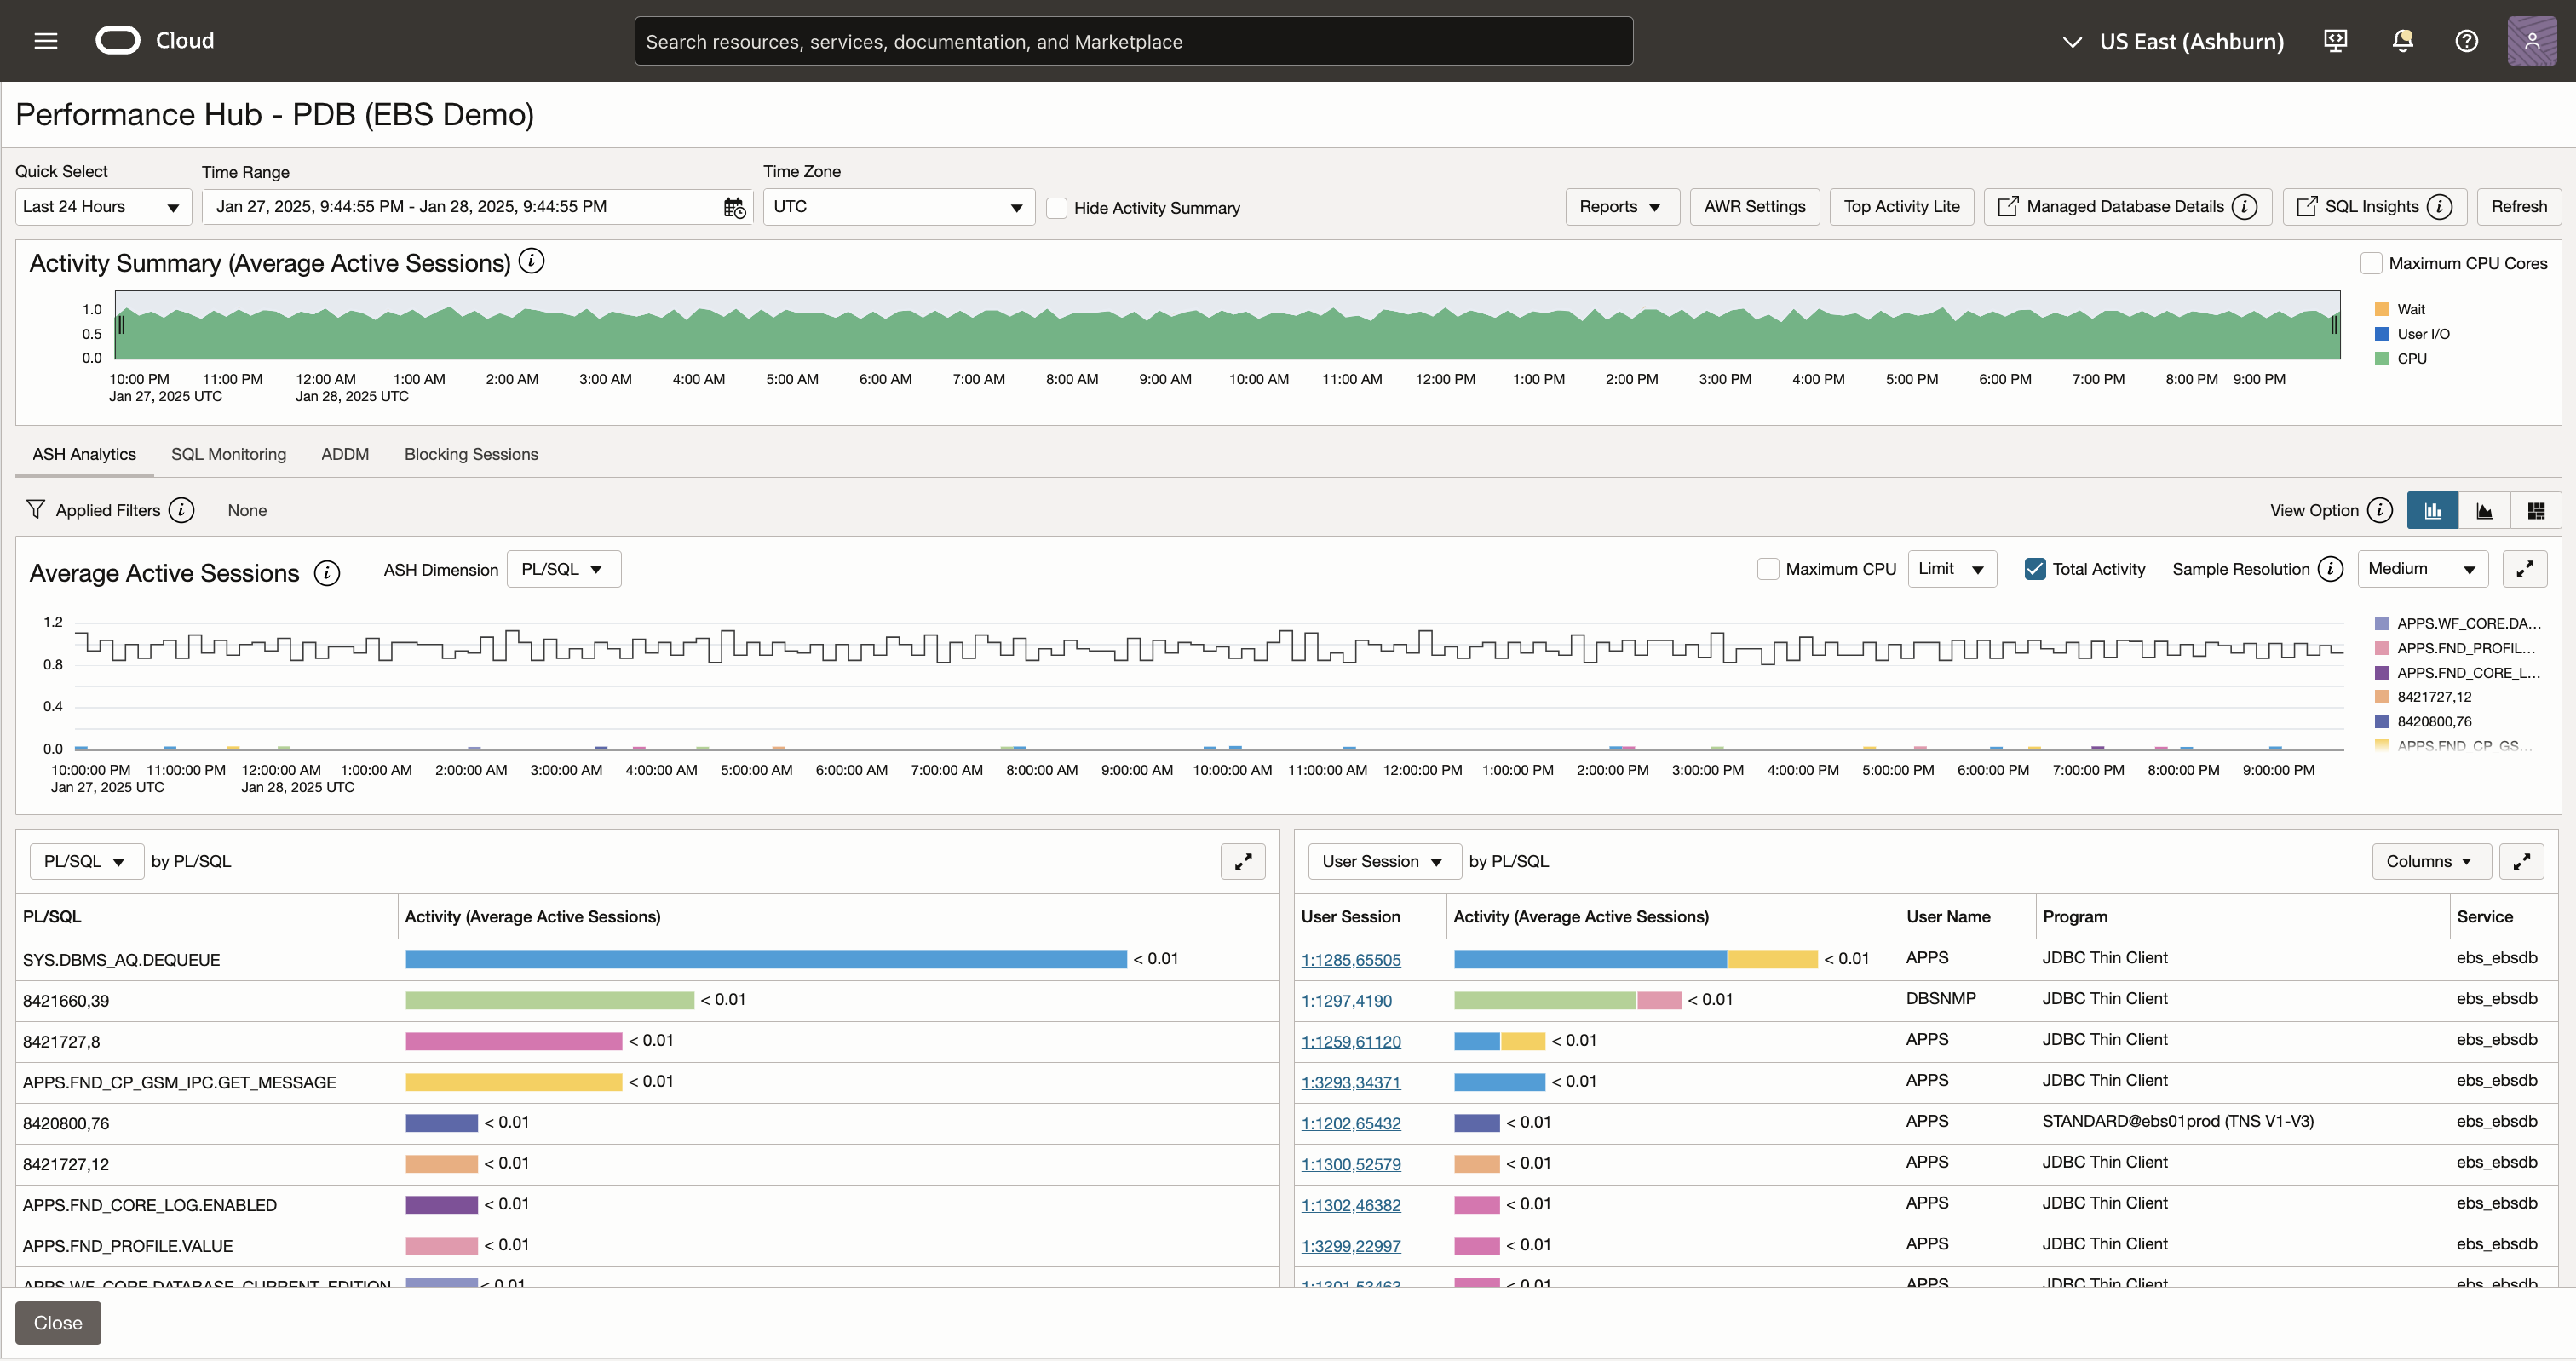
OCI Database Management (DBM) simplifies the management of databases through a unified interface. The DBM Performance Hub offers comprehensive views of database activity and performance, with the ability to view:
- SQL Details
- Execution Statistics
- Blocking Sessions
- Historical SQL Monitoring Reports
DBM provides insights into database performance, enabling you to proactively address issues and maintain high availability and efficiency. This makes DBM a natural extension for triaging database-related performance issues identified in APM.
OCI Logging Analytics Log Explorer provides tools to analyze log data
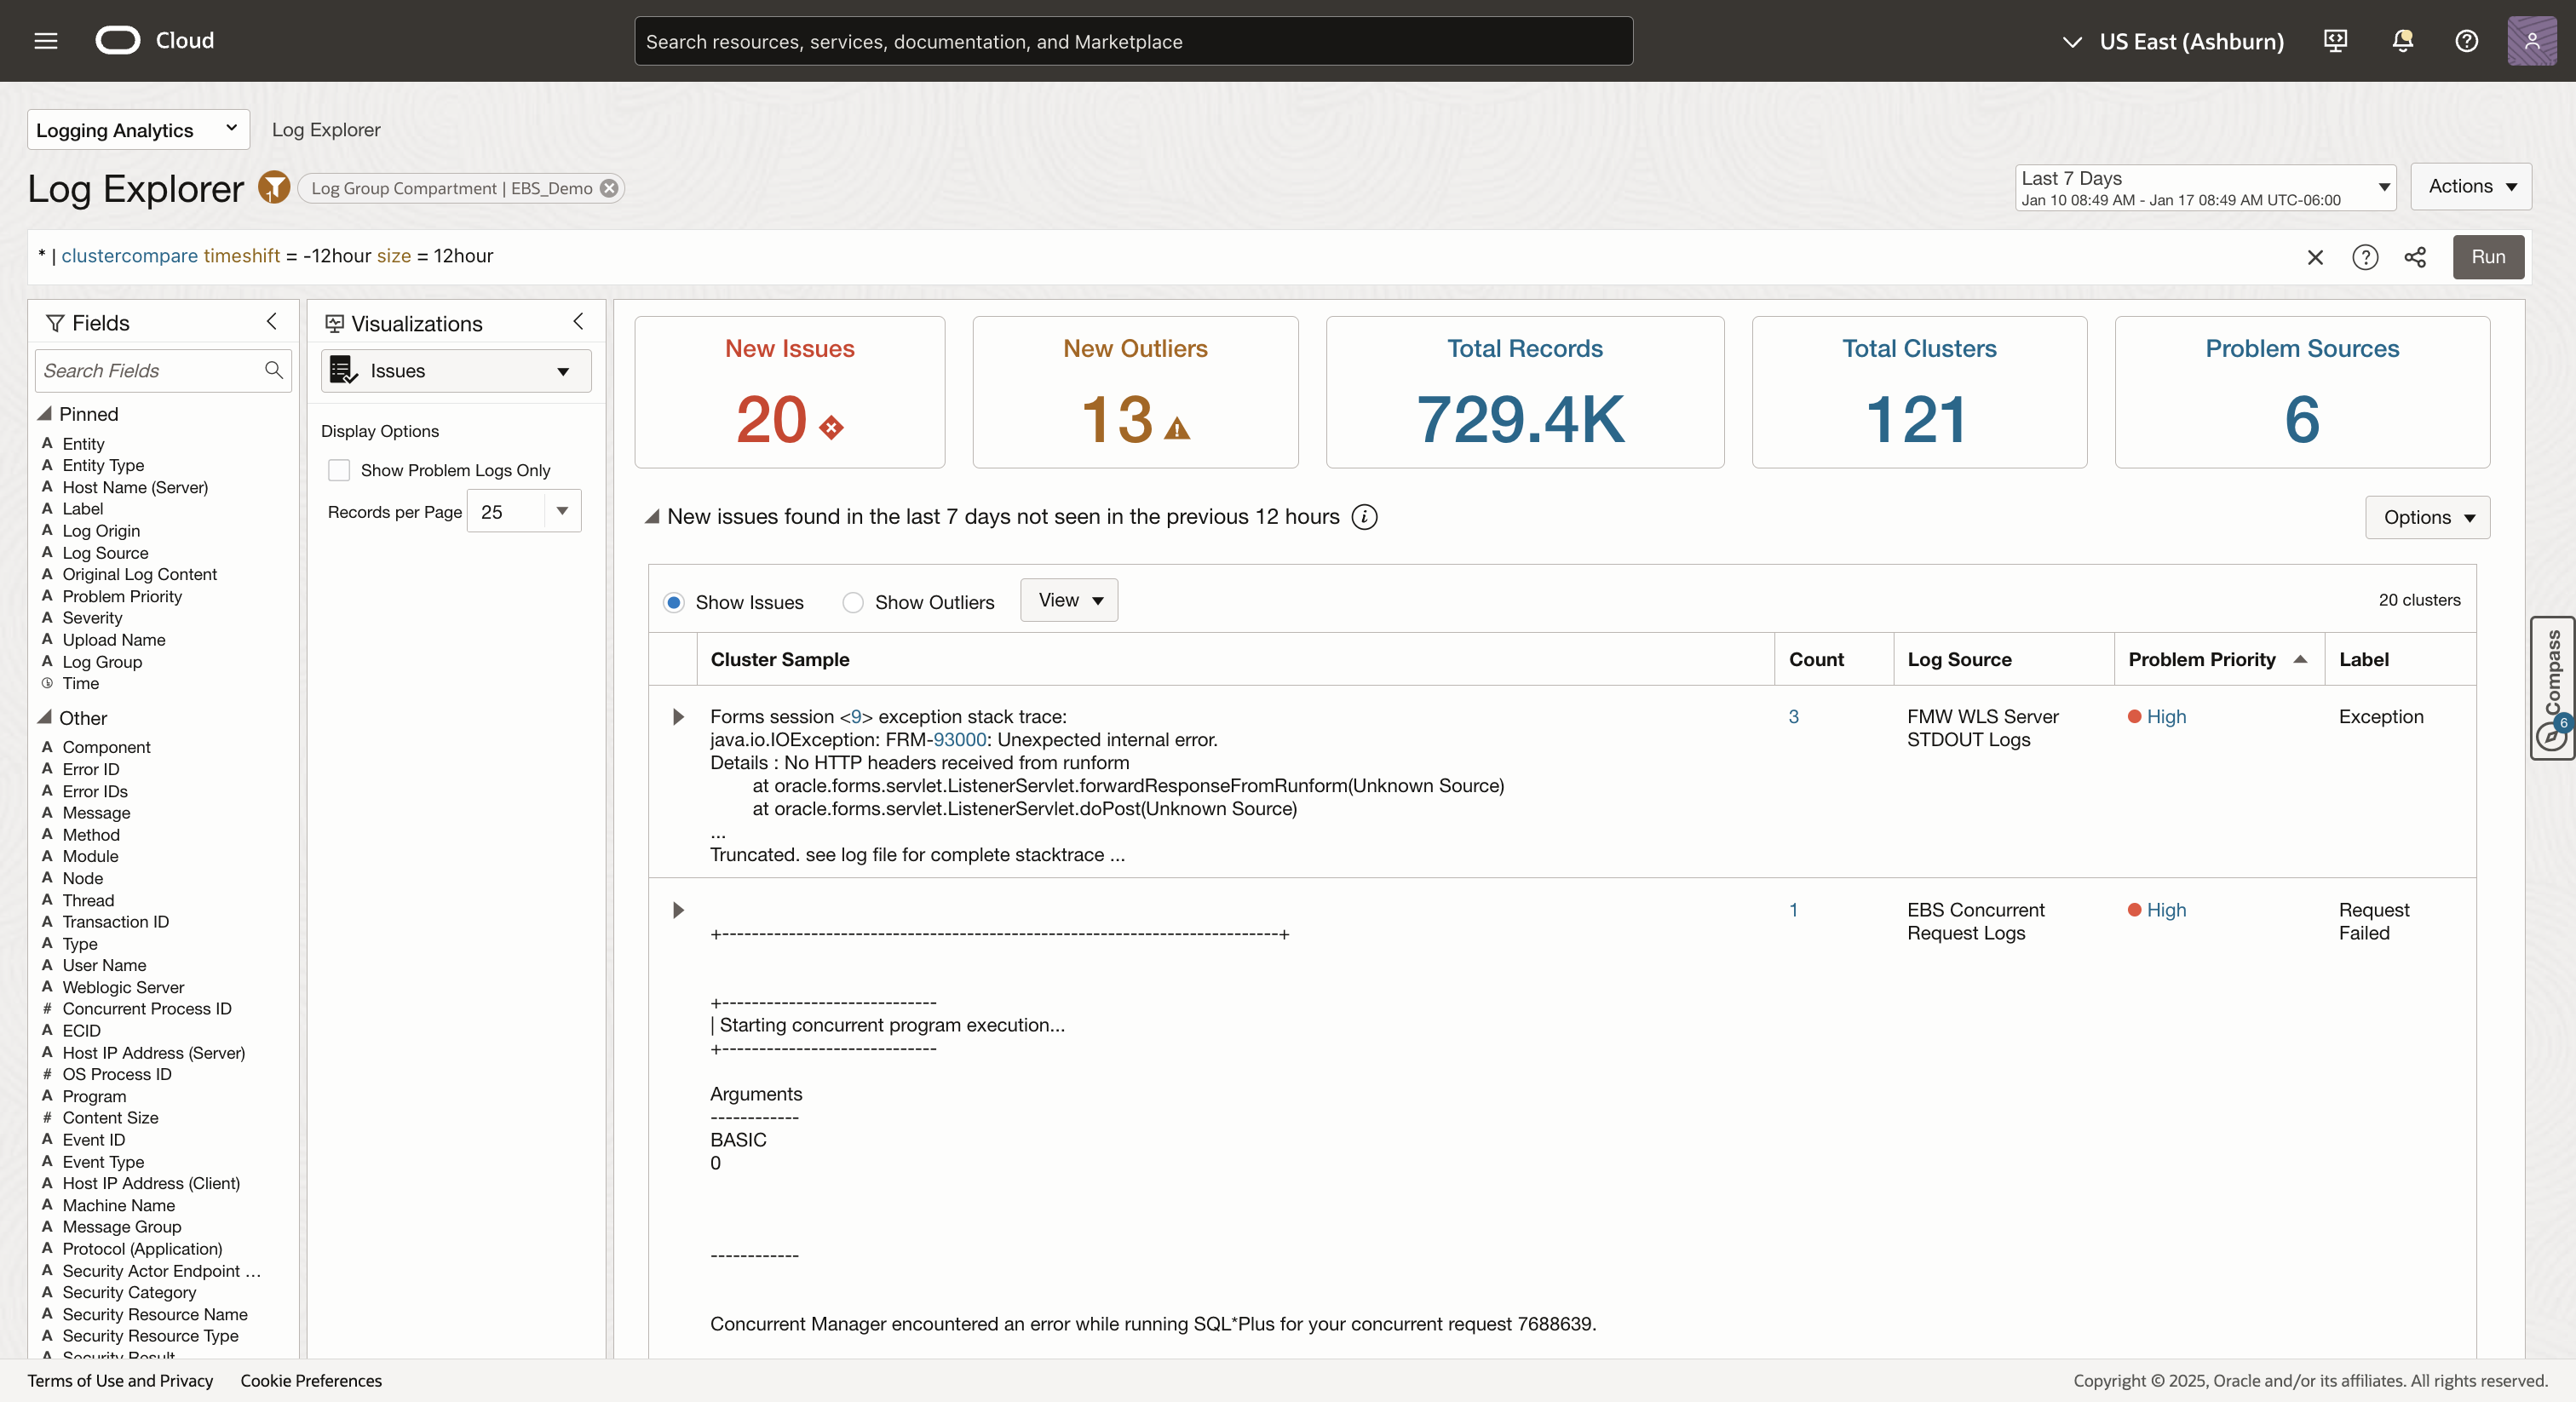
Logging Analytics enables streamlined log management and analytics through an intuitive interface. The Log Explorer provides powerful tools to analyze log data from applications and system infrastructure, such as:
- Data Visualization
- Log Pattern Analysis
- Anomaly Detection
- Advanced Search Queries
Logging Analytics delivers actionable insights by identifying trends, anomalies, and root causes within log data. It complements APM’s tracing abilities and provides more context with log data.
Getting started
Follow the steps for setting up APM, DBM, and Logging Analytics. Once everything is set up, you will be ready to configure drilldowns.
Setting up OCI Application Performance Monitoring
To begin using APM, follow these steps to create an APM domain and install the Java agent on your EBS environment:
- Create an APM Domain
Refer to the APM Documentation on how to create an APM Domain.
- Install the APM Java Agent
Follow the OCI guide for configuring APM for E-Business Suite to install the Java agent and start monitoring your EBS environment.
- Configure Real User Experience Insight to Monitor Forms (Optional)
If you would like to monitor EBS forms, follow the OCI guide for configuring RUEI OCI Marketplace application.
Setting up OCI Database Management
DBM requires a Management Agent to discover and manage databases. Once installed, you can enable DBM for the relevant database targets.
- Install Management Agents
Refer to the OCI’s guide on Management Agents for detailed installation instructions.
- Enable Database Management
Enable DBM for your database by following the OCI Database Management documentation.
Setting up Logging Analytics
Logging Analytics also requires the Management Agent to collect and send logs to OCI. You can use the same Management Agent for both DBM and Logging Analytics. Once installed, you can direct it to the log directories and start ingesting log data.
- Install Management Agents
Refer to the OCI guide on Management Agents for detailed installation instructions.
- Setting Up Continuous Log Collection
Refer to the OCI documentation on Logging Analytics for the steps needed to collect log data.
Configuring drilldowns in APM for seamless integration
Drilldowns enable seamless navigation between OCI services by embedding links with trace context in APM. This feature is crucial for transitioning from APM trace data to actionable insights in other Observability & Management services, such as DBM and Logging Analytics.
Steps to configure drilldowns
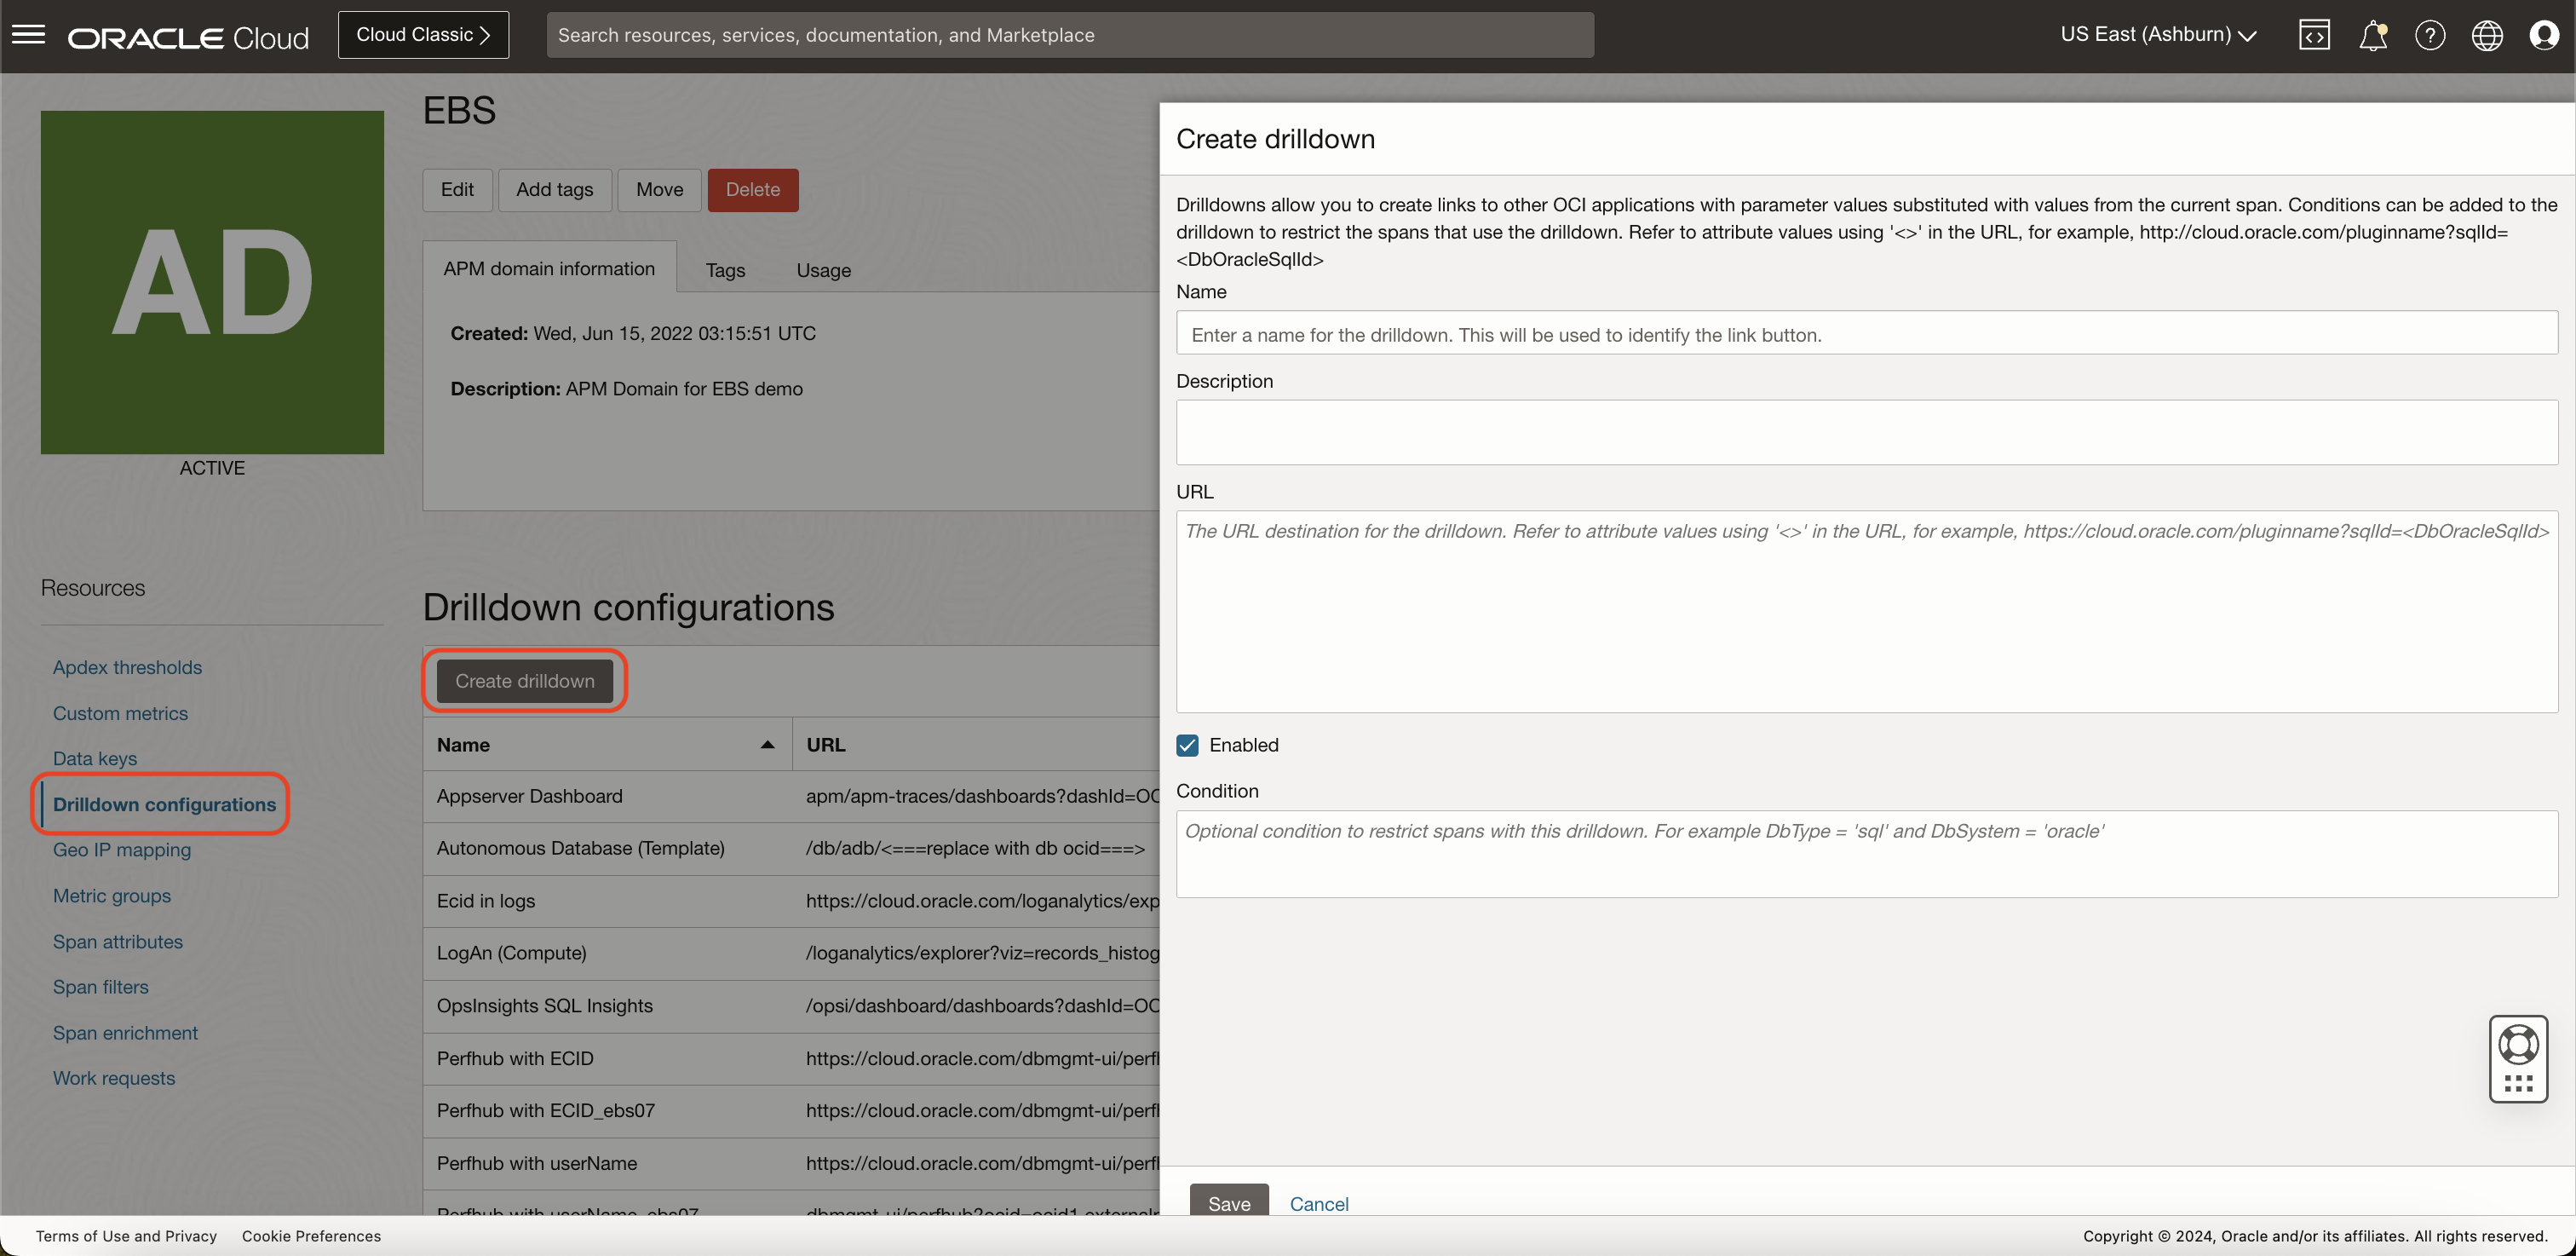
- Navigate to Observability & Management, then Application Performance Monitoring, and click on Administration in the OCI console.
- Select the APM domain created earlier and click Drilldown configurations.
- Provide a name, description, and URL for the drilldown. Use placeholders (e.g., <span_attribute>) to reference trace context dynamically.
- Save the configuration.
For more information about drilldowns, visit the APM drilldown documentation.
Drilldowns configuration examples
Here are two sample URLs for configuring drilldowns to DBM. Replace [PDB OCID] with your database’s OCID.
Drilldown to DBM Performance Hub by SQL ID
dbmgmt-ui/perfhub?ocid=[PDB OCID]&perfhubContext={


    "dateTime": {

        "startDate":<APMStartTimeMs>,

        "endDate":<APMEndTimeMs>

    },

    "viewPort": {

        "startDate": "<APMStartTimeMs>",

        "endDate": "<APMEndTimeMs>"

    },

    "selectedTab": {

        "name": "activityTab",

        "filters": [

            {

                "key": "filter_list",

                "value": "{\"sqlid\":{\"value\":\"<DbOracleSqlId>\",\"disabled\":false}}"

            }

        ]

    }

}
Drilldown to Logging Analytics by ECID
https://cloud.oracle.com/loganalytics/explorer?viz=records_histogram&query=ECID%20%3D%20%27<ECID>%27%20%7C%20timestats%20count%20as%20logrecords%20by%20%27Log%20Source%27&vizOptions=%7B%22customVizOpt%22%3A%7B%22primaryFieldIname%22%3A%22mbody%22%2C%22primaryFieldDname%22%3A%22Original%20Log%20Content%22%7D%7D&scopeFilters=lg%3Aroot%2Ctrue%3Brs%3A<OciCompartmentId>%2Ctrue&startTime=<APMStartTimeMs>&endTime=<APMEndTimeMs>®ion=<OciRegion>
Drilldown use cases to triage issues in EBS
Once the drilldowns are configured, follow these steps to triage issues in your EBS environment:
Analyzing SQL Performance
- Open Trace Explorer in APM and locate JDBC spans.
- Select a JDBC span to view more information.
- Use the drilldown button to navigate to DBM’s Performance Hub.
- Analyze the SQL or user activity in DBM to identify and resolve bottlenecks.
Use the following Trace Explorer statement to filter for JDBC spans which have an SQL ID:
show (spans) ServiceName, OperationName, DbOracleSqlId, DbOracleSessionId, DbUser, StartTime, DbStatementExecTime
where component = 'JDBC' and DbOracleSqlId is not omitted
order by DbStatementExecTime desc
Gathering more context from logs
- Open Trace Explorer in APM and locate a trace with an ECID.
- Select a trace to view more information.
- Use the drilldown button to navigate to Logging Analytics.
- Analyze the log messages to gain a better understanding of errors or other issues.
Use the following Trace Explorer statement to filter for traces which have an ECID:
show (traces) ECID, * where ECID is not omitted
Next steps
To maximize the value of integrating APM with DBM and Logging Analytics for monitoring and triaging, follow these actionable next steps:
- Deploy and configure APM, DBM, and Logging Analytics
- Set up an APM domain and install the APM Java agent to begin collecting application performance data.
- Install Management Agents and enable Database Management for your databases to start monitoring and optimizing database performance.
- Follow the steps for collecting Log data with Management Agents.
- Configure drilldowns for cross-services insights
- Configure drilldowns in APM to create seamless navigation links to Performance Hub and Log Explorer. Use attributes like SQL ID and ECID to link relevant trace data.
- Configure drilldowns in APM to create seamless navigation links to Performance Hub and Log Explorer. Use attributes like SQL ID and ECID to link relevant trace data.
- Analyze and optimize
- Use the configured drilldowns to investigate application, host, and database performance issues.
- Explore trace data in APM to identify slow spans, and drill into DBM to analyze SQL execution, resource utilization, and database activities.
- Identify error traces in APM and drill into the corresponding logs for more context.
- Leverage OCI’s Observability & Management ecosystem
- Expand on your observability strategy by integrating other OCI tools such as Stack Monitoring, and Operations Insights.
Integrating APM with DBM and Logging Analytics through drilldowns empowers organizations to transition seamlessly from application-level performance monitoring to more in-depth analysis. By leveraging this capability, EBS environments can achieve faster issue resolution and improved system performance.
Start enhancing your monitoring workflow by exploring OCI’s comprehensive Observability & Management tools today.
Resources
Here are additional resources to help you get the most out of OCI Observability & Management services: