Oracle Cloud Infrastructure (OCI) Application Performance Monitoring (APM) provides a comprehensive set of performance diagnostic capabilities to monitor and observe cloud-native and Oracle packaged applications. APM provides deep visibility into the performance of applications and provides the ability to diagnose issues quickly to deliver a consistent level of service. It includes observability of application components and logic spread across clients, third-party services, and back-end computing tiers, on-premises or on the cloud.
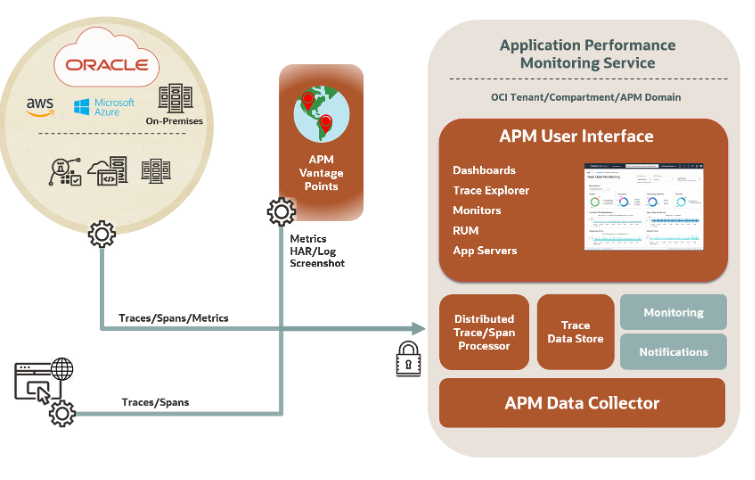
Application Performance Monitoring can be used for cloud-native environments and applications running on Oracle Cloud IaaS & PaaS, your premises, or any other public cloud. This blog reviews how to use APM to monitor an Oracle E-Business Suite environment running at your site.
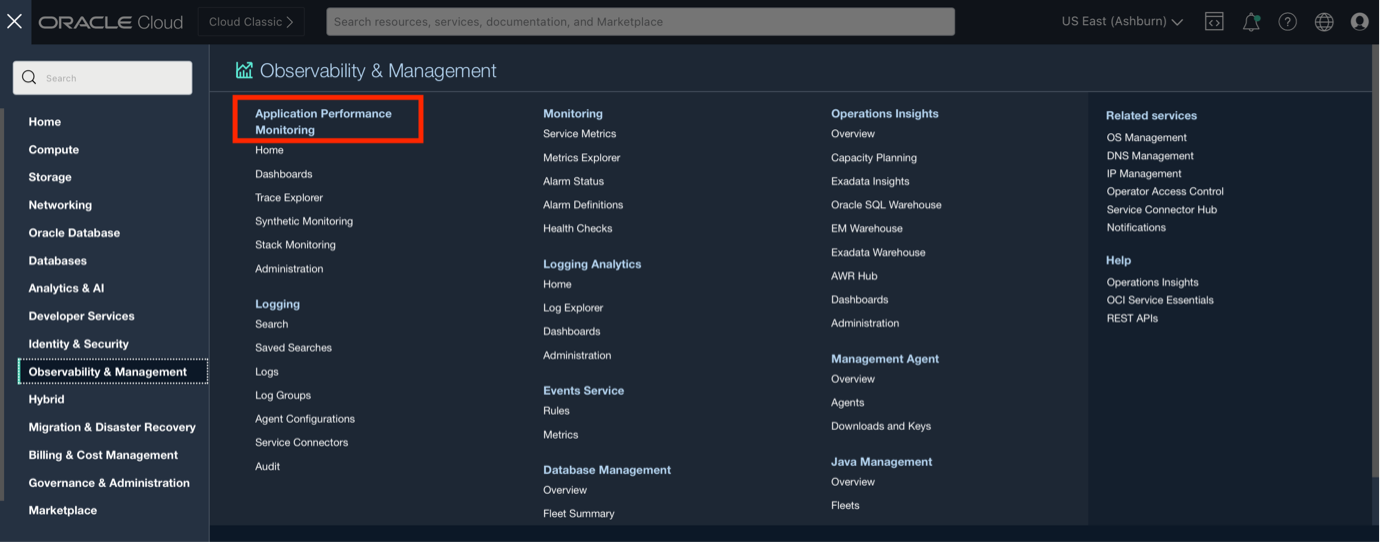
In the Oracle Cloud console, APM can be accessed under Observability & Management (O&M).
How to enable APM for applications:
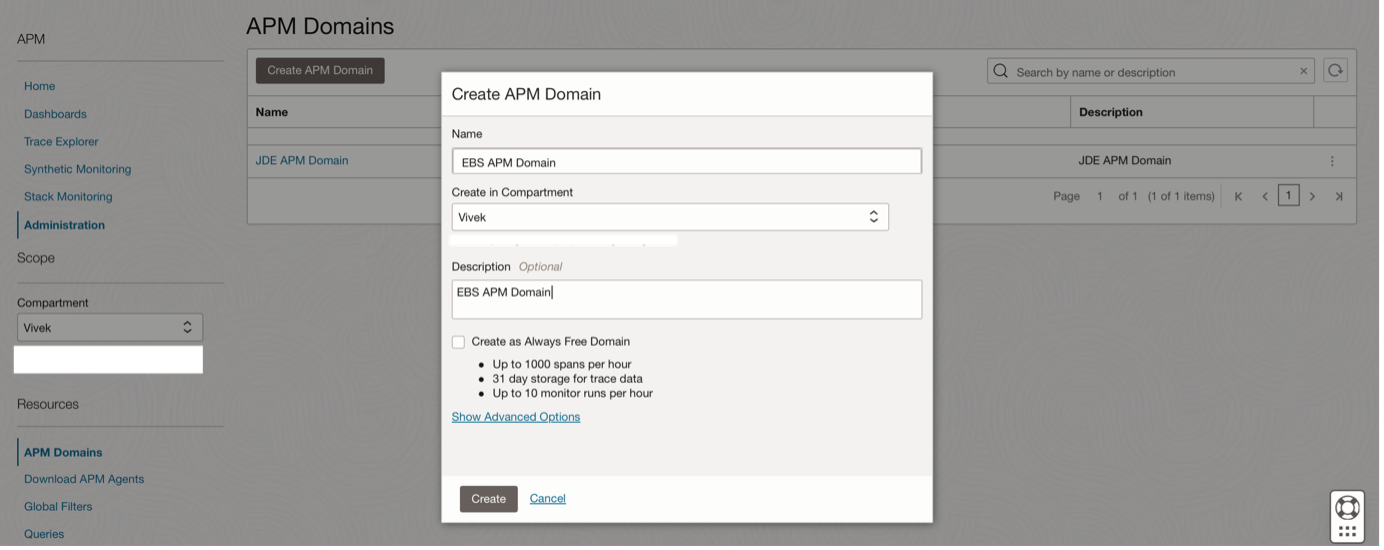
1. Create APM Domain
To start using APM an APM domain must be created. An APM domain is an OCI resource, which contains the systems being monitored by APM. To create an APM Domain, on the APM administration page, in the left pane, select the compartment in which you want to create the APM domain. On the APM Domains page, click Create APM Domain.
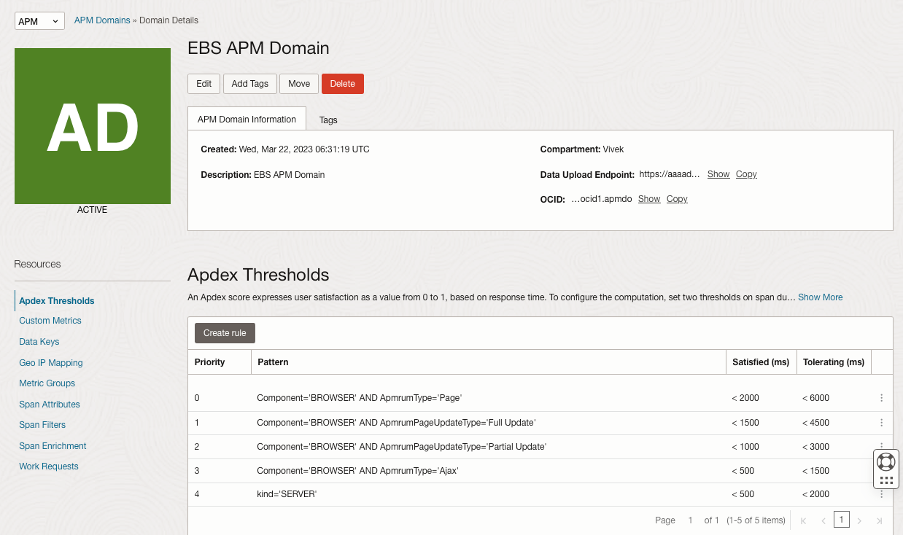
The APM domain is displayed on the APM Domains page and initially is in the Creating state. After the APM domain is created, the state changes to Active.
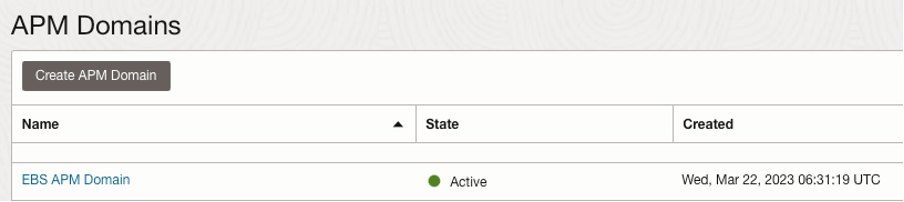
Once the APM Domain has been created click on the APM Domain to see the details:
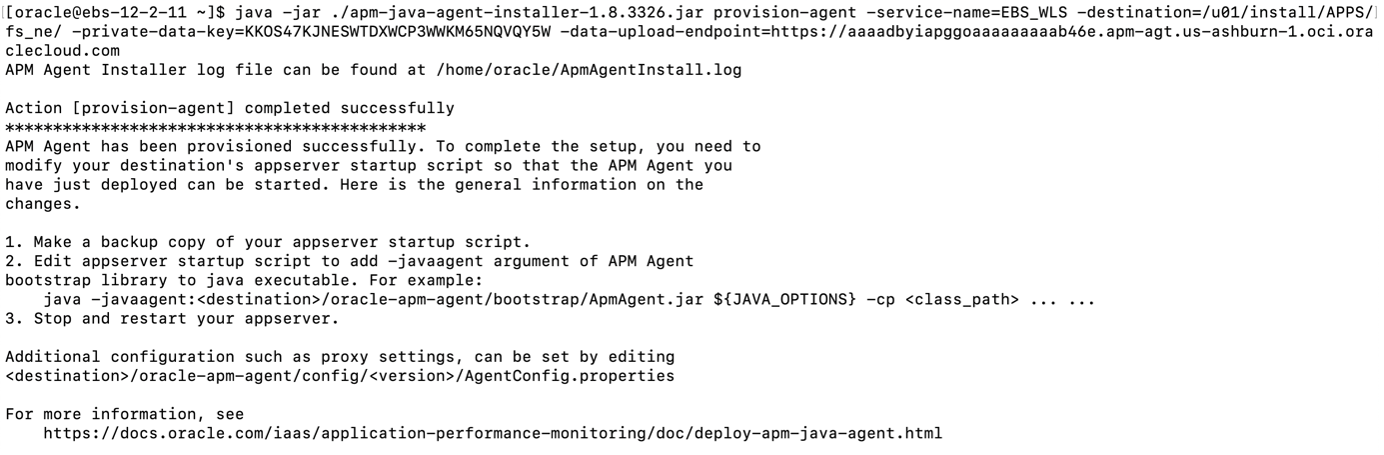
2. Provision and Deploy APM Java Agents on Application Servers
The APM Java agent records application server spans and metrics from application servers or JVMs and sends them to Application Performance Monitoring. Download the APM Java Agent and install it on the Application Servers.
3. Enable the APM Java Agent in the WebLogic Managed Server
To enable access to Oracle E-Business Suite from Oracle Application Performance Monitoring, JVM configuration changes must be made to the WebLogic Managed Servers.
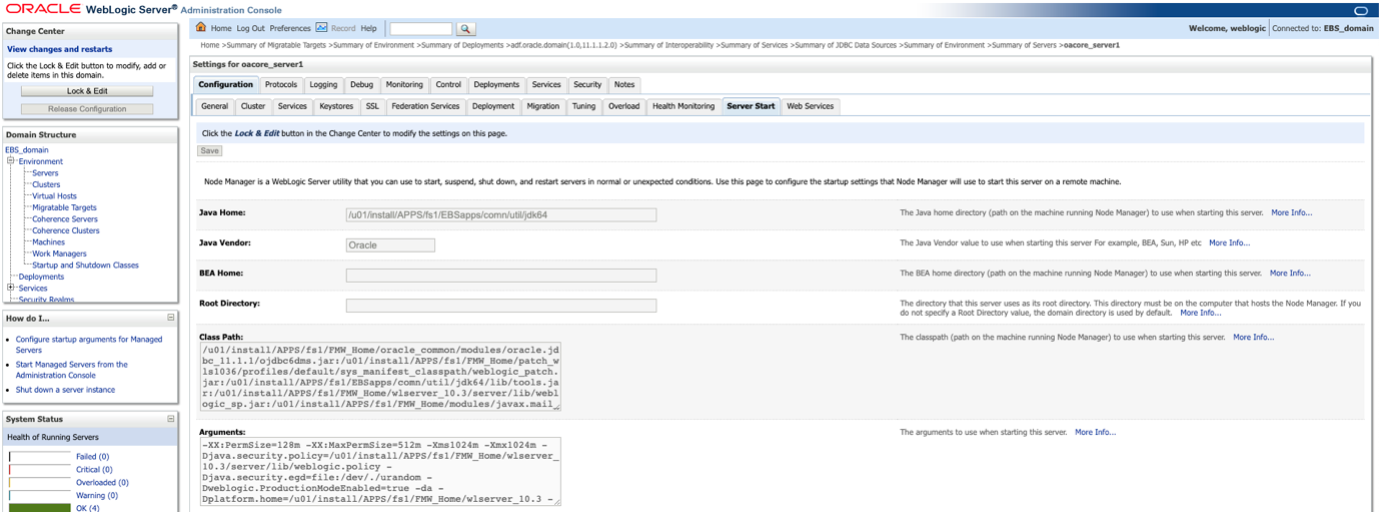
Perform the following steps on each of the managed servers of the oacore and oafm services from the Weblogic Server Console:
In the Change Center, click Lock and Edit. Update the Arguments field with the parameters required for Oracle Application Performance Monitoring. Ensure that the existing arguments are not altered.
For oacore service, add the following:
-java agent:<PATH_TO_fs_ne>/oracle-apm-agent/bootstrap/ApmAgent.jar -Dcom.oracle.apm.agent.service.name=oacore
For oafm service, add the following:
-java agent:<PATH_TO_fs_ne>/oracle-apm-agent/bootstrap/ApmAgent.jar -Dcom.oracle.apm.agent.service.name=oafm
Repeat all the above steps for each of the managed servers of the oacore and oafm services until each managed server has the JVM arguments updated.
Restart the managed servers using the script available at $ADMIN_SCRIPTS_HOME in the Oracle E-Business Suite environment for stopping and starting the managed servers.
4. Configure the RUEI OCI Marketplace Application
If you want to monitor EBS Forms-based applications, you need to configure a RUEI instance already deployed in OCI Marketplace.
Deploying RUEI in OCI Marketplace is the recommended deployment method and it’s used for new deployments. For information about how to deploy RUEI in the OCI Marketplace, see Deploy an Oracle Real User Experience Insight Instance in the Oracle Cloud Infrastructure (OCI) Marketplace.
To configure RUEI to monitor the desired EBS instance, do the following:
source /etc/ruei.conf
sudo su – $RUEI_USER
execsql config_set_match_http_api “<EBS_suite_name>” apm “<Data_Upload_Endpoint>/20200101/observations/private-span?dataFormat=apm&dataFormatVersion=1&dataKey=<Private_Data_Key>”
From the above statement, replace <EBS_suite_name> with the RUEI application name configured for the monitored EBS application. Also, replace the values of the <Data_Upload_Endpoint> and <Private_Data_Key> with the ones for your APM environment.
To configure RUEI to send span data for only Forms traffic of the monitored EBS instance, do the following:
source /etc/ruei.conf
sudo su – $RUEI_USER
execsql config_set_match_http_api_filter “<EBS_suite_name>” apm EBS_FRAMEWORK == form-based
There are some additional configurations in RUEI and APM Java Agent files recommended to take advantage of E-Business Suite tracing and optimize the data capture and presentation in APM.
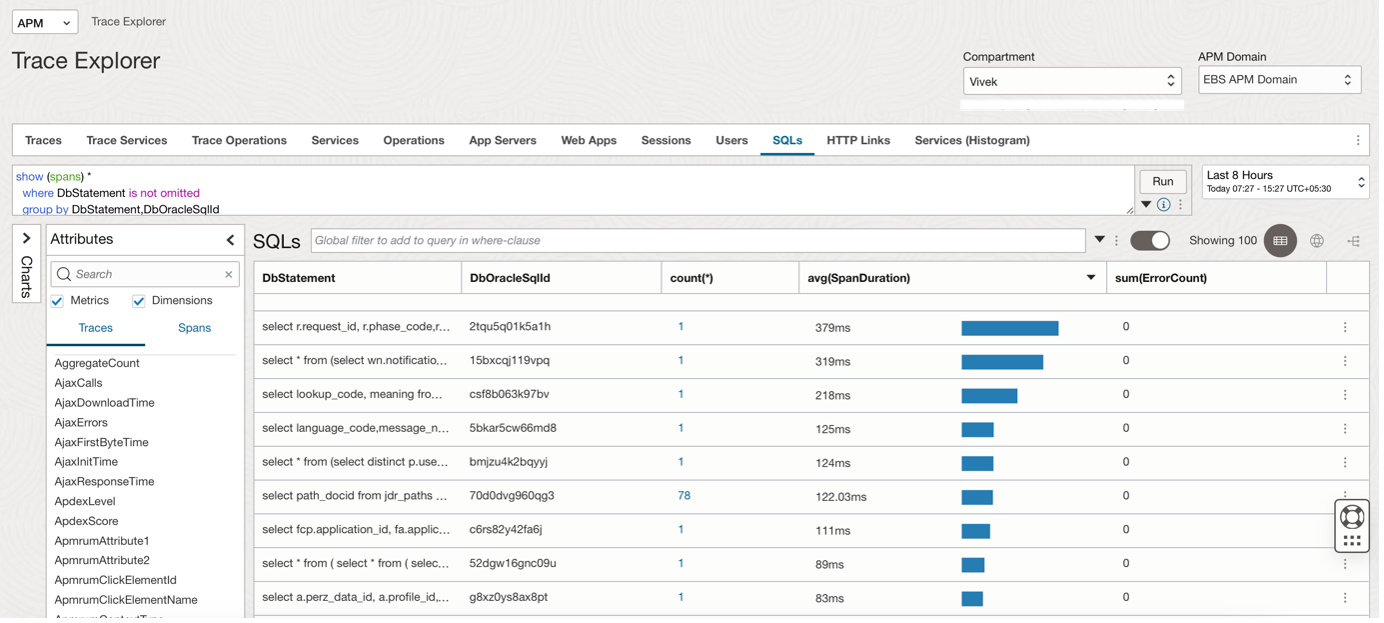
APM Trace Explorer
Use Trace Explorer to view traces and spans and identify performance issues and bottlenecks in your monitored application, from browser to database.
After trace data is uploaded, Trace Explorer enables you to explore traces for diagnostics and ensures visibility into all spans in all traces at all times. It provides the use of a simple query language that enables you to find, sort, and group spans. You can use Trace Explorer to:
- Monitor individual traces, view their details, and analyze large sets of traces and spans to identify trends and anomalies.
- Detect slow traces, traces with errors, and those using a specific server or data source.
- Drill down into specific spans, such as page loads and AJAX calls to isolate and identify issues
Additional Drilldowns can be created to view details of sqls causing performance issues. These drill-downs can be used to launch OCI Database Management Performance Hub and review the problematic SQLs in detail.
Check for the SQLs under the SQLs Tab:
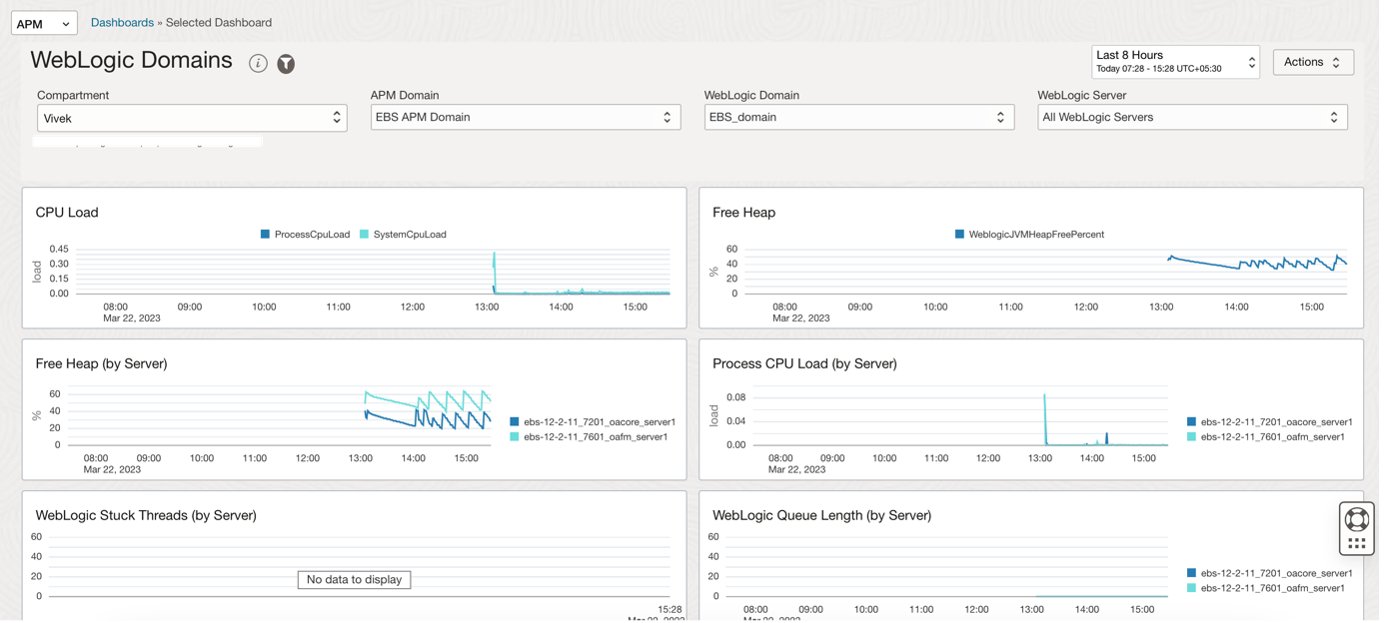
5. APM Dashboards
The Oracle-defined dashboards for Application Performance Monitoring provide insights into the key elements of your application during a selected period.
The WebLogic Domains dashboard provides an overview of the WebLogic metrics and enables you to monitor the performance of administration and managed servers in Oracle WebLogic Server. In this dashboard, select a WebLogic domain and a server that belongs to the domain and monitor the CPU load, free heap percentage, and other metrics.
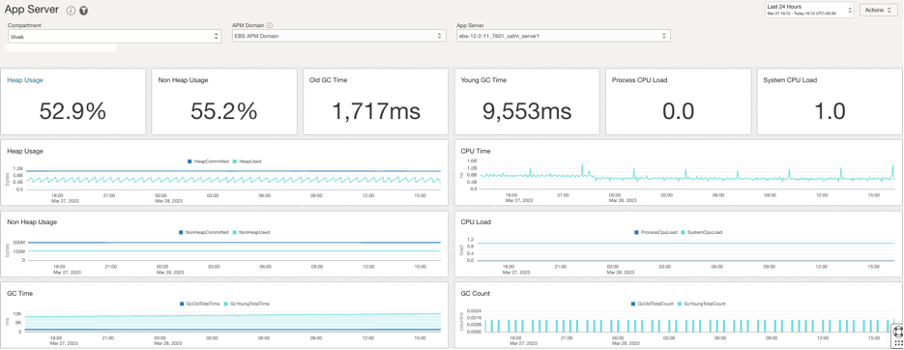
The App Server dashboard is the Home page for your application servers and enables you to analyze the resources used by your application servers and understand resource constraints and requirements. For instance, you can monitor this dashboard to analyze the heap and CPU usage of your application server.
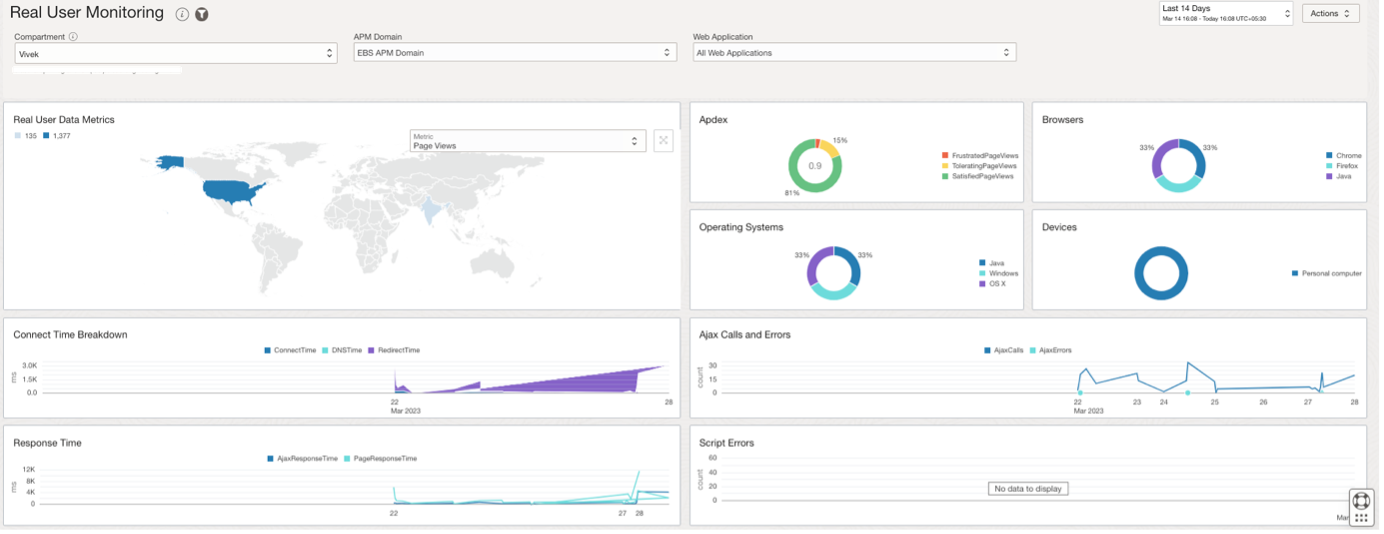
The Real User Monitoring dashboard provides an insight into the performance of your web application and user experience. The Web Application drop-down-list allows you to select a subset of data for which information is displayed in the widgets, such as Apdex, Response Time, and Operating Systems. This enables you to measure the speed and performance of your web application and take corrective action to enhance user experience.
6. Stack Monitoring
Stack Monitoring lets you proactively monitor an application and its underlying application stack, including application servers and databases. It starts by discovering all components of the application, including the application topology. Once discovered, it automatically collects status, load, response, error, and utilization metrics for all application components.
Stack Monitoring supports the following Oracle E-Business Suite (EBS) components installed on OCI Compute and/or on-premises:
- EBS Concurrent Processing
- EBS Concurrent Processing Node
- EBS Forms System
- EBS Workflow Group
- EBS Workflow Agent Listener
- EBS Workflow Background Engine
- EBS Workflow Notification Mailer
To learn more about Application Performance Monitoring capabilities visit:
- Oracle Cloud Observability and Management Platform
- Application Performance Monitoring Technical Content
For more blogs on Oracle APM, visit the Observability and Management – Application Performance Monitoring blog space.