Oracle Enterprise Manager, which is Oracle’s on-premise management solution, offers Oracle WebLogic Server Management Pack Enterprise Edition to discover, monitor and manage your WebLogic deployments, either in the data centers or in the Oracle Cloud.
Discovery
The first step to WebLogic monitoring is to discover the targets. There are multiple ways to do so in Enterprise Manager. You can either use the guided discovery process to add a domain individually, or use command-line interface to discover multiple domains in a single operation, or auto-discover domains across hosts on a repeated scheduled basis.

Monitoring
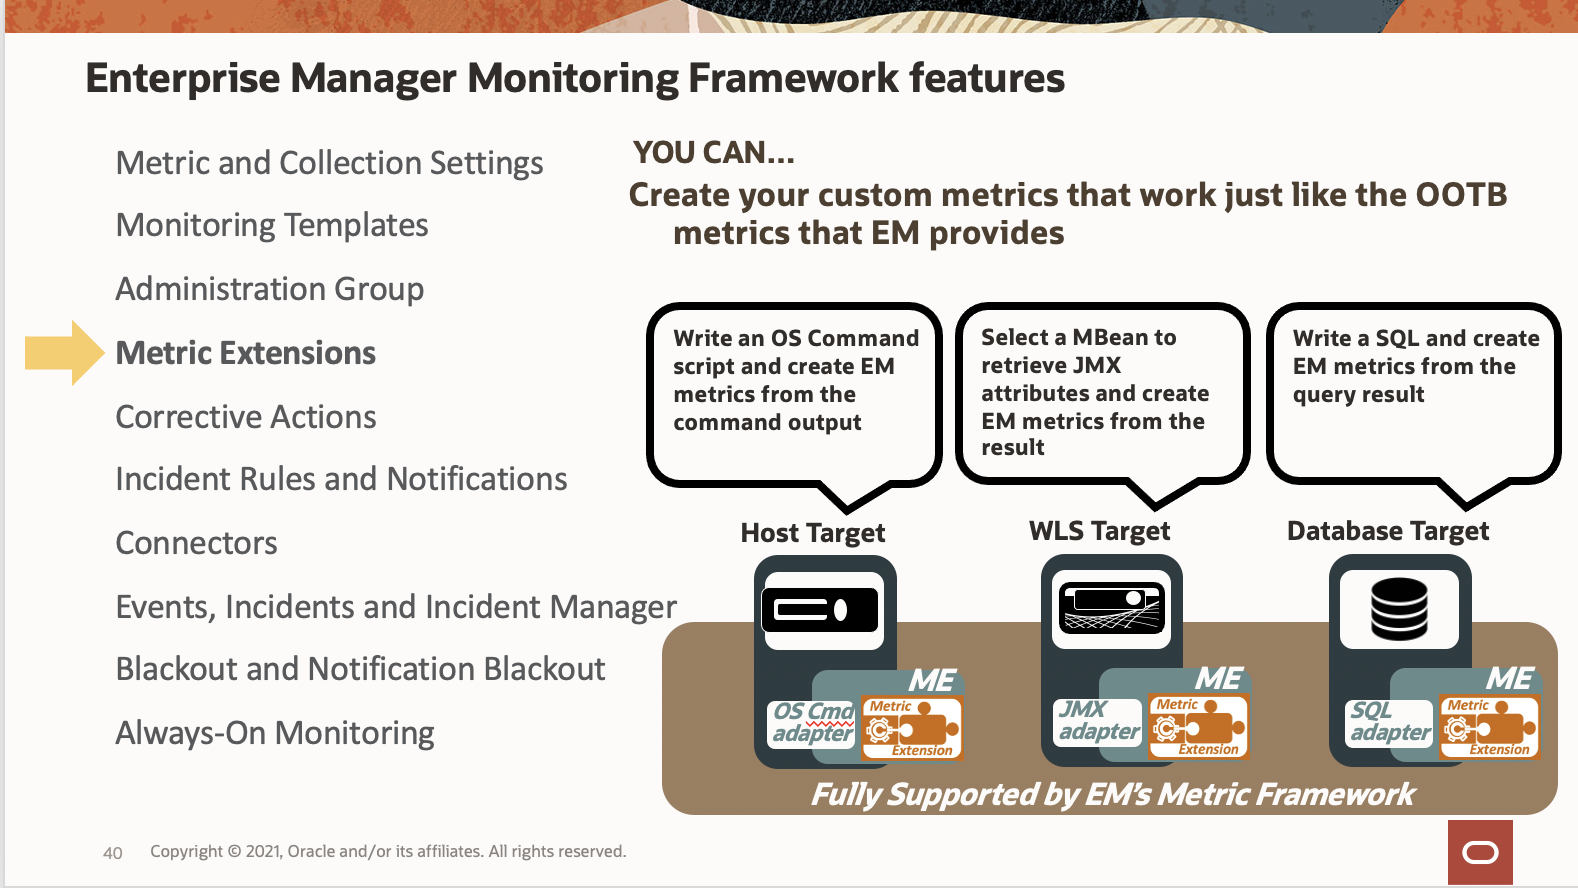
Monitoring in Enterprise Manager starts immediately once the targets are discovered. You can use generic monitoring capabilities, such as out-of-the-box metrics, administration group, metric extensions or incident management. The monitoring features are commonly available to all Enterprise Manager target types, including WebLogic Server and other middleware targets. To learn more about Enterprise Manager monitoring, please see the video Enterprise Manager Monitoring Overview.
Dashboards
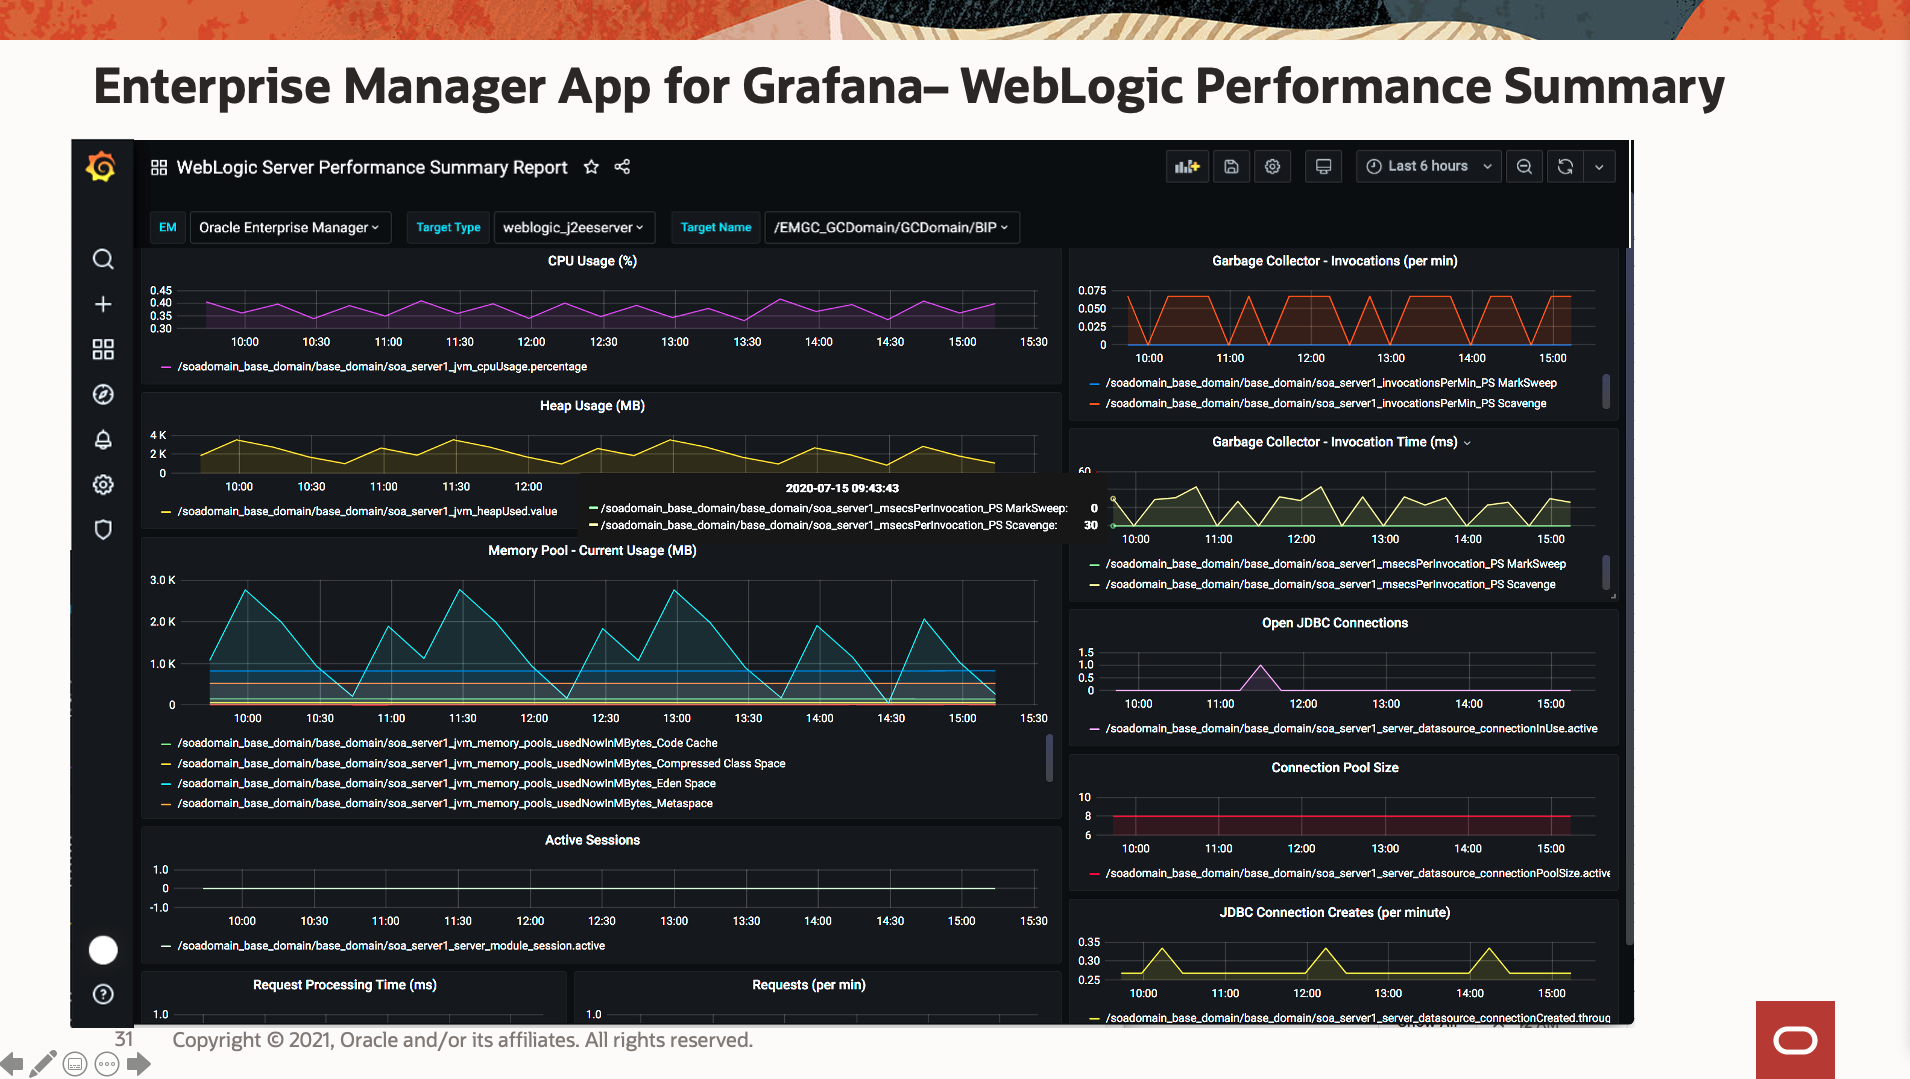
Enterprise Manager offers built-in performance dashboards for WebLogic Server targets. You can add, remove or modify the charts and customize the dashboards in the Enterprise Manager console. In addition, starting with Enterprise Manager 13c Release 4 (13.4.0.7) update 7, out-of-the-box WebLogic performance dashboards are bundled with Enterprise Manager App for Grafana. For more information about the EM App for Grafana, please visit the blog Out-of-the-box WebLogic Performance Dashboards are now available with Oracle Enterprise Manager App for Grafana
End User Monitoring
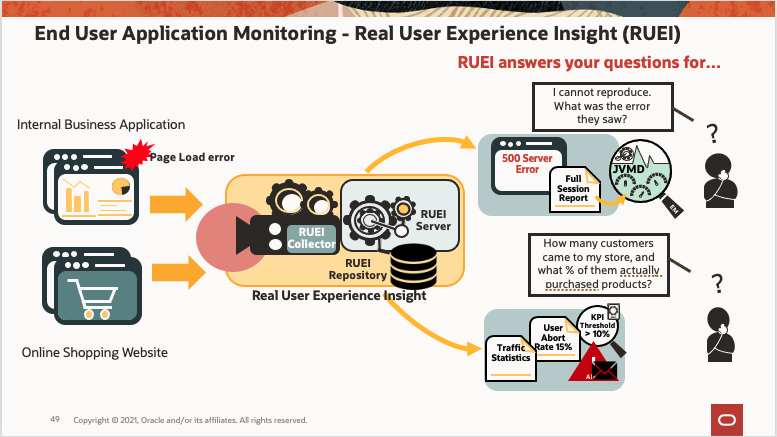
Oracle Real User Experience Insight (RUEI), licensed as a part of Application Management Suite or with standalone RUEI license, completes the WebLogic management solutions in Enterprise Manager. With RUEI, you can monitor application performance or measure end user experience. It captures every web interaction that users have in the application and translates the data into meaningful statistics, which allow you to make effective business and operational decisions. RUEI is now offered as a marketplace app in the Oracle Cloud. To know more about the RUEI app, please see the blog Oracle Real User Experience Insight is now on Oracle Cloud Marketplace.
Diagnostics
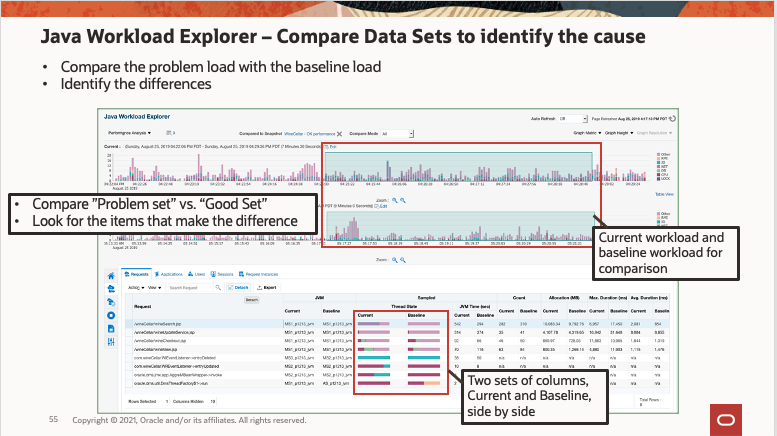
Once performance issues are detected in Java applications, you can use JVM Diagnostics (JVMD) in Enterprise Manager to diagnose the root cause of the problems. Using JVMD, you can drill down to the applications’ Java stack, and perform diagnosis on real-time and historical data. JVMD does not require application instrumentations or re-compiling. You can use JVMD in production, because it is always on and available all the time. It helps you find the problems such as the slowest request or methods, requests waiting for I/O or database calls, or those using a lot of resources.
Configurations and compliance
Enterprise manager collects a vast amount of configuration metrics from the domain, such as the WebLogic server settings, data from configuration files, also the patching history of the targets. You can compare the configurations among the targets to detect the differences to maintain the consistency or against the security standards to ensure the compliance.

Patching and Provisioning
You can use Enterprise Manager to manage the lifecycle of the WebLogic deployments. Enterprise Manager offers automation of the patching process. Once patches are selected, the wizard guides you through the process to apply them in parallel or rolling fashion. You can also provision or clone WebLogic domains to standardize the WebLogic deployment across the datacenter.

To find more on Oracle Enterprise Manager’s WebLogic Server management solutions, please visit Managing Oracle WebLogic Server with Oracle Enterprise Manager. This 48-minute video covers the WebLogic and middleware management offerings in Enterprise Manager.
Topics and duration:
- Introduction (3m 02s)
- WebLogic discovery (1m 47s)
- Middleware summary pages (3m 7s)
- Grafana dashboards (3m 32s)
- Monitoring features (7m 39s)
- Real User Experience Insight (RUEI) (11m 1s)
- JVM Diagnostics (7m 52s)
- WebLogic configuration and compliance management (6m 25s)
- Patching and provisioning (4m 24s)