Blog Contributor – Karl Brown, President, Quzel Consulting
This blog highlights Quzel Consulting’s use of Oracle Enterprise Manager (EM) to monitor the application stack for a large Canadian Public Sector deployment. Karl Brown, President of Quzel Consulting, shares how using EM’s Generic, Aggregate, and Redundancy Systems helps Quzel Consulting to proactively reduce alert noise in their client’s system.
![]()
Describe Quzel Consulting’s business and your role there.
Quzel Consulting provides operational architecture consulting to large customers including assisting in designing and implementing monitoring, security, and high availability solutions, primarily with Oracle products. As an EM architect, my responsibility involves the end-to-end design to manage and monitor operations in EM.
Describe how Quzel set up an EM environment for your client.
We advise our clients to use EM to monitor their applications. For our Canadian Public Sector client, we use EM to monitor ~100 WebLogic Domains, ~300 Tomcat servers, ~20 Siebel Enterprises, and 1000’s of other custom applications. When initially setting up their EM environment, our goal was to establish a consistent approach that allows for easy organization of their applications where health can quickly be assessed.
We utilized the Oracle White Paper Strategies for Scalable, Smarter Monitoring using Oracle Enterprise Manager Cloud Control 13c.. Using strategies from the white paper, we designed an Administration Group hierarchy to group our client’s applications and meet their business needs. The hierarchy consists of the following four levels: Line of Business, Lifecycle Status, Location, and Department.
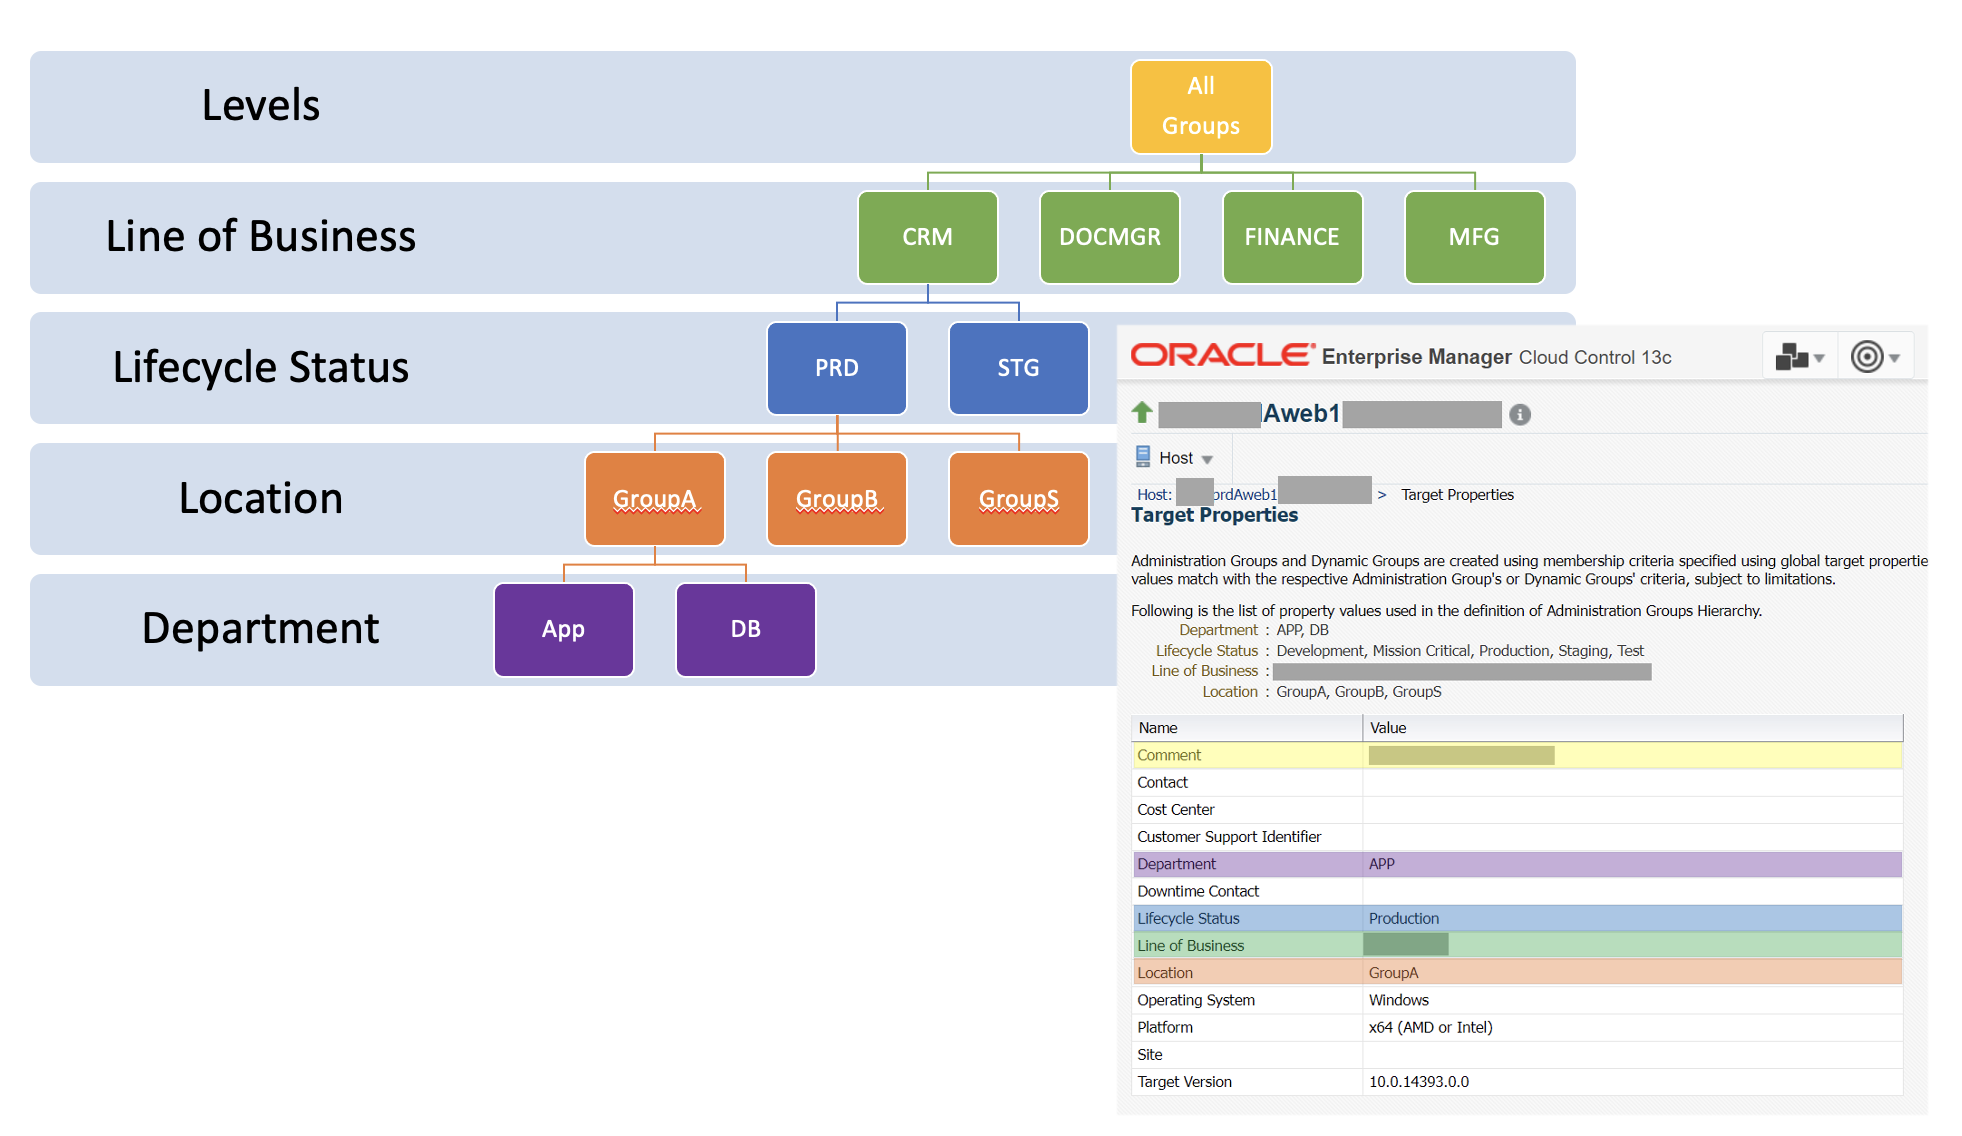
In our client’s environment, they have two complete copies of production that they alternate between, either as part of a major release or during a regular patching cycle. Each production target was designated either Group A or Group B by setting the Location value of the target to either “Group A” or “Group B”, so it joins the appropriate administration group. For targets that were common to both sides, such as a main URL, we designated them to belong to Group S. At any point in time, only one group will be “active”, and the other group will be “inactive”. A notification blackout was enabled for “inactive” targets so that alerting was continued but alert notifications were suspended.
What EM features were leveraged to monitor your client’s environment?
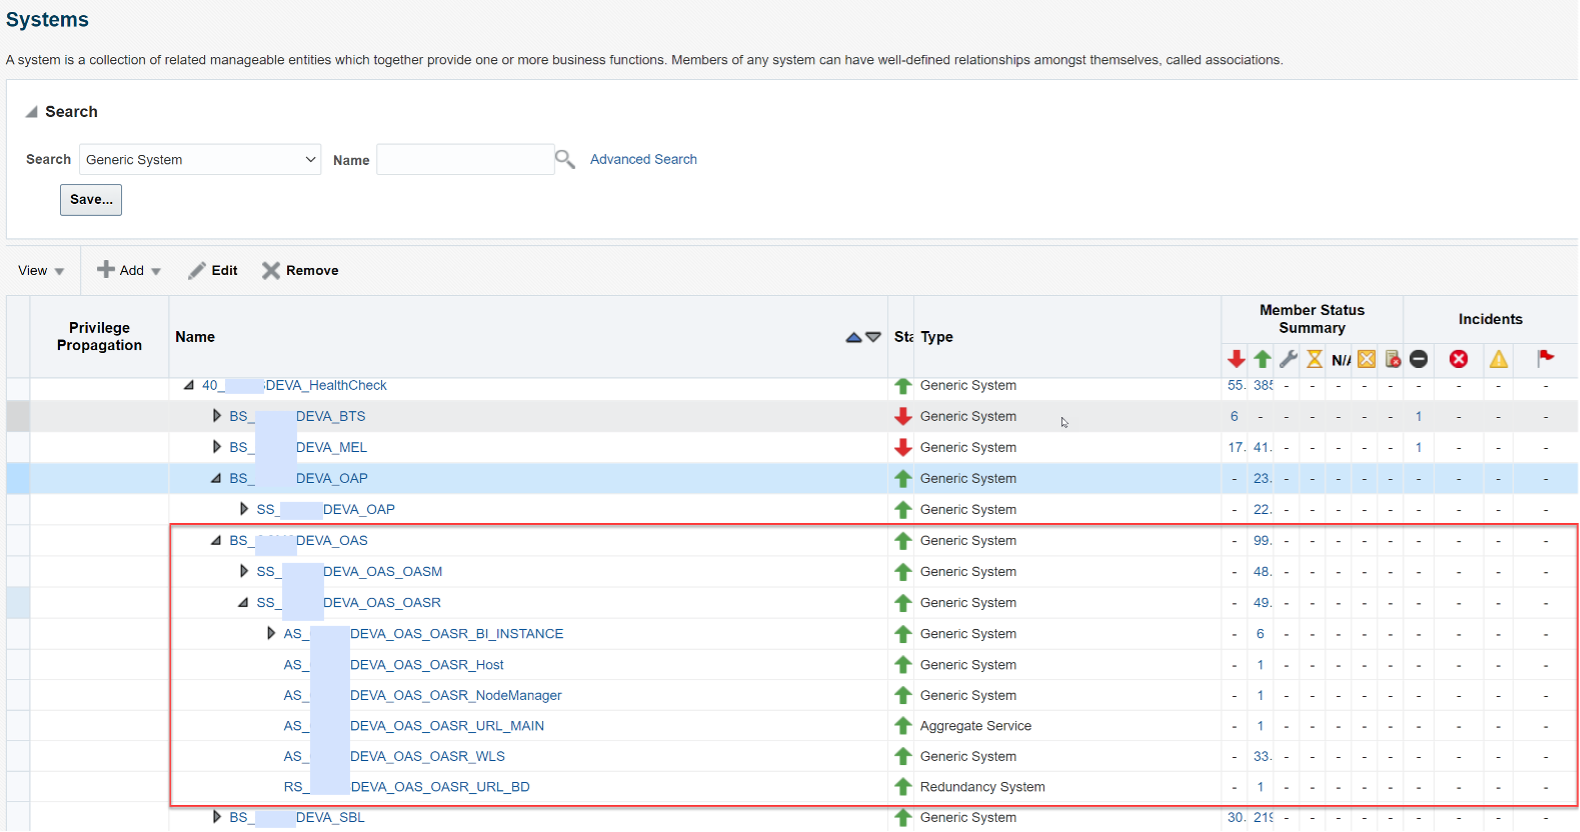
We had a lot of alert noise for monitored environments that were not necessarily critical to our client’s business. After reviewing Oracle documentation, we found that Redundancy Systems and Generic Systems could assist with the solution. The Redundancy System feature allowed us to only be alerted if X number of targets in a group are down which helped to reduce our alert noise. One of the powerful features found was the ability to create a hierarchy of Generic Systems. The Generic Systems hierarchies was modeled after the administration group hierarchy. To prioritize production environments over development environments, each of the parent Generic Systems were prefixed with a number in order of priority.
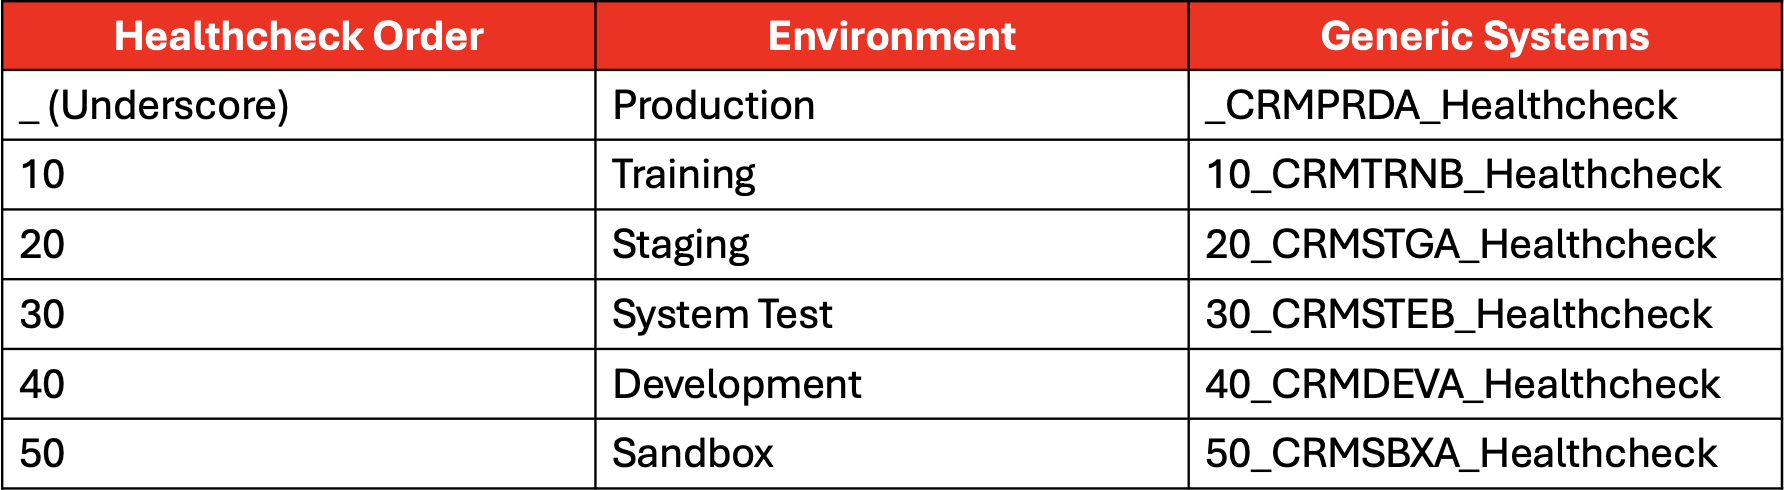
Note: The environment names shown above are internal but map to Lifecycle Status for the administration group hierarchy.
The following naming convention for different types of systems was developed:
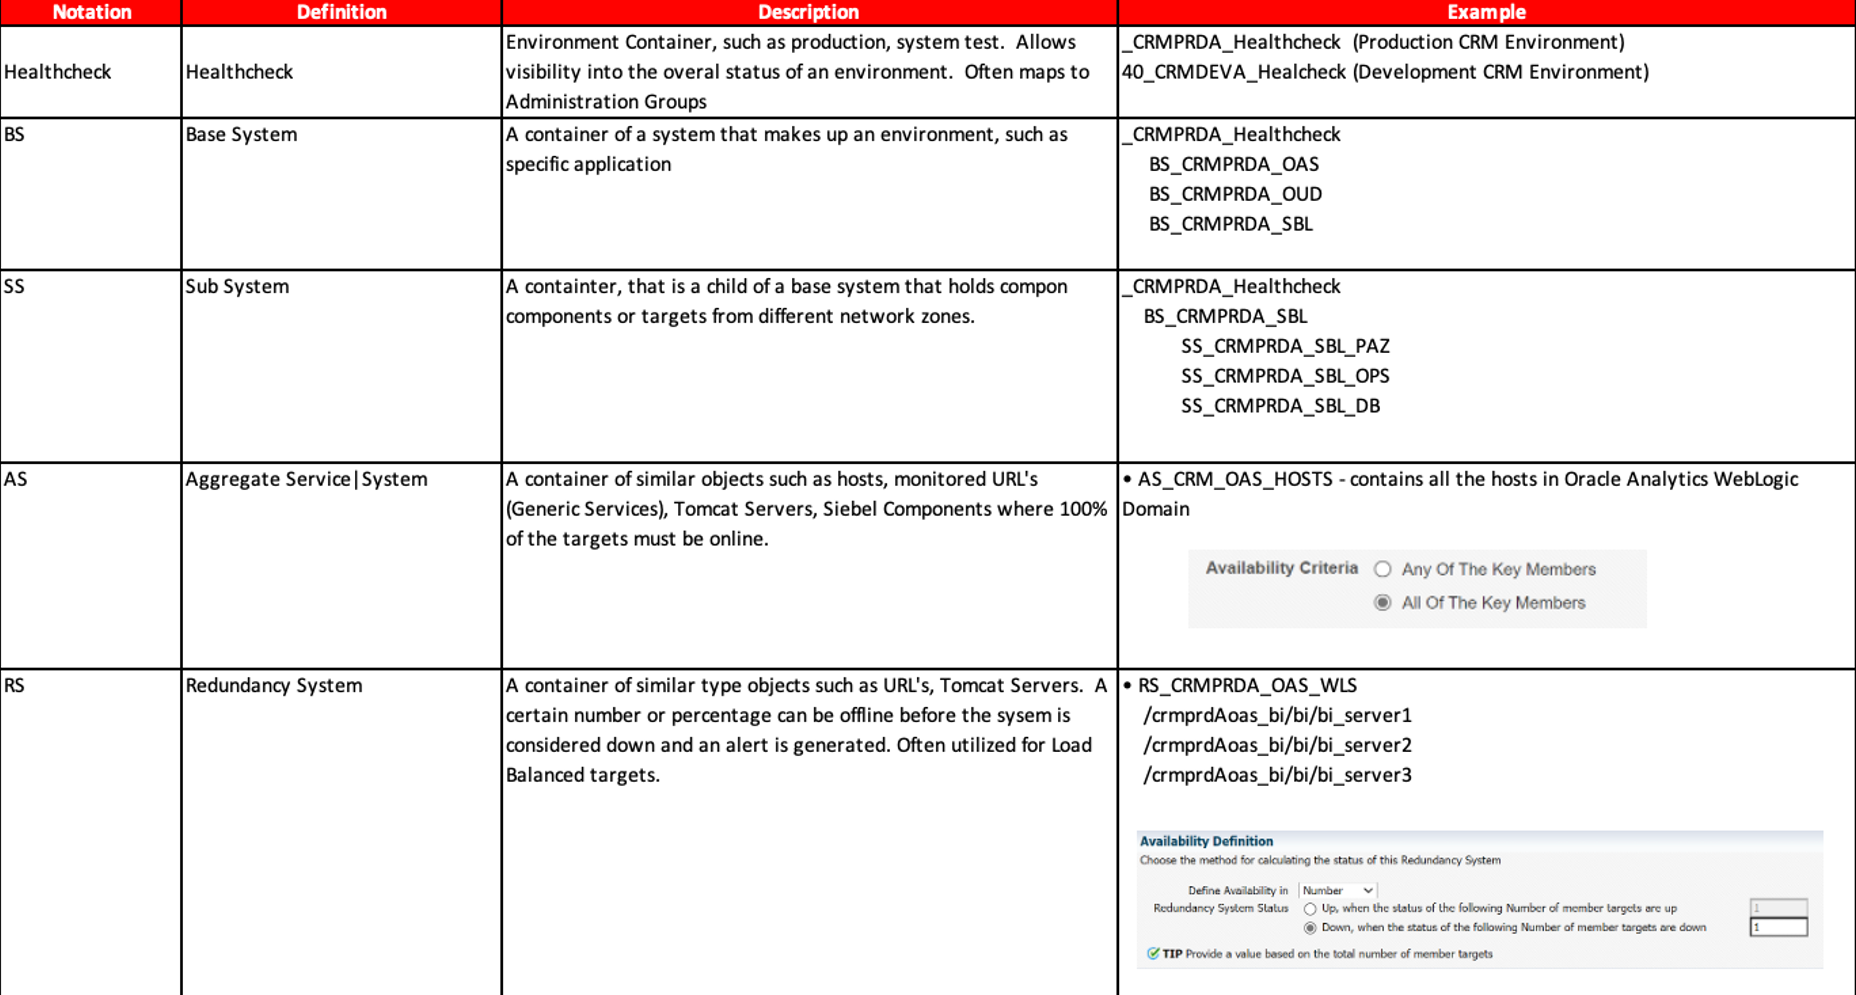
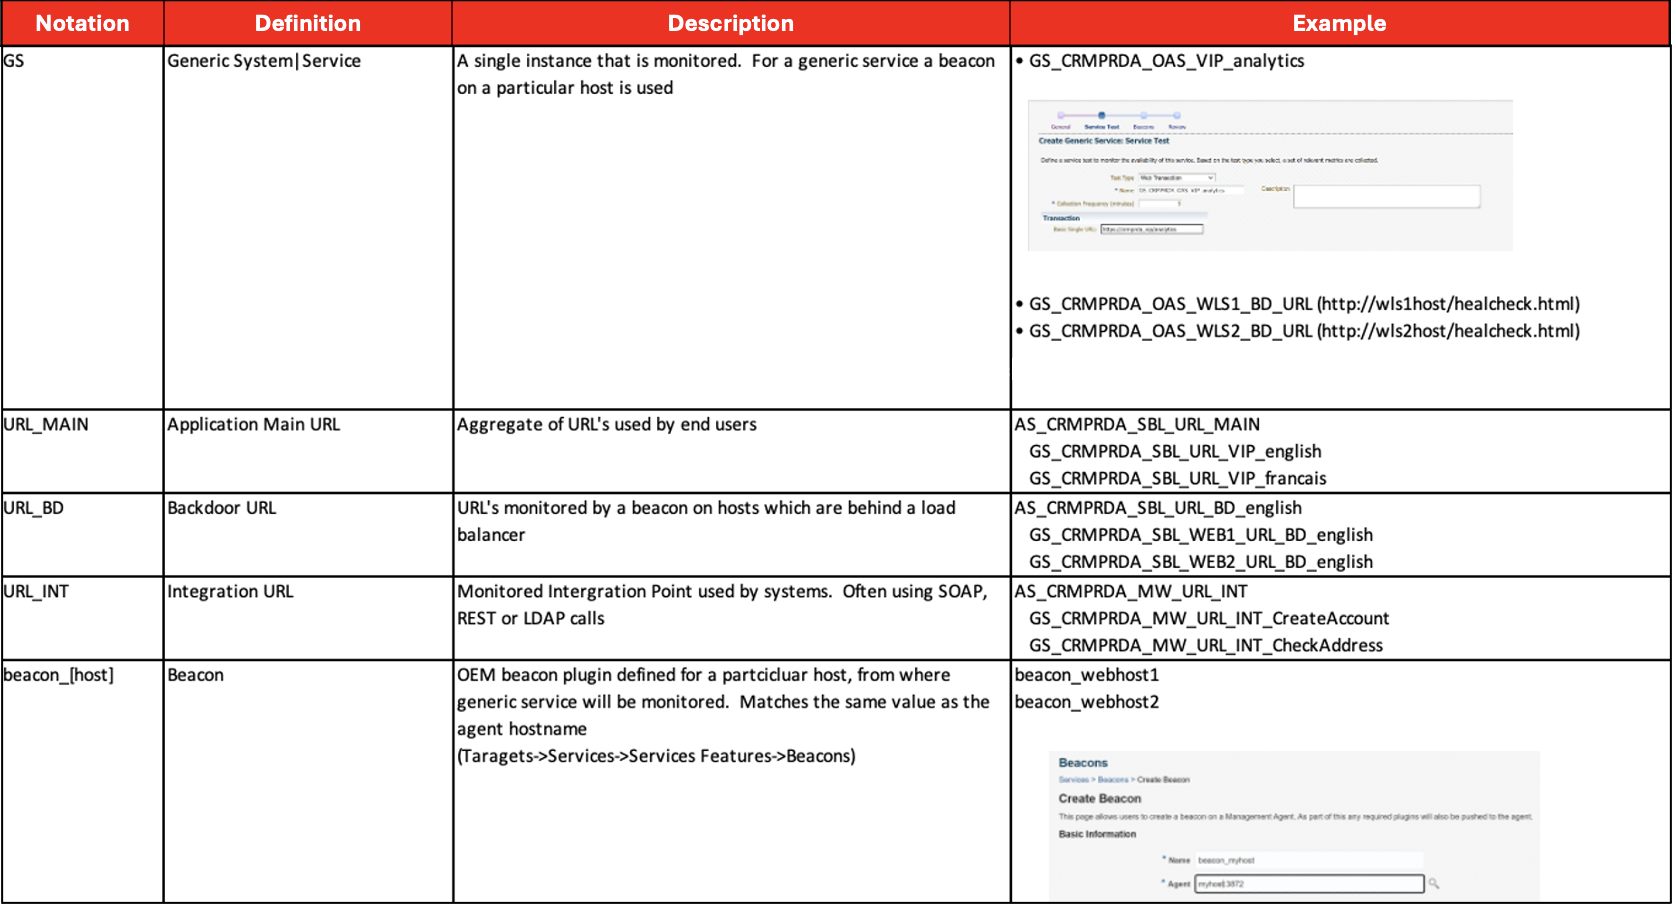
One of the key fundamentals of monitoring is to be able to validate the status of critical endpoints. To accomplish this goal, we have been extensively leveraging Beacons and Generic Services. Beacons are an agent plugin that allow the monitoring of targets from the point of the view of each monitored host. With the adoption of zero trust security in many environments, using beacons to minimize the need to open additional firewall ports just for monitoring can be an added benefit that reduces the exposed footprint.
Generic Services, can perform over a dozen different types of endpoint monitoring, including basic port monitoring to more complex REST/SOAP calls. Each Generic Service is associated with one or more beacons. A beacon was put on every host where we deploy an agent. When creating beacons, the name was prefixed with “beacon”. For example, “beacon_[hostname]”.
Note: Currently beacons must be created from within the user interface, however we are working with the Oracle team to allow beacon creation through the Enterprise Manager Command Line Interface, EMCLI.
For common URL’s, such as those which end users access, we leverage the agents on the Oracle Management Service (OMS) servers for monitoring these endpoints. If there are a significant number of services being monitored by a beacon or agent, some performance tuning may be required. See the following document for further details: “EM 13c: Agent Tuning Parameters when the Agent is Monitoring Several Targets (Doc ID 2449197.1)”.
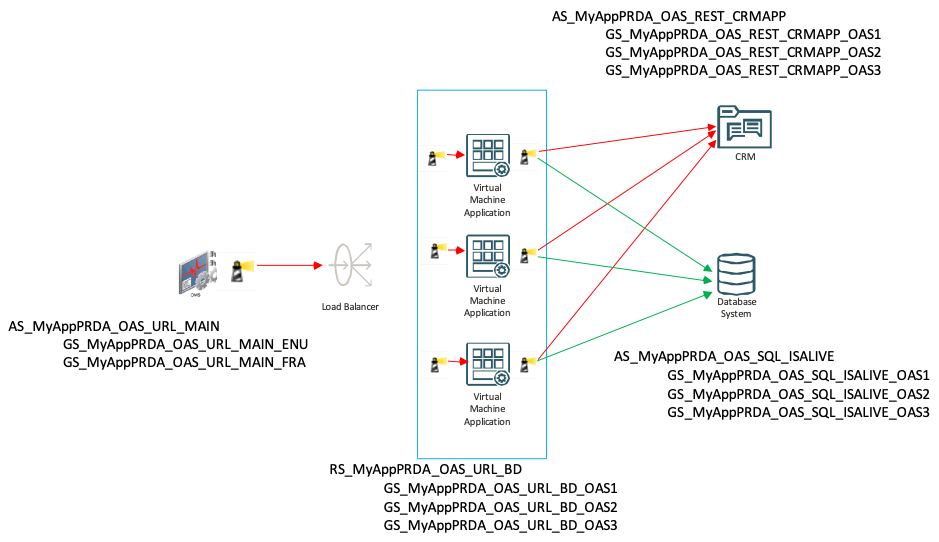
The above diagram displays an example of how we leverage all the previously mentioned monitoring features in our client’s environment. In their environment, various Aggregate Systems (a Generic System where target availability is set to All – i.e. 100% of targets must be online) and Redundancy Systems are set up. Once the structure is customized, it makes it easy for us to quickly identify issues and drill down the potential culprit. Refer to the key for a breakdown of the different components in the architecture displayed above and how they are monitored.
| System |
Description |
| AS_MyAppPRDA_OAS_URL_MAIN |
Monitor the main URLs of the application from the beacon on OMS server(s). 100% of the targets should be online. |
| RS_MyAppPRDA_OAS_URL_BD |
Each member target of the Redundancy System would be configured with the corresponding beacon on each of the hosts, checking the local URL behind the load balancer. The Redundancy System could be configured to only alert if 2 of the 3 targets are offline. |
| AS_MyAppPRDA_OAS_REST_CRMAPP |
Monitor from each of the targets an outbound REST call that is made to third party application. The flow should work 100% of the time from each of the virtual machine application servers. |
| AS_MyAppPRDA_OAS_SQL_ISALIVE |
Monitor connectivity from each virtual machine application server to the database by running a SQL script to login every X minutes. |
How are notifications sent on the issues detected?
Incident Rules are set up in EM to send notifications based on our issues to respective support recipients. Once the hierarchies for the systems were set up, we followed a similar structure and naming convention in our incident rules. Incident rules were based upon the parent generic system, which is part of our administration group hierarchy.
Prior to creating an incident rule set, a static group was created that had additional targets to be notified on. Next, we created a new incident rule set. The rule set contained the newly created static group and the generic system.
Following the naming convention of the systems, an example of the incident rule set would be the following: MyApp-PRD-GroupA which reflects the administration group name containing the Generic System.
The following shows examples of how the incident rules were defined in the rule set:
Rule #1 - MyApp_PRDA_Host_Tomcat_Weblogic:
Applies to:
- Target Type = Host, Tomcat, Weblogic
- Severity in (Clear; Warning; Critical)
- Category (Availability, Capacity)
Action Summary
- Severity is Critical → Send email to pager.
- Severity is Warning → Send email to support group.
- Severity is Clear → Send email to support group.
Rule #2 - MyApp_PRDA_System:
Applies to:
- Target Type = Aggregate Service; Redundancy System; Generic System
- Severity in (Clear; Critical; Fatal)
- Category in (Availability; Capacity)
Action Summary
- Severity is (Critical; Fatal)
- Send email to pager.
- Update incidents.
- Severity is Clear
- Send email to support group.
- Set Incident status to resolved.
Each rule applies to a subset of targets and depending on the severity (e.g., clear, earning, critical, or fatal) separate actions are taken. For instance, when there is a critical or fatal incident for system targets, then the rule sends emails on the incident to the respective support group/pager and updates the incident.
Describe how the naming convention is maintained for the targets in EM.
To keep the naming convention consistent between environments, a simple configuration management database with a simple Microsoft Excel front end was established where we stored the above structure. To automate this process, we use Enterprise Manager Command Line Interface (EMCLI) scripts to quickly create all the targets and related systems.
What advice do you have for others interested in monitoring their application tier?
For us one of the key points would be organization. We maintain all our endpoints in a database to allow us to quickly scale up environments while maintaining a consistent naming convention. We take the output from the database and leverage EMCLI scripts to automate the endpoint creation in EM. For our hosts, we have been using DNS Aliases with descriptive names as opposed to generic host names which allows for easier categorization of targets. We also recommend leveraging Beacons and Generic Services in EM as much as possible as they provide great insight into the state of a system.
What is Quzel Consulting doing next to build upon its current monitoring setup?
Here are key ways we plan to expand our current EM monitoring setup for our client:
- Working with the Oracle team to add an enhancement to allow events to be compressed into a single incident based on a parent Generic System
- Improving the use of EM Dashboards to visually represent our architecture
- Improving our security configuration for both EM and targets
- Onboarding additional business teams for our client in order to manage and monitor their targets in EM
Resources
For more information, see the following Enterprise Manager documentation:
- Administration Groups
- Introduction to Generic and Redundancy Services
- Deploying and Using Beacons
- Incident Rules
- Enterprise Manager Monitoring Guide
- Enterprise Manager Command Line Interface (EMCLI)