Managing the performance and capacity of Exadata Cloud@Customer (ExaDB-C@C) deployments can be complex, but with new cloud-native (OCI Management Agent) support for managing databases from OCI Ops Insights (OPSI), monitoring and optimizing your databases has become much easier. The general availability of this support enables you to onboard ExaDB-C@C deployments and databases in addition to the Enterprise Manager supported model.
By combining ML-enriched out-of-the-box insights, dashboards and applications, OPSI decreases the time in performing capacity planning exercises and aids in improving the performance of mission-critical databases in multi-cloud environments.
Here is what you need to know about this new enhancement.
Feature Summary and Benefits
- Comprehensive Resource Analysis:
- Analyze resource usage of Exadata systems, databases, and hosts across the enterprise.
- Forecast resource demands based on historical trends.
- SQL Performance Insights:
- Compare SQL performance across multiple databases and identify common patterns.
- Identify performance trends across enterprise-wide databases.
- Utilize Data Objects to author custom SQL queries and explore database. performance using dashboard framework
- Database performance analytics:
- Analyze AWR statistics for database performance, diagnostics, and tuning across a fleet of databases.
- Analyze and act on ADDM Spotlight’s strategic advice on database performance improvements.
- Reporting:
- Generate weekly reports summarizing utilization changes and inventory updates.
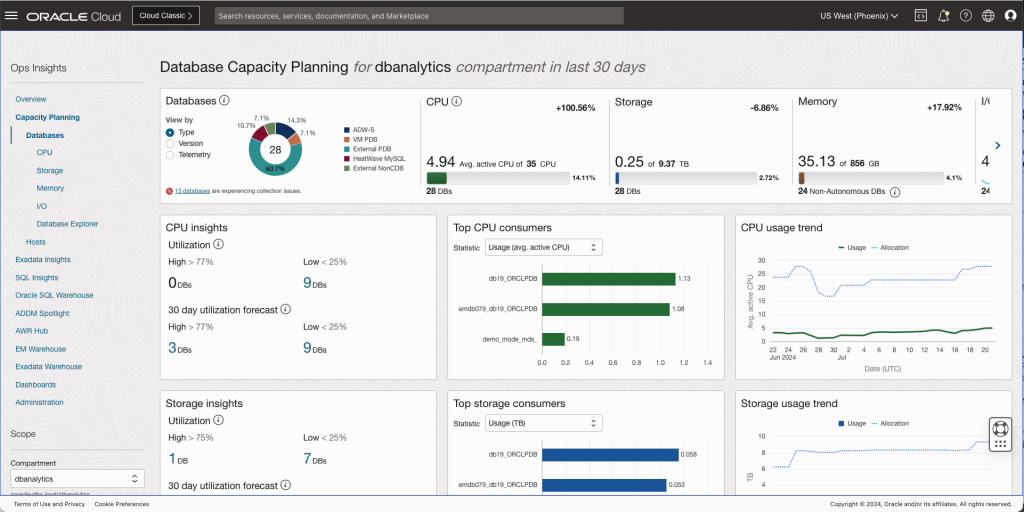
Capacity planning at scale
OPSI provides seamless capacity planning for:
- Oracle Cloud Databases on bare metal, VMs, and Exadata Database Services on Dedicated Infrastructure and Exadata Cloud at Customer
- HeatWave MySQL, Autonomous Databases and Oracle Databases deployed on-premises
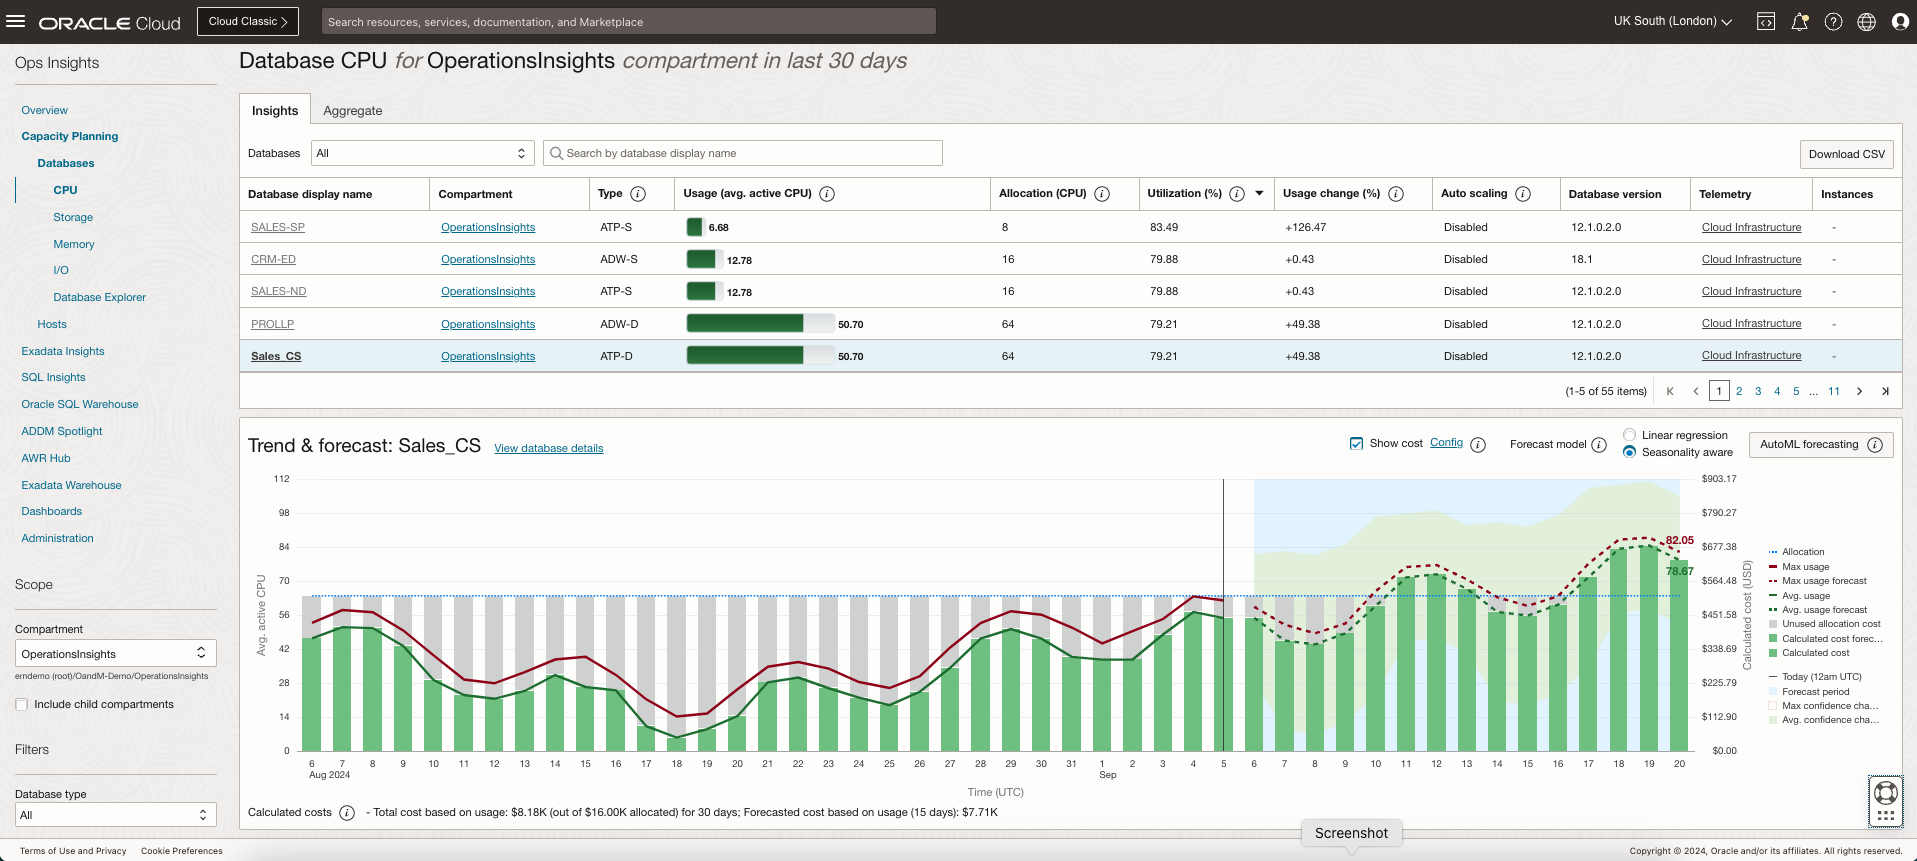
This new capability empowers database fleet administrators or capacity planners to effectively manage CPU, memory, storage, and I/O resources across the entire database fleet. Additionally, capacity planning includes the following features to help manage your databases:
- Browse Insights and Aggregate tabs at the CPU, Storage, Memory and I/O levels to right-size your database fleets
- Trend and forecast resource demand using up to 25 months historical data with treemap visualization of the entire fleet
- AutoML-based forecasting algorithms to forecast future consumption of underlying resources
- Utilization thresholds alarms to proactively inform of resource shortfalls for timely corrective action
- Growth pattern visualizations over time, entire fleet, and each member to quickly isolate the largest, most utilized, and fastest growing databases
- View of under-utilized, over-allocated and unused capacity for right sizing
Triaging database performance issues with SQL Insights Fleet analysis dashboard
SQL Insights proactively finds problem SQL and identifies tuning opportunities in large database deployments. The SQL Insights user experience is delivered as three interrelated dashboards that present pre-computed “insights” into fleet-wide SQL performance data. These dashboards help quickly identify the performance impact of SQL execution plan changes, cursor-sharing issues, and new SQL introduced in applications. The data visualized in dashboards further enables exploration and verification of the insights.
Use cases
- Identify databases in the fleet in need of workload optimization
- Top databases by insights
- Fleet-wide workload decomposition by command type
- Aggregate SQL anomalies and characterize SQL workloads at the database level
- Widespread cursor invalidation events
- Workload decomposition by command type, module, and PL/SQL
- Cumulative impact of plan changes and cursor-sharing issues
- Identify individual SQL performance anomalies across the database fleet
- Plan changes affecting average latency
- Cursor-sharing issues
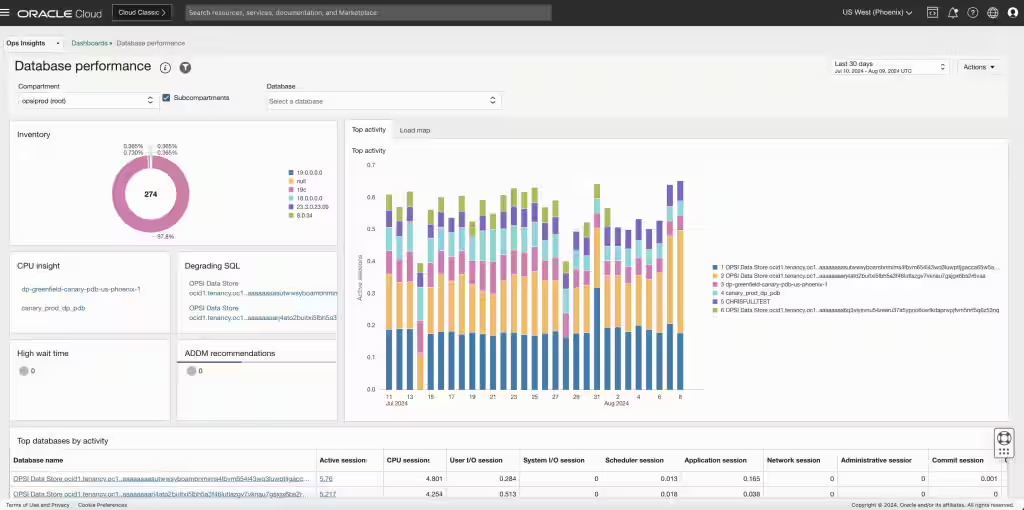
Analyzing database performance made easy with new Database Performance Dashboard
Gain insight into your fleet’s database performance with the new Database Performance dashboard featuring a comprehensive fleet-level view.
Use cases
- Track the overall workload and identify top-performing databases by load.
- Pinpoint actionable optimization areas with Time Model, Wait Class, and ADDM Data customized insights.
- Dive deeper into specific databases with granular information on top activities and ADDM recommendations to make better informed decisions.
Get started!
Find OPSI under the Observability and Management menu in the Oracle Cloud Console. The service is accessible through the Console, CLI, and REST API. OPSI is available to use with HeatWave MySQL, Autonomous Databases, external databases (Oracle Databases deployed on-premises), and Oracle Cloud Databases on bare metal, VMs, and Exadata Database Services on Dedicated Infrastructure and Exadata Cloud at Customer. Support for on-premises MySQL Databases is coming soon.
To test drive this feature and many other features in OPSI before even signing up for the service, try the demo mode using your tenancy or by signing up for Livelabs. Not yet a customer? Sign up for an Oracle Cloud Infrastructure trial account!
Resources
- Oracle Cloud Observability and Management Platform
- Explore Ops Insights
- Hands-on lab: Get Started with Oracle Cloud Infrastructure Ops Insights
- Ops Insights Videos
- Ops Insights Technical Content
For more blogs on OPSI, visit the Observability and Management – OPSI blog space.
OPSI customers can now use the newly launched OCI Generative AI powered Oracle Support Digital Assistant. The Digital Assistant eliminates the need to manually search through the O&M documentation, and provides with quick, accurate answers directly within the OCI console interface. In addition to the answering the query, it also provides references and links to exact sections of our comprehensive product documentation. Learn more about it here.
