Blog Contributor: Luigi Saetta
Developing Retrieval-Augmented Generation (RAG) solutions based on Generative AI involves integration of several Oracle Cloud Infrastructure (OCI) services, such as OCI Generative AI Embedding, Chat Models, and Oracle Cloud Database.
For the highest quality of the generated content, it is essential to verify and analyze the input given to the large language model (LLM), the output at each step, as well as to understand factors contributing to the overall response time.
OCI Application Performance Monitoring RAG Architecture Performance
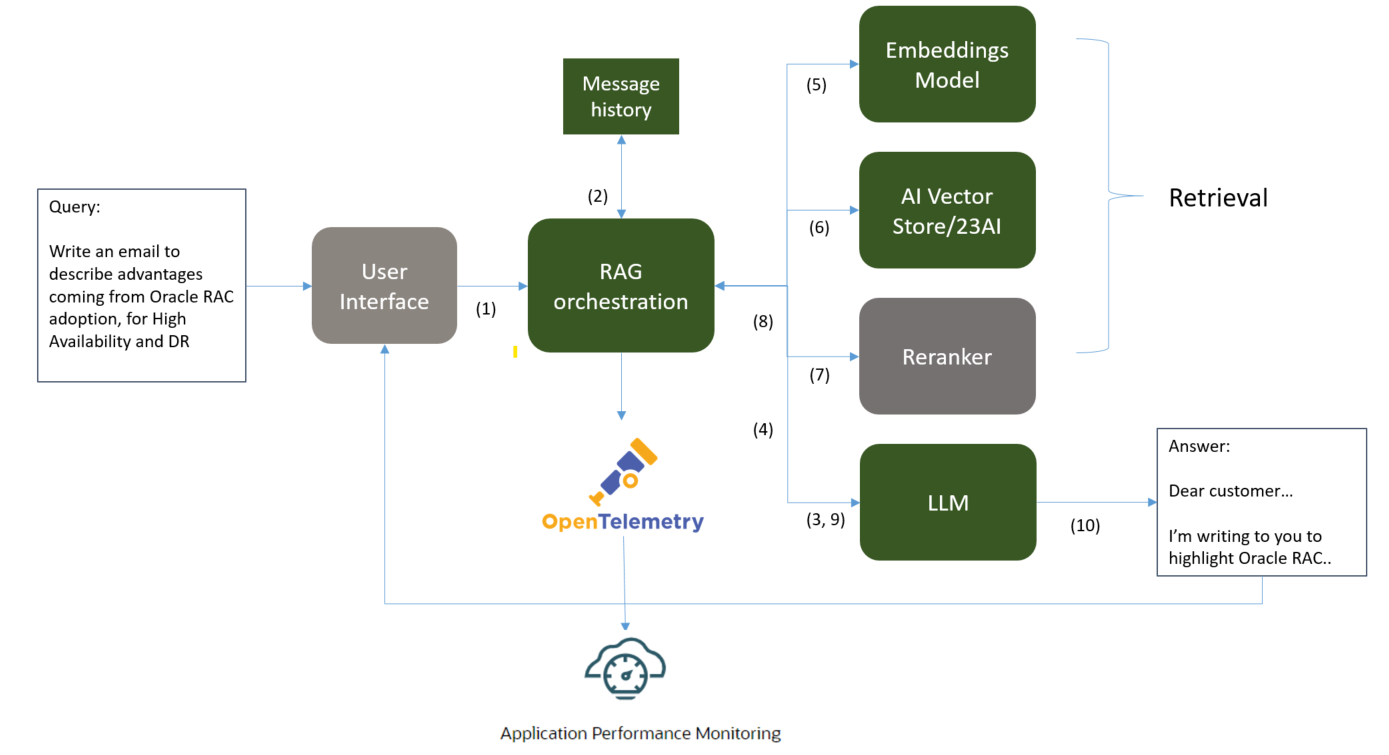
OCI Application Performance Monitoring (APM) monitors a typical architecture of a RAG application and collects and analyzes OpenTelemetry traces produced by the RAG solution to:
- Obtain a performance dashboard that aids with development of RAG solutions
- Analyze trace details to understand where a majority of the processing time is being spent.
- Detect anomalies and notify on errors in the production environment.
For this project, we used Zipkin to instrument RAG Python code with OpenTelemetry traces and spans. The project details are available here. Once instrumented, the RAG chain starts sending span and trace data to an APM endpoint.
Enriching RAG Solutions OpenTelemetry Traces
Next, we enriched the OpenTelemetry spans with additional attributes which can be applied or disabled depending on the desired privacy level:
- conv_id: Conversation ID of the session. This uniquely identify the conversation between the user and the RAG solution, with associated chat history
- genai-chat-input: Query provided by the GenAI user
- genai-chat-output: Output provided by the model
Generative AI Query Flow
Now, let’s simulate a normal conversation flow with the GenAI system. As displayed in Figure 2, the system adds context to the query based on the conversation ID and the same conversation ID may have several queries.
Let’s see how this appears in OCI APM. Remember to mask the query input based on your specific privacy requirements, if needed.
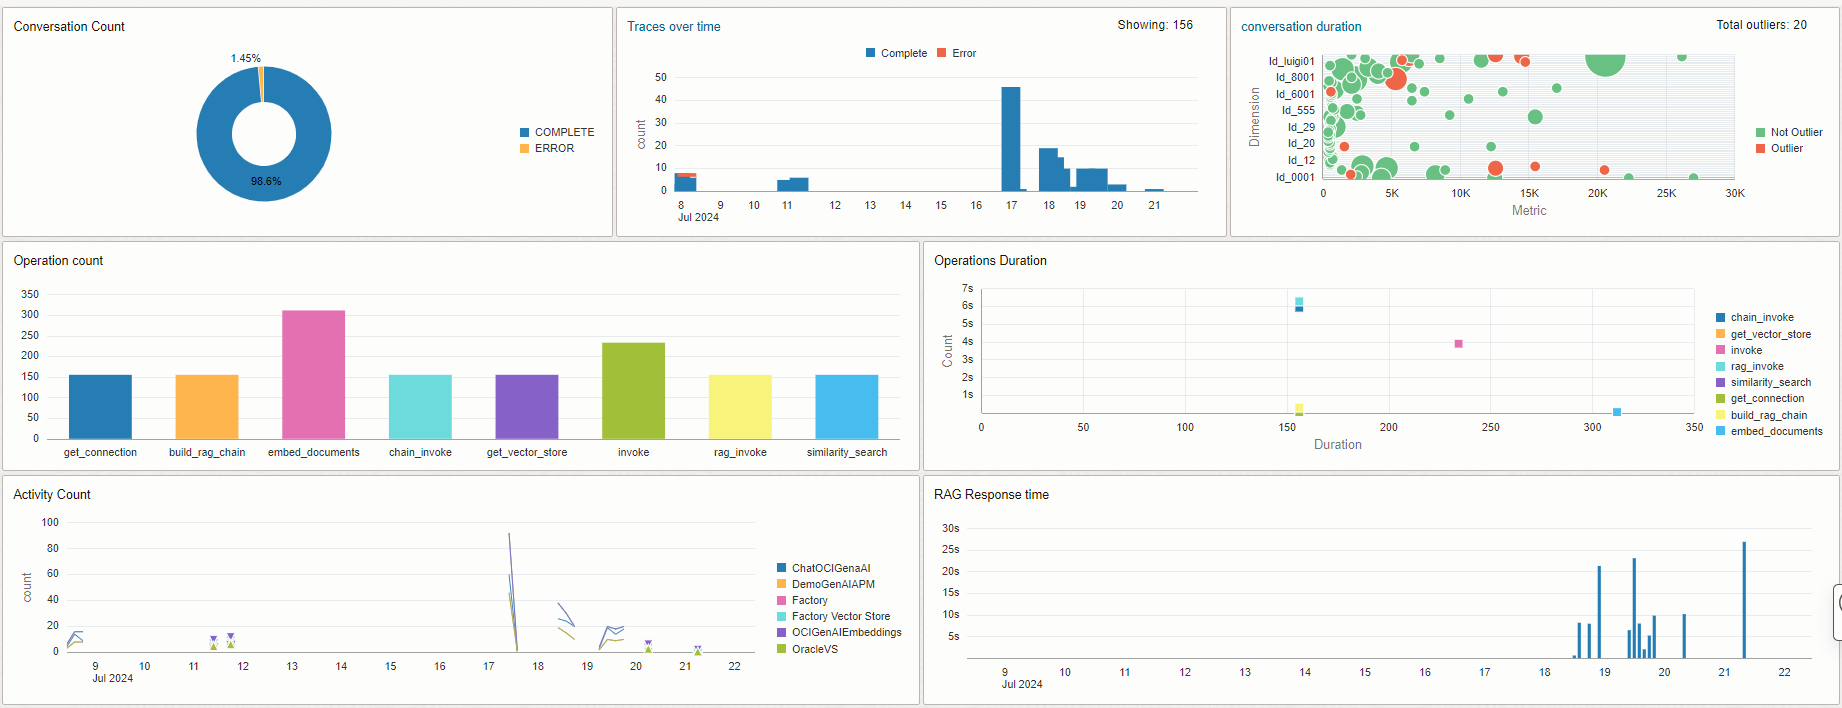
General Activity Overview, provides an overview of the RAG workload, utilization of components and response time correlation which makes it easier to check if system workload is impacting the response time or the availability of the system. In the General Activity Overview there are several widgets:
- Conversation count displays the percent of completed and failed conversations during a specific time period
- Trace over time shows the number of queries answered over the specific time period
- Conversation duration highlights the query in a conversation that took more time to process than usual
- Operation count is the workload for each RAG method
- Operation duration is the method response time vs. the workload
- Activity count is the method workload over the specific time period
- RAG response time is total conversation duration over the specific time period
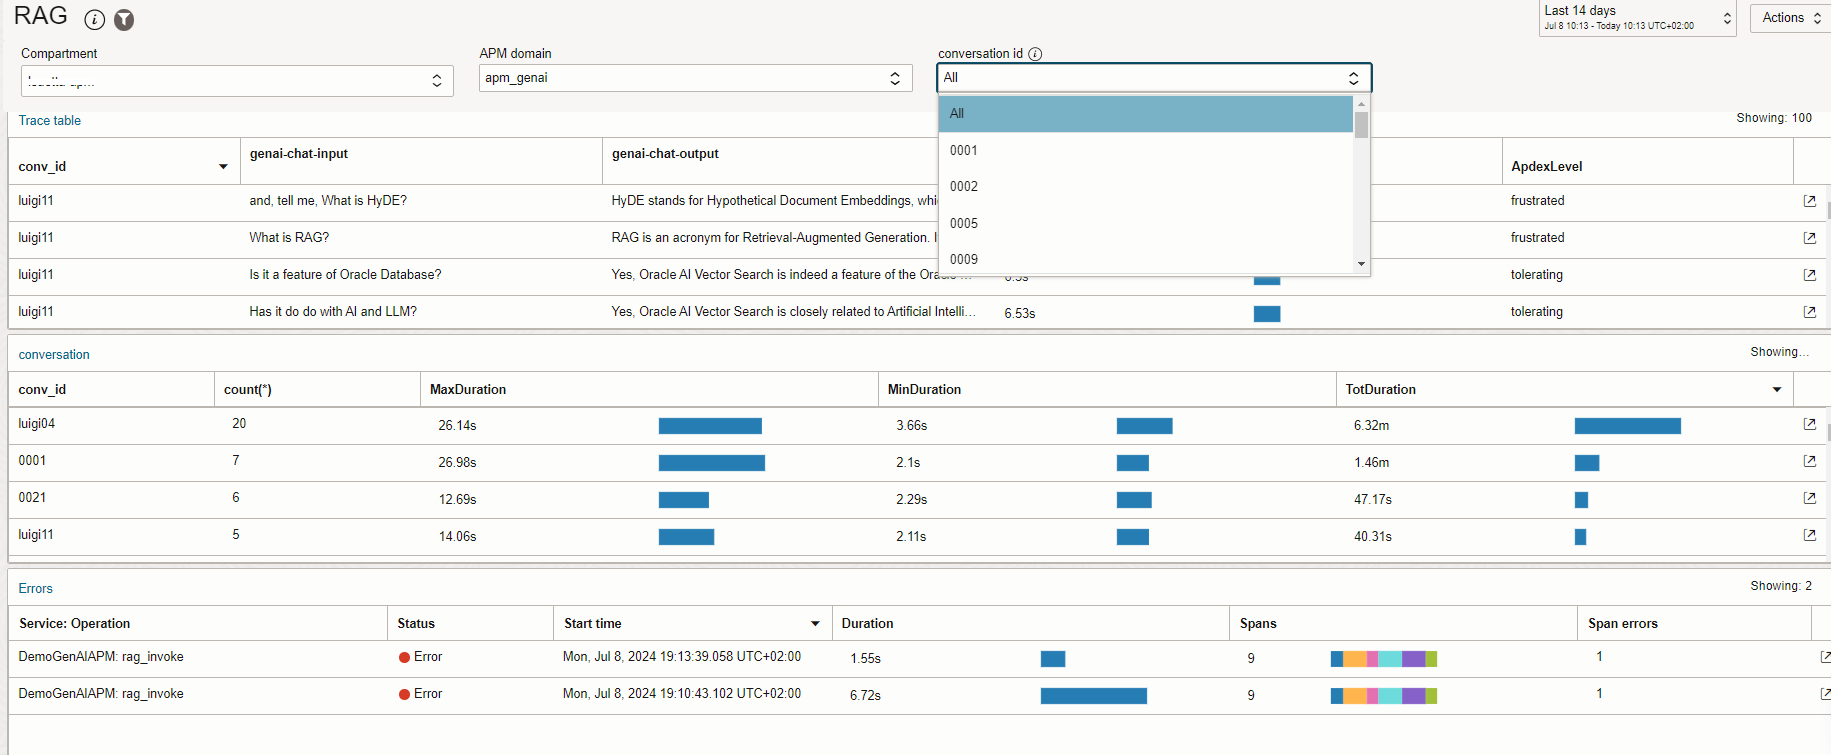
The Conversation Activity dashboard enables you to view all the conversation flow and check the quality of the answer based on the context of the session. It is especially useful for development debugging and it can be disabled on production system for privacy reasons.
On the Conversation Activity dashboard there are three widgets to filter on the conversation id attribute:
- Trace Table displays all the user query input, the RAG output, response time and ApdexLevel. You can set the Apdex score thresholds based on your expectation for the RAG solution.
- Conversation shows you the total duration for the same conversation id. Use filters to filter a specific conversation id.
- Errors table shows you any traces that ended up in an error or any queries not answered.
For each user interaction, drill down from the component diagram to identify the error or the root cause of poor performance or a bottleneck.
To try out this dashboard for APM, download it here.
OCI APM specific GenAI Monitoring Alerts using Trace Query Language
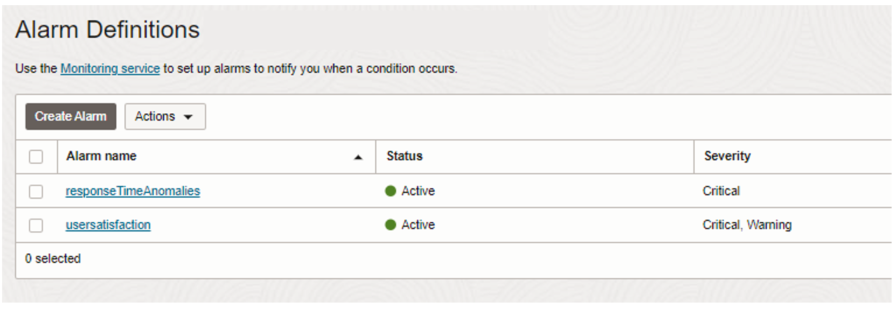
For production systems it’s critical to have alert notification of user’s satisfaction level or to prevent the propagation of errors. OCI APM queries, spans, and traces data to define specific alerts using Trace Query Language (TQL).
For this scenario we’ve defined 2 alerts:
- Anomaly detection on RAG response time to detect a baseline for the query response time. If the response time of a query is outside of this baseline, it triggers an alarm.
- User satisfaction threshold to trigger an alert for each method the Apdex score is tolerated or frustrated. Define the threshold based on your business expectations.
APM alerts are based on the OCI Monitoring service, enabling you to further use the Notification service to receive emails or integrate with your own trouble-ticketing tool or service desk solution.
End-to-End Monitoring of GenAI Solutions Benefits
Enabling end-to-end monitoring can be applied to prevent outages and improve end-user satisfaction for your Generative AI solutions. When there is an issue, you know the root cause, significantly reducing Mean Time to Repair (MTTR). Anomaly detection on response times and request counts also provides additional security controls against stress attacks on your system.
Resources