Reduce manual work of monitoring resources using OCI Ops Insights Custom Resource Alarm Configurations
Routinely administrators must find time in their busy schedules to evaluate monthly resource consumption, spot check resource utilization triggered by an urgent request, or perform resource analysis for annual budgeting and forecasting.
Many administrators manually enter command line commands or develop their own custom scripts to see if environments are running as expected and verify that plenty of resources are still available. The newly implemented Alarms capability in Ops Insights performs custom resource alarm configuration to reduce such repetitive manual work and return time back to administrators.
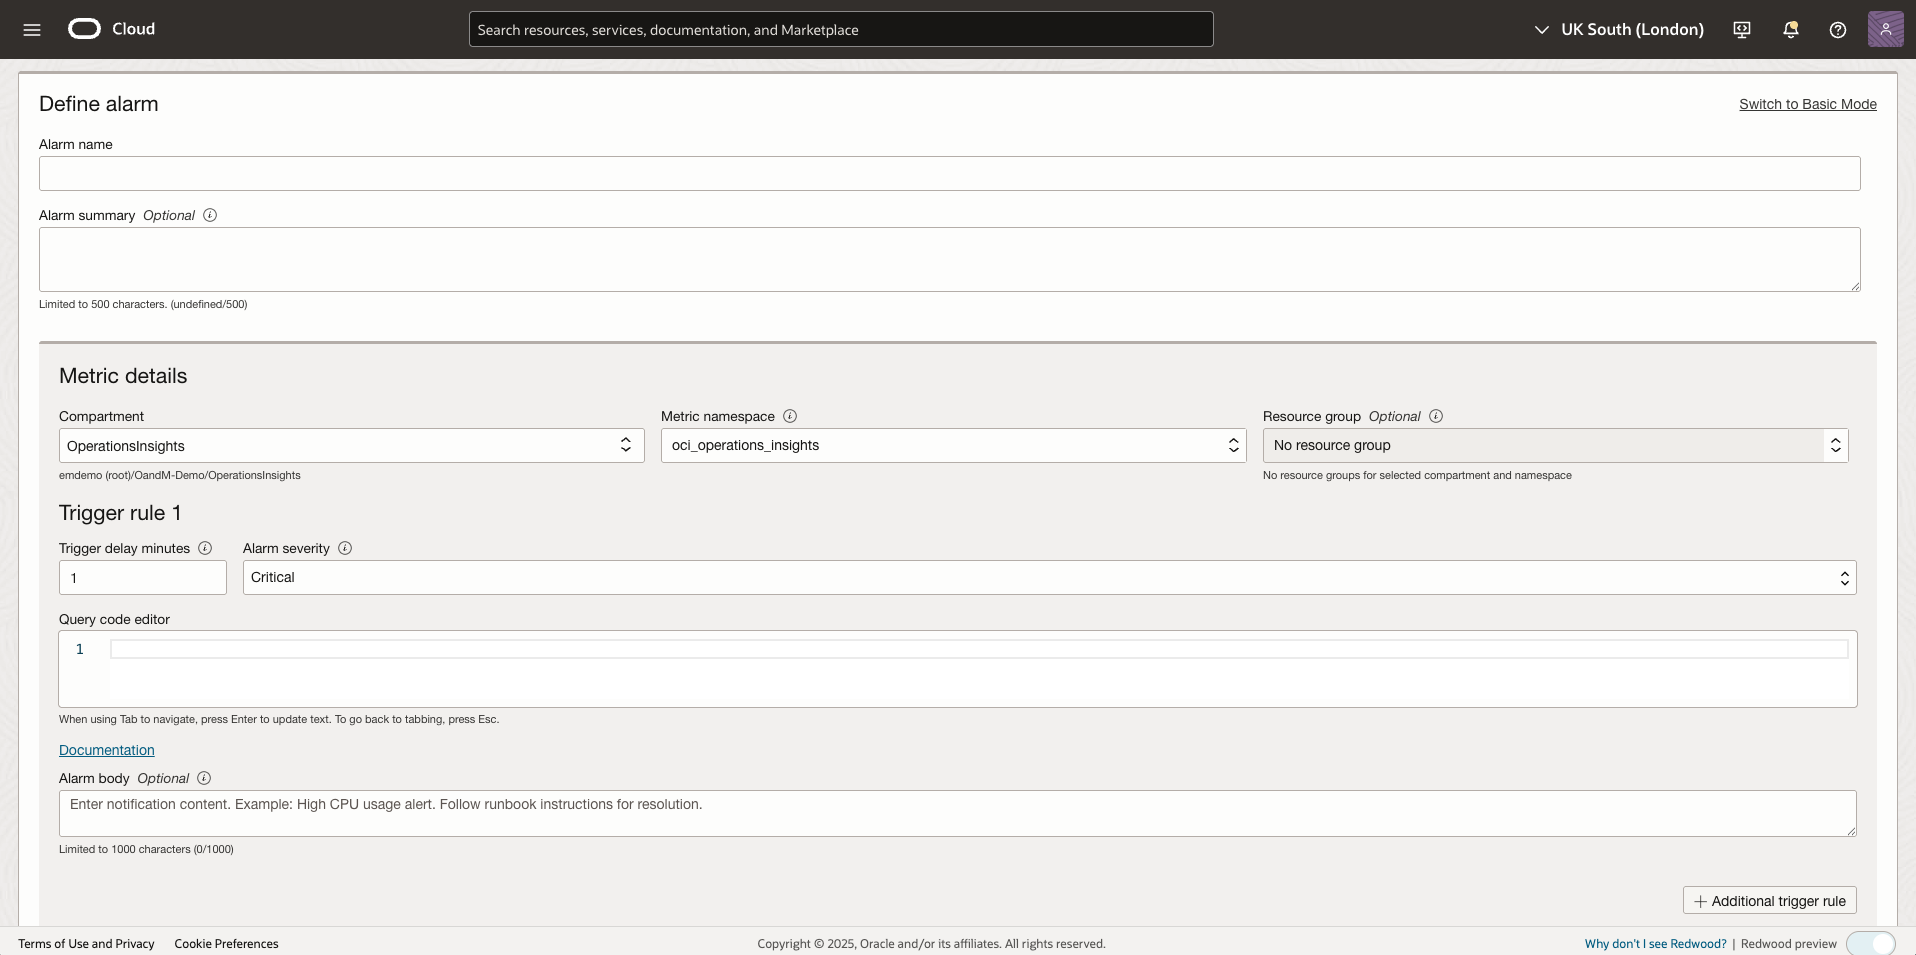
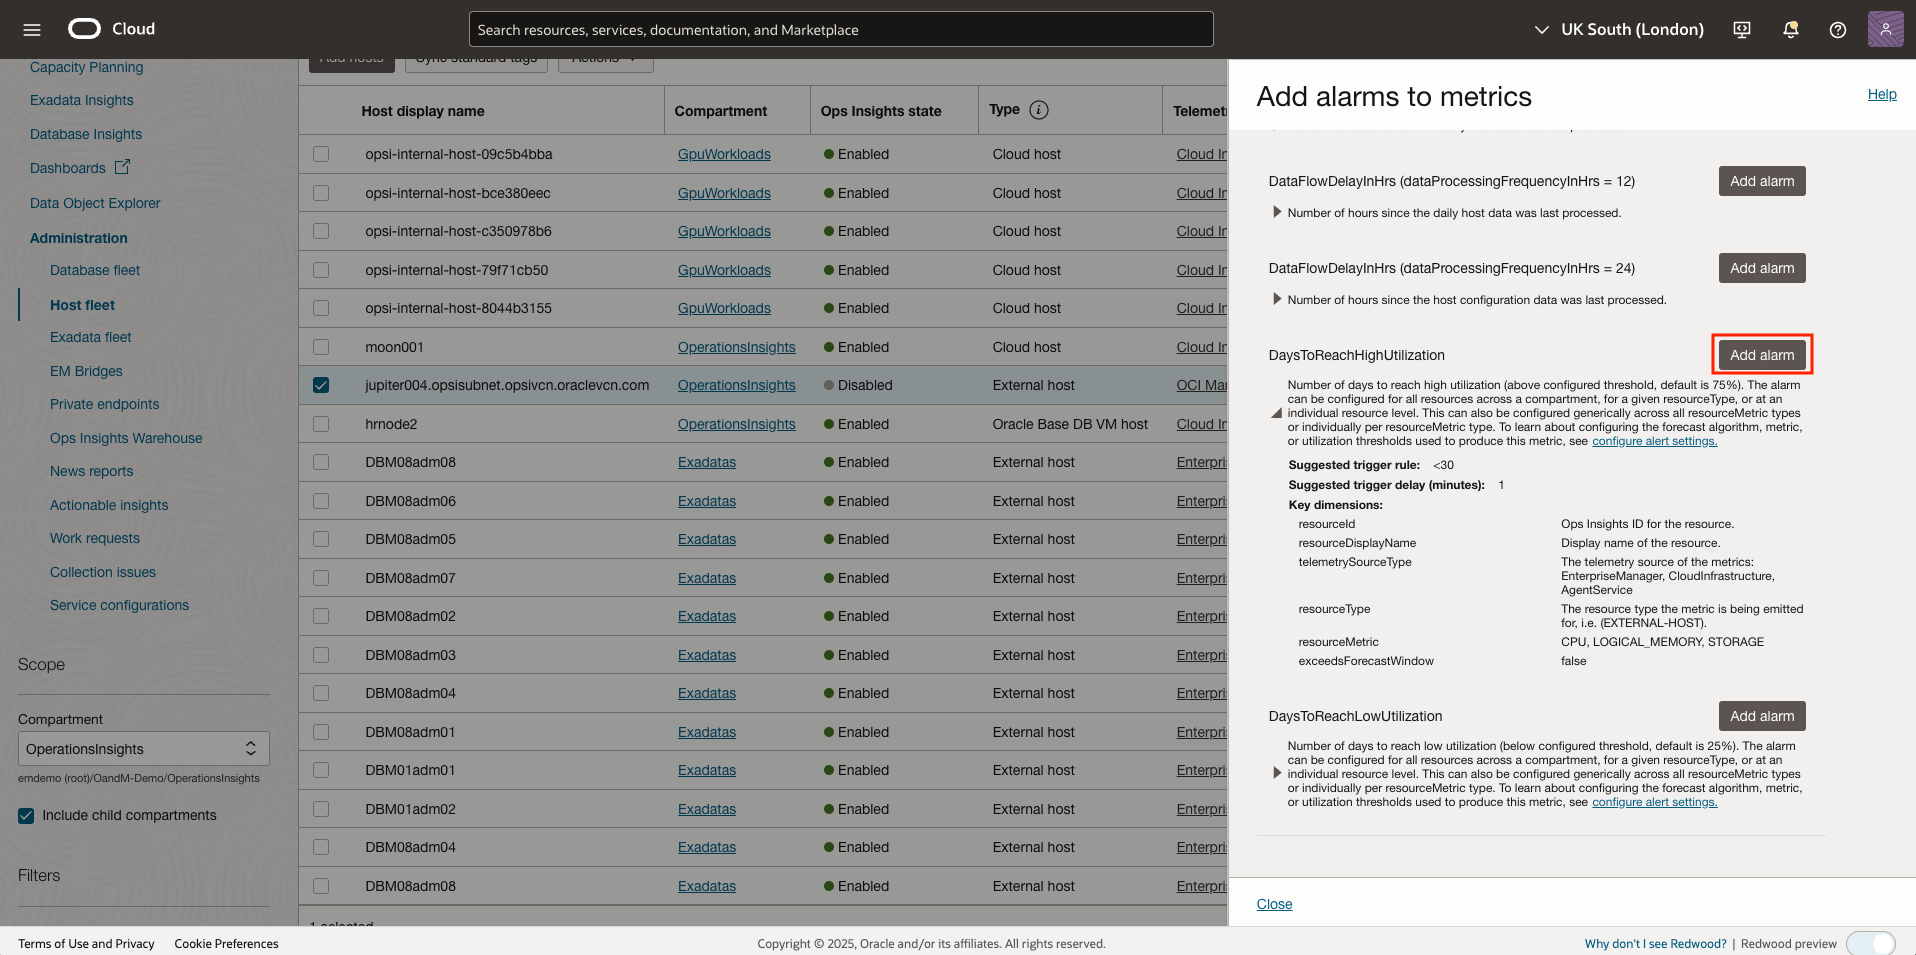
Using the Alarms capability in Ops Insights you can configure customizable alerting based on a set of metrics pertaining to hosts or databases. Define custom thresholds to prevent resource dependent outages or gaps in data collection for your cloud resources. As cloud footprint increases, resource alarms allow for easier management and save time on weekly, monthly, or annual capacity planning tasks. For example, you could configure a resource alarm to email the Systems Administrator when a 30 day forecasted high CPU utilization crosses a 75% usage threshold for a specific host.
When defining a resource alarm you can add tags and customize the definition of an alarm using Metric Query Language (MQL) in the advanced options mode. You select the metric to base the alarm on, the interval to collect the value, and the aggregation function for a set of data points (max, mean, rate, sum, etc…).
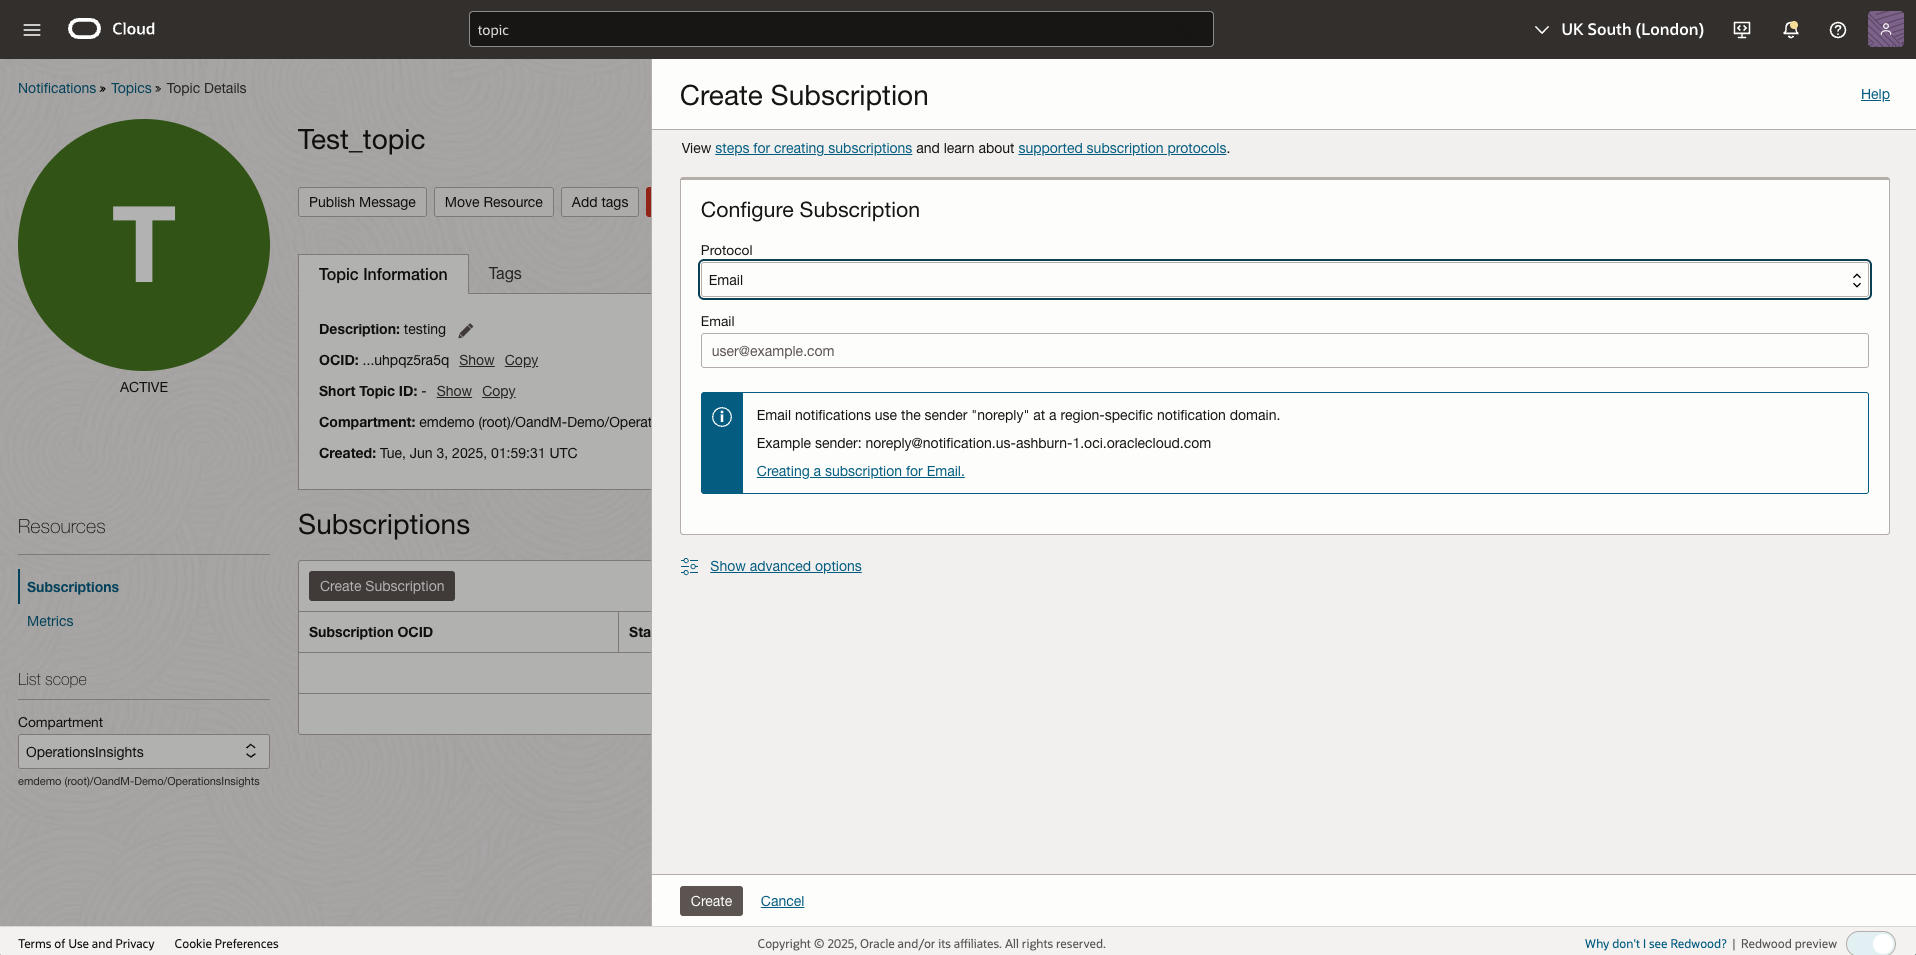
Another attribute for alarm configuration is the destination for the alert once the trigger threshold has been met. You can create or use an existing “Topic” to send a notification when it reaches the firing state. A few of the endpoints available are email addresses, Slack channels, SMS, and custom URLs enabling users to receive critical messages to act upon quickly.
Similarly, alarms can be configured for metric collection gaps for cloud resources. If for some reason telemetry is no longer occurring for a resource, a notification can be sent to an administrator for investigation ensuring continuous monitoring for your cloud environment.
Top processes insight makes troubleshooting performance and resource bottlenecks faster and easier
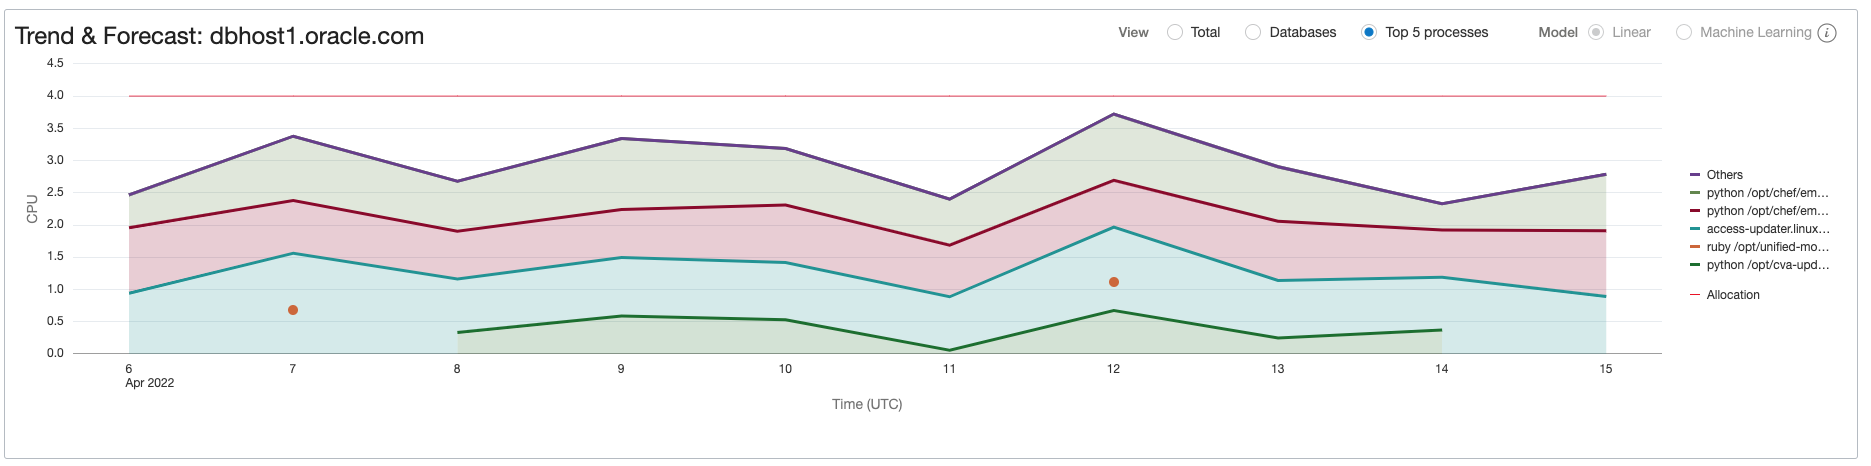
Having fast access to historic data for top processes on your host enables you to better troubleshoot, investigate performance problems and even be the hero. You certainly don’t want “that person” – the one trying to remember what commands to use or searching for a script while business/customers are awaiting the issue to be resolved.
Every minute, the top 10 processes on a host are collected, aggregated and display a broader picture of resource consumption. You can set your own defined window to look back at the top five processes in CPU or memory for a host to assist in your root cause analysis of performance issues. This functionality is available in environments supported by the Management Agent.
The new Ops Insights Alarms and Top Processes capabilities enable you to gain more insight into your resources, have better control over their monitoring, and have less worry about capacity issues in your environments. The Alarms functionality enables customizable alerting for your host resources while top processes enable better insight into performance bottlenecks.
Visit the documentation for more details and how you can configure and use this functionality.
Sign up for an Oracle Cloud Infrastructure trial account
Resources
- Oracle Cloud Observability and Management Platform
- Explore Ops Insights
- Hands-on lab: Get Started with Oracle Cloud Infrastructure Ops Insights
- Ops Insights Videos
- Ops Insights Technical Content
For more blogs on OPSI, visit the Observability and Management – OPSI blog space.
OPSI customers can now use the newly launched OCI Generative AI powered Oracle Support Digital Assistant. The Digital Assistant eliminates the need to manually search through the O&M documentation, and provides with quick, accurate answers directly within the OCI console interface. In addition to the answering the query, it also provides references and links to exact sections of our comprehensive product documentation. Learn more about it here.
