The OCI Application Performance Monitoring (APM) service provides access to lots of data related to application performance. This data can be retrieved through the powerful query language available in the APM Trace Explorer. The API is also accessible directly. This opens up a lot of integration options. This blog shows you how to create a Jupyter Notebook that demonstrates the capability to create customized reports.
This document is organized by focus areas: installation, configuration, and execution.
Install Software for Jupyter Notebook and OCI integration
Prerequisites
Install required Python libraries for Jupyter Notebook integration with OCI APM
The following libraries need to be installed as a basis for this exercise:
- Jupyter Lab: this is the code that runs the interactive notebook
- OCI: this is the OCI client that interacts with APM APIs
- Plotly: the graphical visualizer
- Pandas: data organizer for Jupyter
The following commands can be used to install the packages mentioned above:
python -m pip install --user --upgrade pip
python -m pip install --user jupyterlab oci pandas
python -m pip install --user plotly
Download the sample Jupyter Notebook query to get APM data and visualize
Please download the Jupyter Notebook: apmQueryData.ipynb. It contains an example query to get data from APM and visualize it in a scatter chart. The .ipynb file needs to be stored in a location where it can easily be found (like Documents or Desktop).
Start jupyter-lab
With libraries and packages installed as mentioned above, you should be able to start the jupyter notebook server as follows:
jupyter-lab
Executing the command above will start the notebook server and will open the jupyter web application in your default web browser.
Configure Jupyter Notebook to work with your environment
Configuration is based on collecting some properties from your environment and creating trust between the Jupyter lab and the APM environment.
Create an API signing key to integrate with OCI
Follow this process to create an API-signing key and update the OCI configuration file to contain the relevant data.
Collect the necessary Jupyter Notebook properties from OCI
The Jupyter Notebook will need the following properties to work correctly in your environment:
- OCI-profile name: the name of the profile to be used from the ~/.oci/config file that contains the authorization properties like tenant-id, user-id, and the API signing key.
- APM-Domain-ocid: the ocid for the relevant APM domain that holds the interesting data.
Update the Jupyter Notebook configuration
Find the following section in the notebook and update the APM_DOMAIN_ID with the domain-id from your environment and update the profile and config location if necessary.
# The APM Domain ID ocid
APM_DOMAIN_ID = "ocid1.apmdomain.oc1.phx.amsomethingsomething"

# location of the config file (~/.oci/config on linux)
OCI_LOC=oci.config.DEFAULT_LOCATION

# The name of the profile to use (DEFAULT)
OCI_PROFILE="DEFAULT"

# Queries will 'end' now.
# When the notebook is intended to report
# a specific period this should be set here.
QRY_BASE_TIME = datetime.utcnow()

# Query data from 'now' going back 7 days
TIME_BLOCK=timedelta(days=7)

# The number of rows returned in rest response
MAX_NUMBER_OF_ROWS=100
Manage API keys in your account
Eventually, you might create multiple API keys for different purposes. It is possible to use free-form tags related to the account to store fingerprint reference details like the host where the private key is stored. This will allow more confidence when deciding to remove an API- key when it’s not relevant anymore. Use e.g. ‘api-key-fingerprint-info-a3:53:43:2b’ (when your fingerprint starts with a3:53:43:2b) and value: apm-jupyter-blog-info.
Execute the sample Notebook
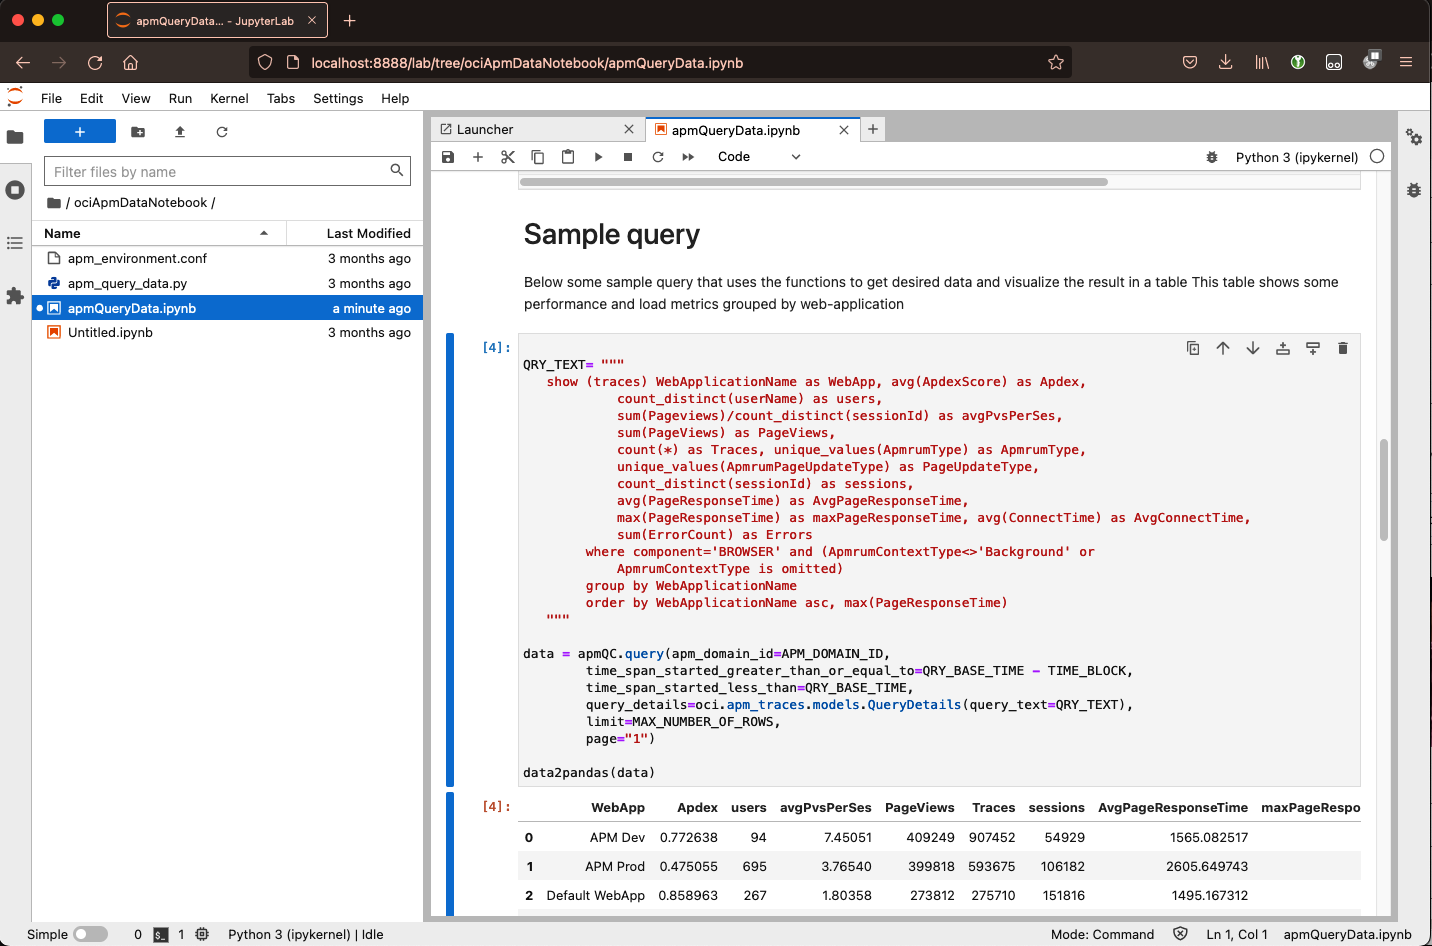
In the file browser shown in your web browser, navigate to the location where the sample notebook is stored. Double-click on the notebook to load it.
Adapt the Jupyter Notebook for your Organization
The Jupyter notebook can be triggered to load/update the data. The easiest way is to click on the ‘Run’ button to restart the kernel and run all cells from top to bottom. The queries in the notebook can be adapted and replaced by queries used in trace explorer.
Select the metrics for reporting
The APM Trace Explorer provides a powerful query language to query the recorded data. The data can be altered to provide relevant information in multiple ways. Multiple metrics are collected that can be chosen and aggregated if desired. The data can be more focused on by adding filter criteria to remove irrelevant data, which can be done by manipulating the query in the trace explorer and using the result in the notebook for the desired reporting.
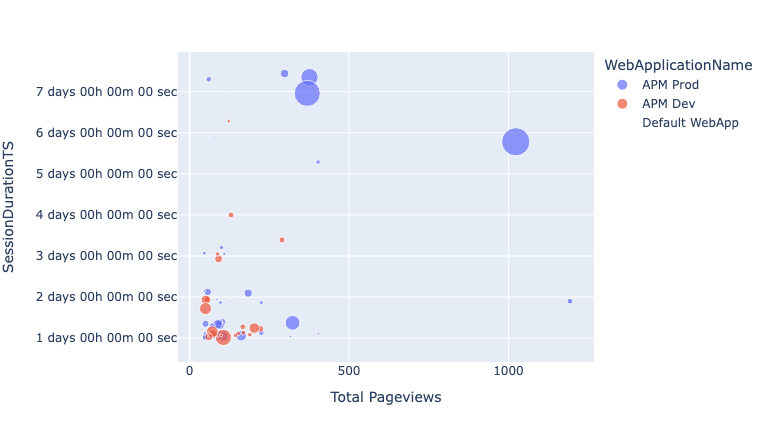
Change the Visualization
The data can be visualized by default as a table, using DataFrame. This is a common way in Jupyter notebooks to share data. There are numerous other options for visualization and some ML capabilities that can be used on this data. The example notebook visualizes data to show the relation between activity and session duration.
Resources
- Oracle Cloud Observability and Management Platform
- Application Performance Monitoring Technical Content
- For more Jupyter usage in oracle cloud context see Oracle Data Science
- For more blogs on Oracle APM, visit the Observability and Management – Application Performance Monitoring blog space.