Resolving problems, optimizing performance and managing service levels are key responsibilities for every DBA. While the Oracle database has many tools for diagnosing and troubleshooting, and most DBAs have their cadre of scripts, most DBAs responsible for sizable and or critical database estates depend on either Enterprise Manager or cloud-native OCI solutions to simplify and speed their efforts.
Top challenges DBAs identified in surveys conducted with thousands of Oracle User Group members, including many Oracle Database DBAs, were the following:
- Downtime resulting from untested changes (78% of respondents)
- Unpredictable SQL performance impacting service (48% of respondents)
- Data stores growing rapidly 20+% (46% of respondents)
Rapid troubleshooting is an important topic for DBAs. Along with troubleshooting capabilities, being proactive in database management is also a crucial need.
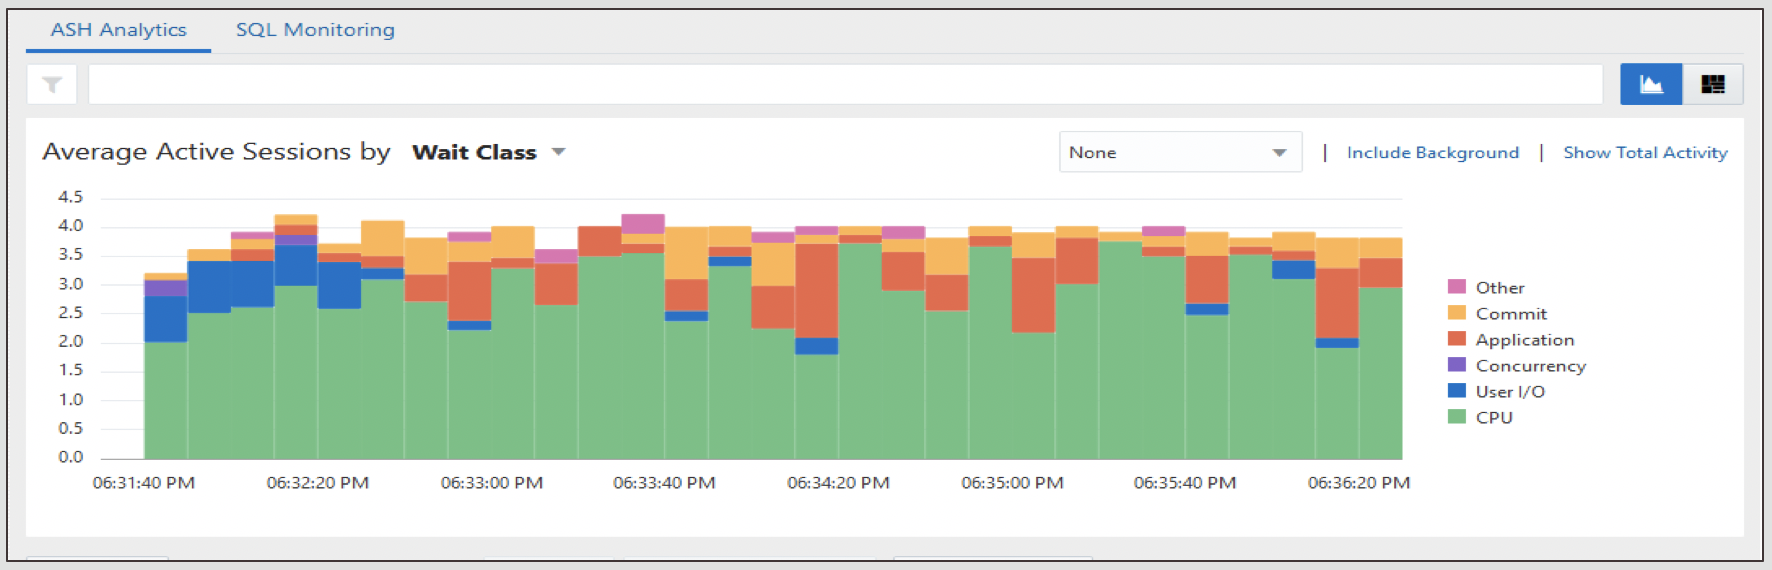
In Oracle terminology, it all boils down to database time or DB time. Simply, the goal of tuning is to reduce database time, which is the total time spent by user processes either actively working or actively waiting in a database call, including CPU time, I/O time, and active wait time (non-idle time). When you add the sum of all sessions and divide by wall clock time, you get active.
That’s where ASH or the active session history becomes a starting point for tuning. Below you see the ASH Analytics tab showing active sessions over clock time broken out by wait category or class. Higher values mean more system load or degrading performance. The biggest tuning opportunities are the biggest portion of the bars by category.
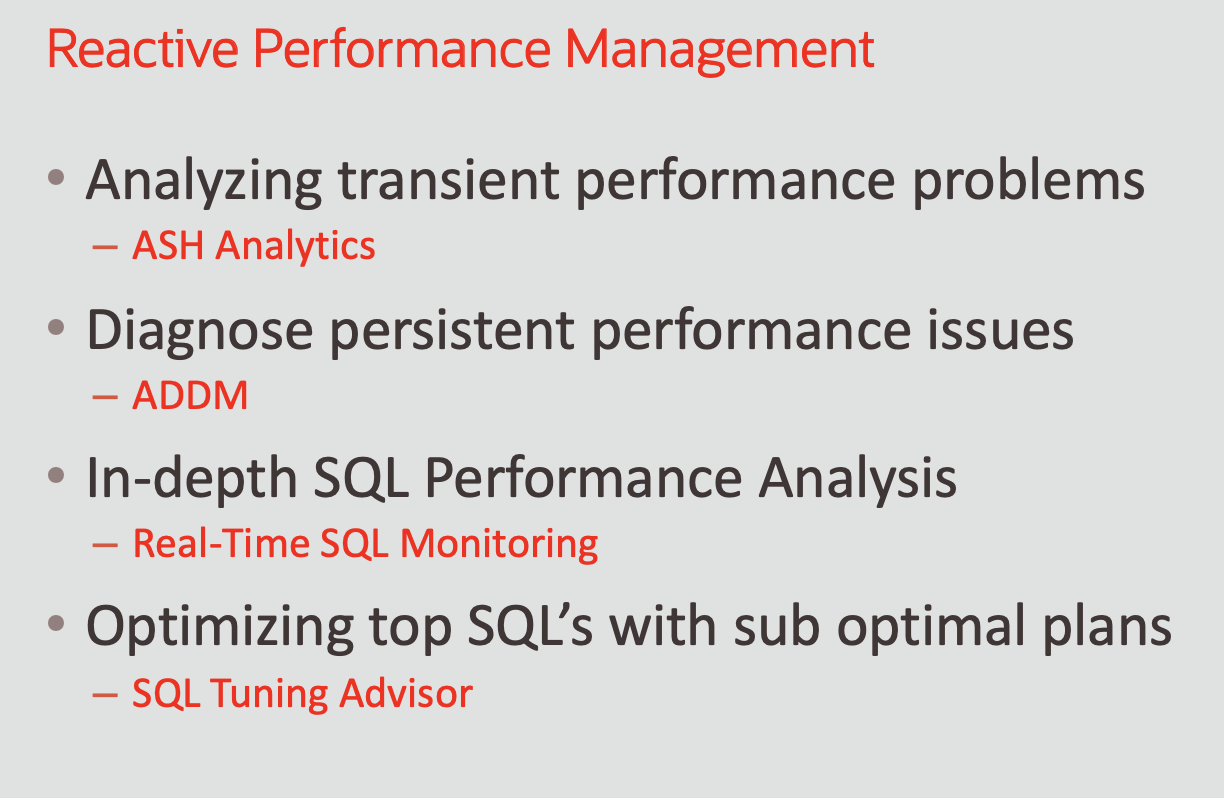
For tuning strategies, we break it into proactive and reactive approaches for managing performance. Everyone starts with the reactive side of things because it’s the most urgent. To simplify, OCI Database Management and Enterprise Manager breaks it into tools for each situation, for example, if you’re chasing something transient, use ASH. For persistent problems use the Automatic Database Diagnostic Monitor (ADDM), and for SQL analysis, Real-Time SQL Monitoring.
These platforms make it easy to integrate tools into the Performance Hub, shown above, which gives you ASH Analytics and SQL Monitoring together in 2 tabs. Here we see ASH Analytics for the SALES database.
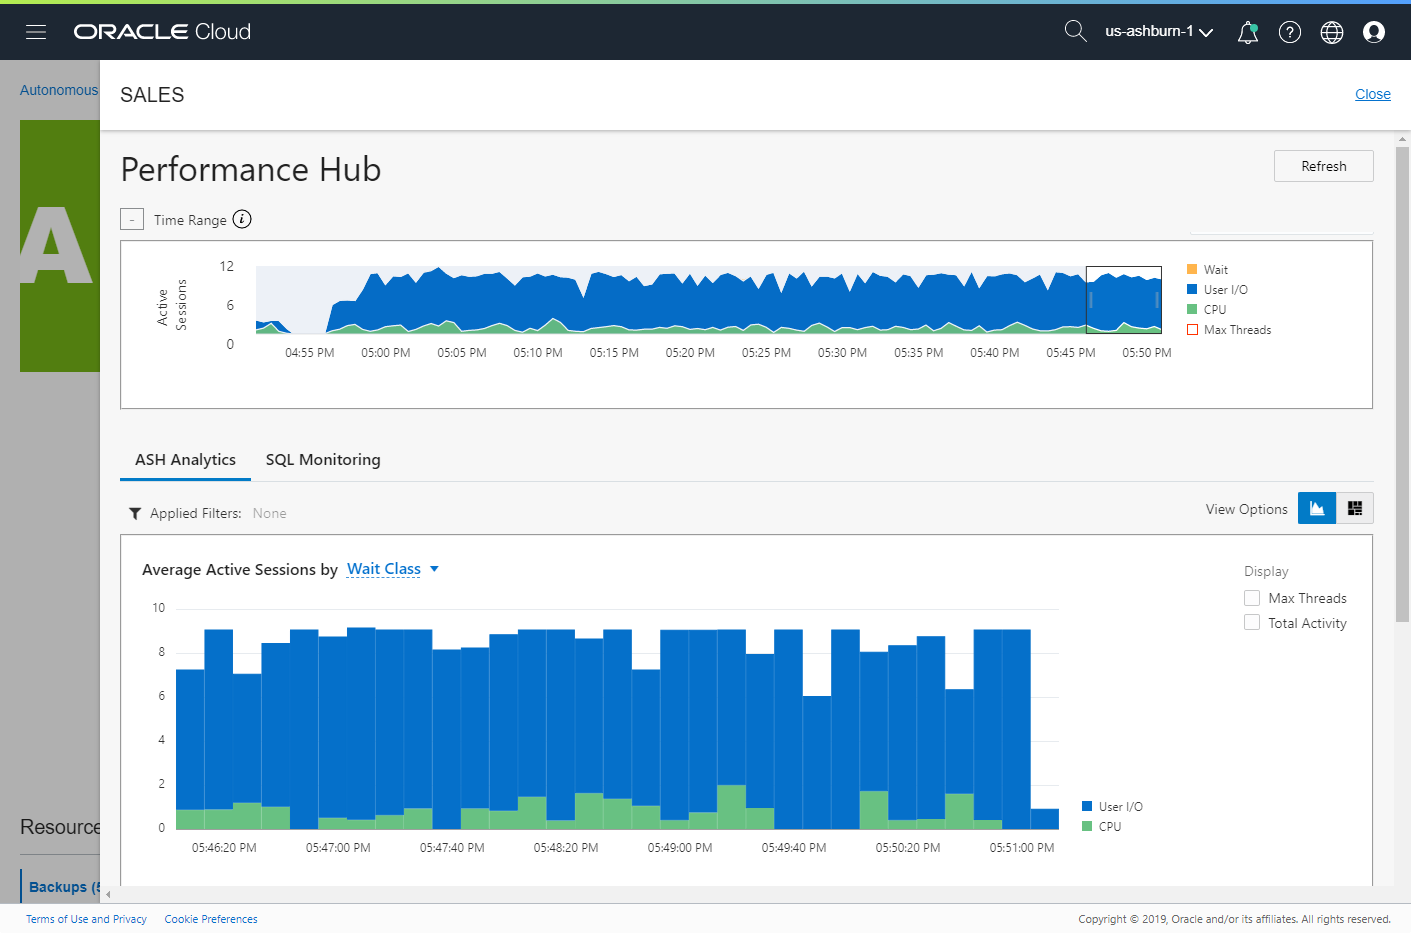
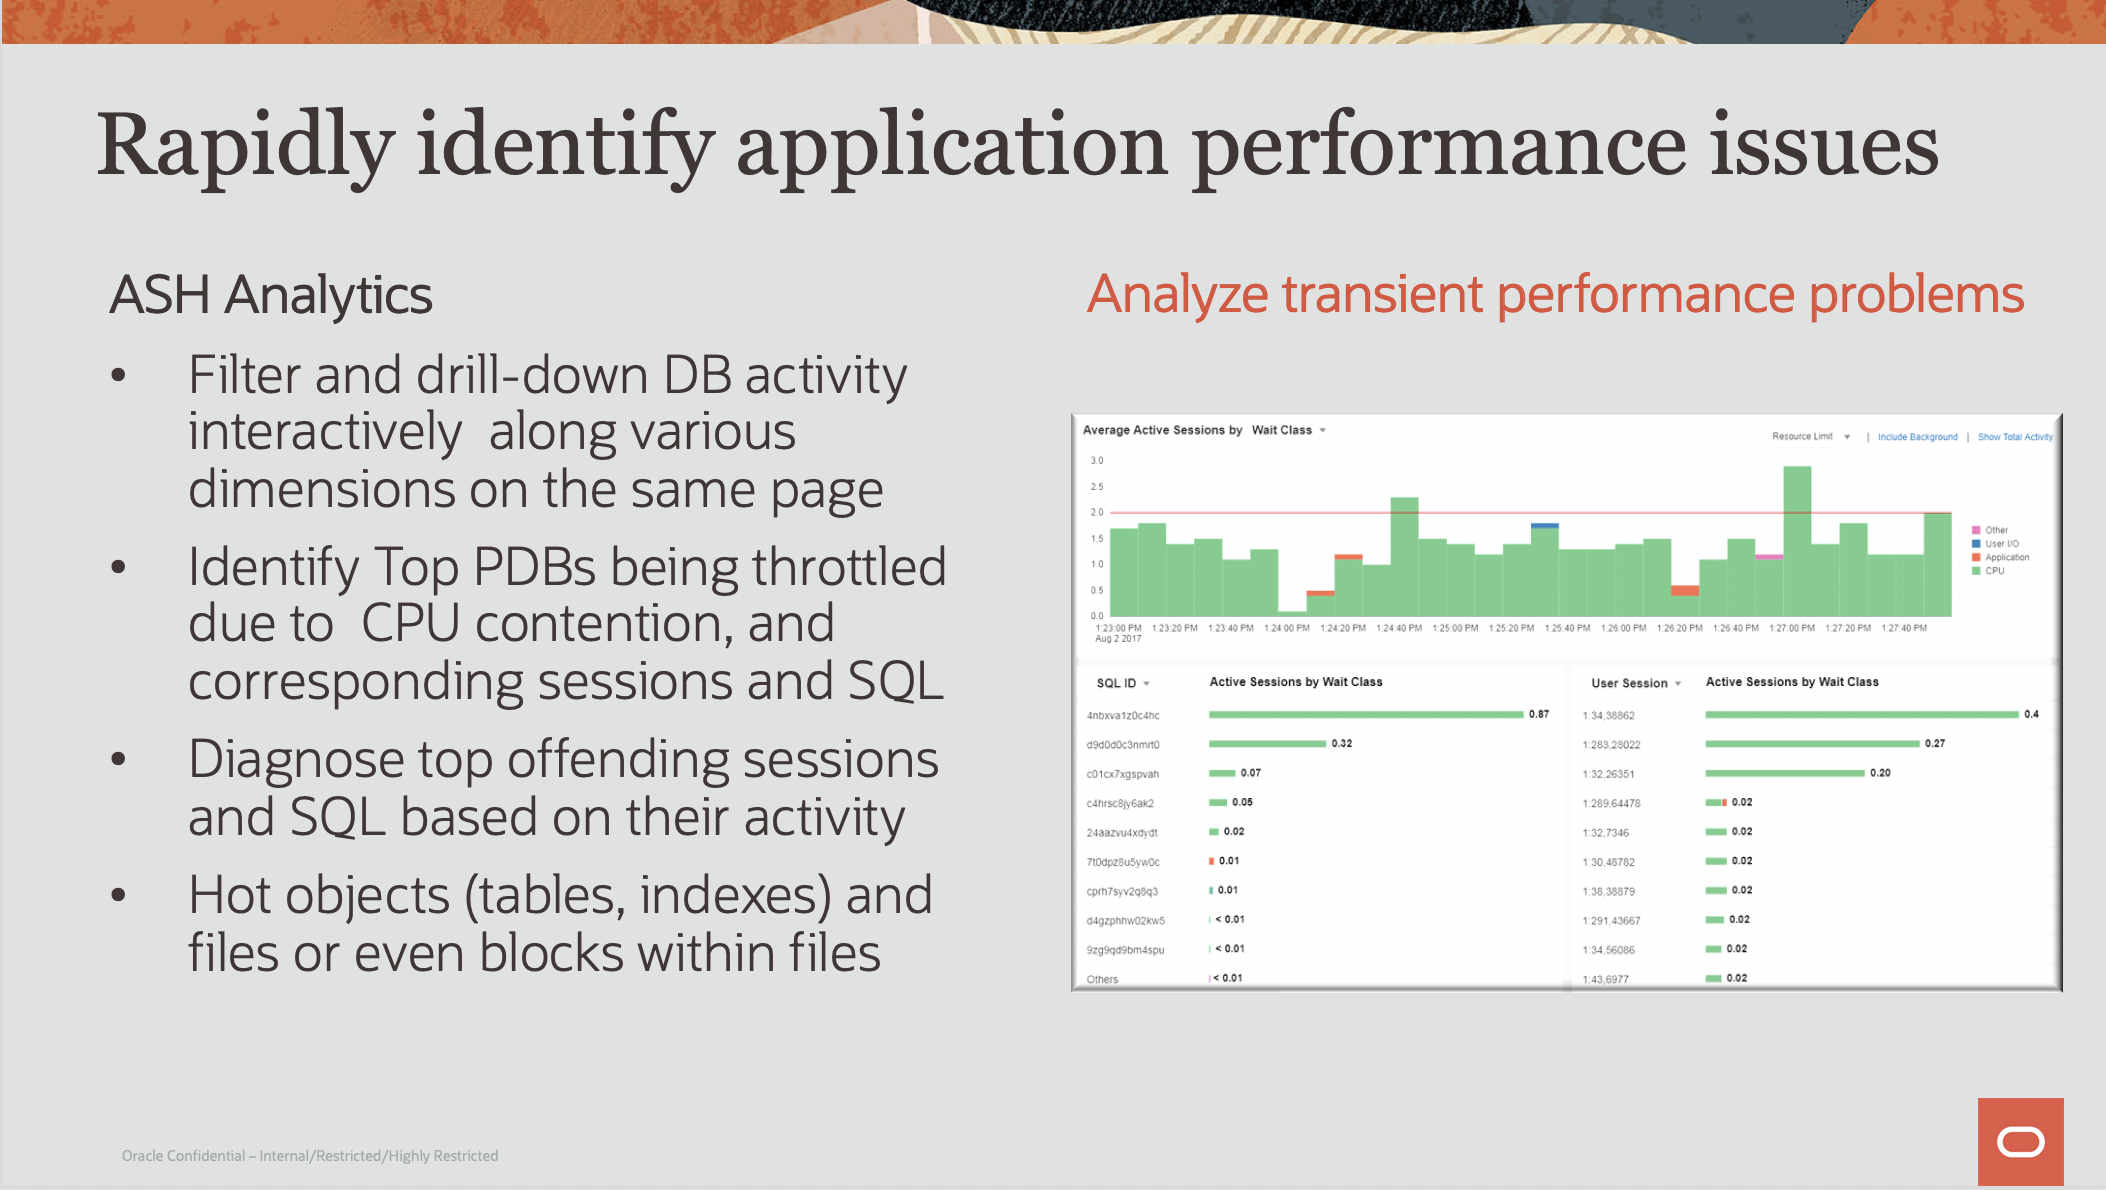
Why do DBAs like ASH for transient performance problems? The next chart explains the details.
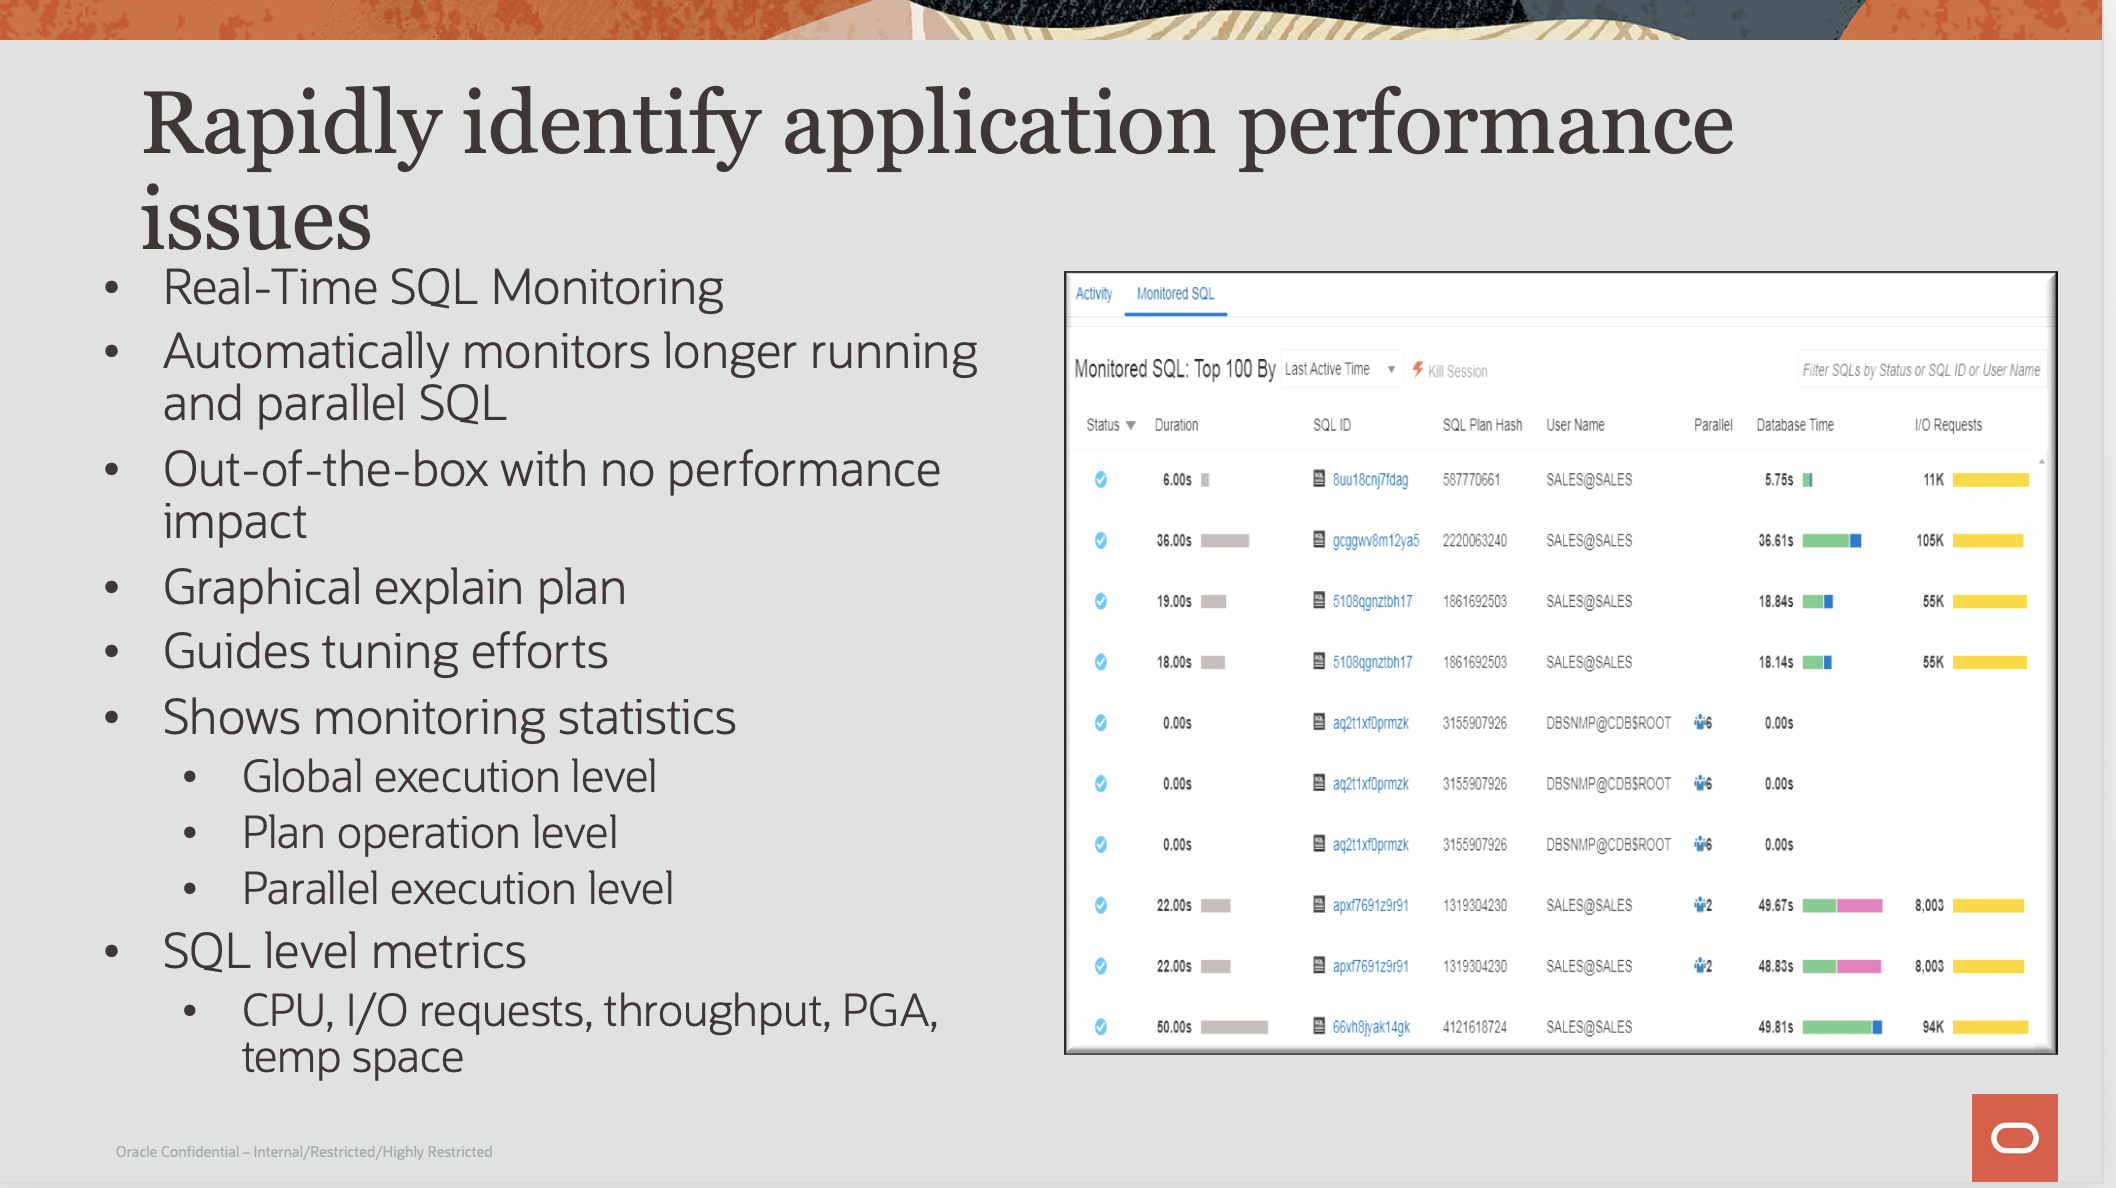
What about Real-Time SQL Monitoring? Use it to guide your tuning directions with a graphical representation of the explain plan at all levels and SQL metrics.
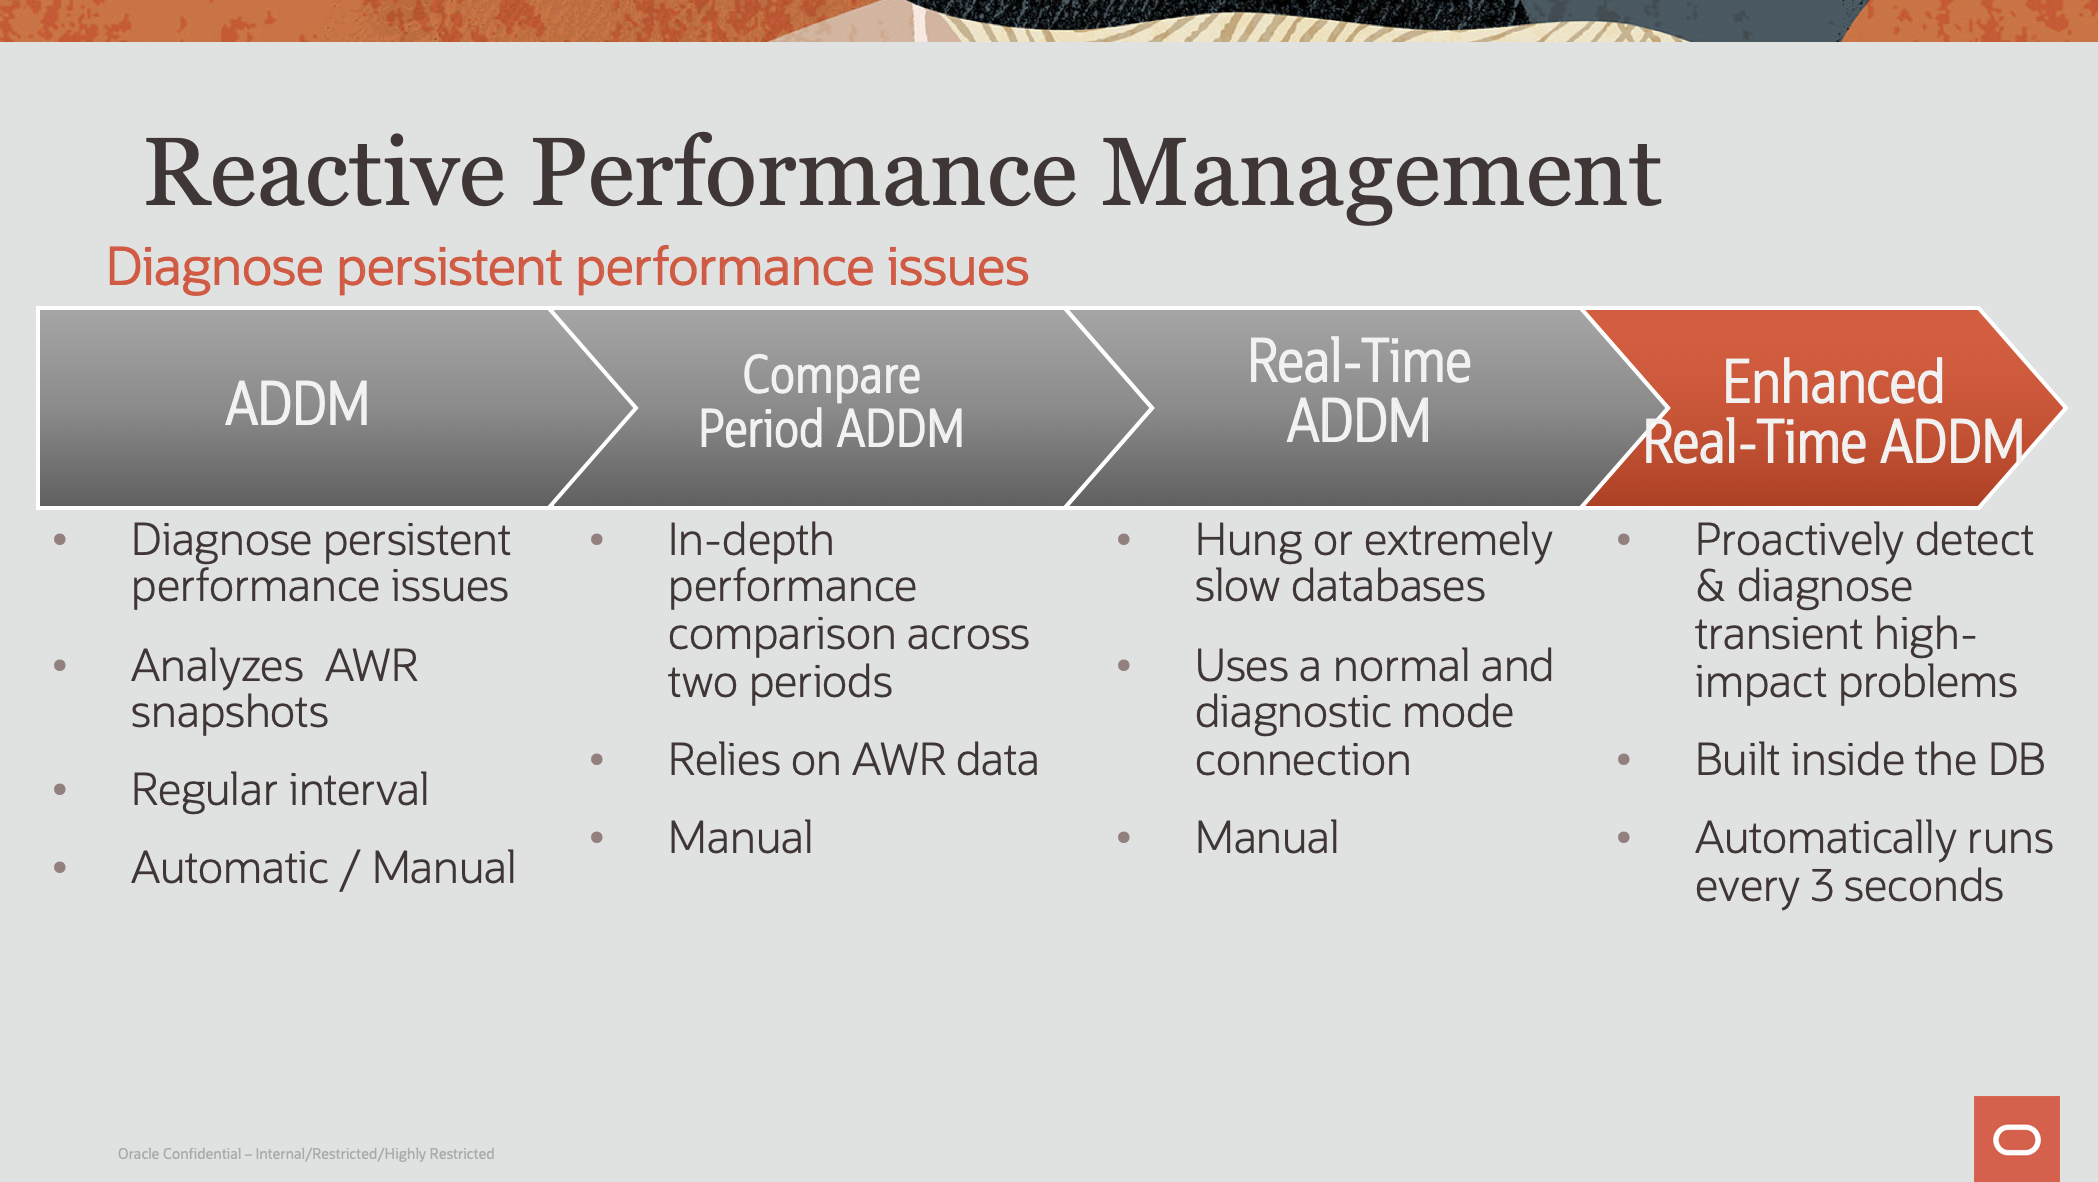
For persistent performance issues, you have ADDM with features to compare periods, real-time analysis for extremely slow or hung databases, and the Enhanced Real-Time ADDM to detect and diagnose transient problems proactively and in real-time, as problems develop.
Fixing or tuning SQL using the SQL Performance Analyzer (SPA)
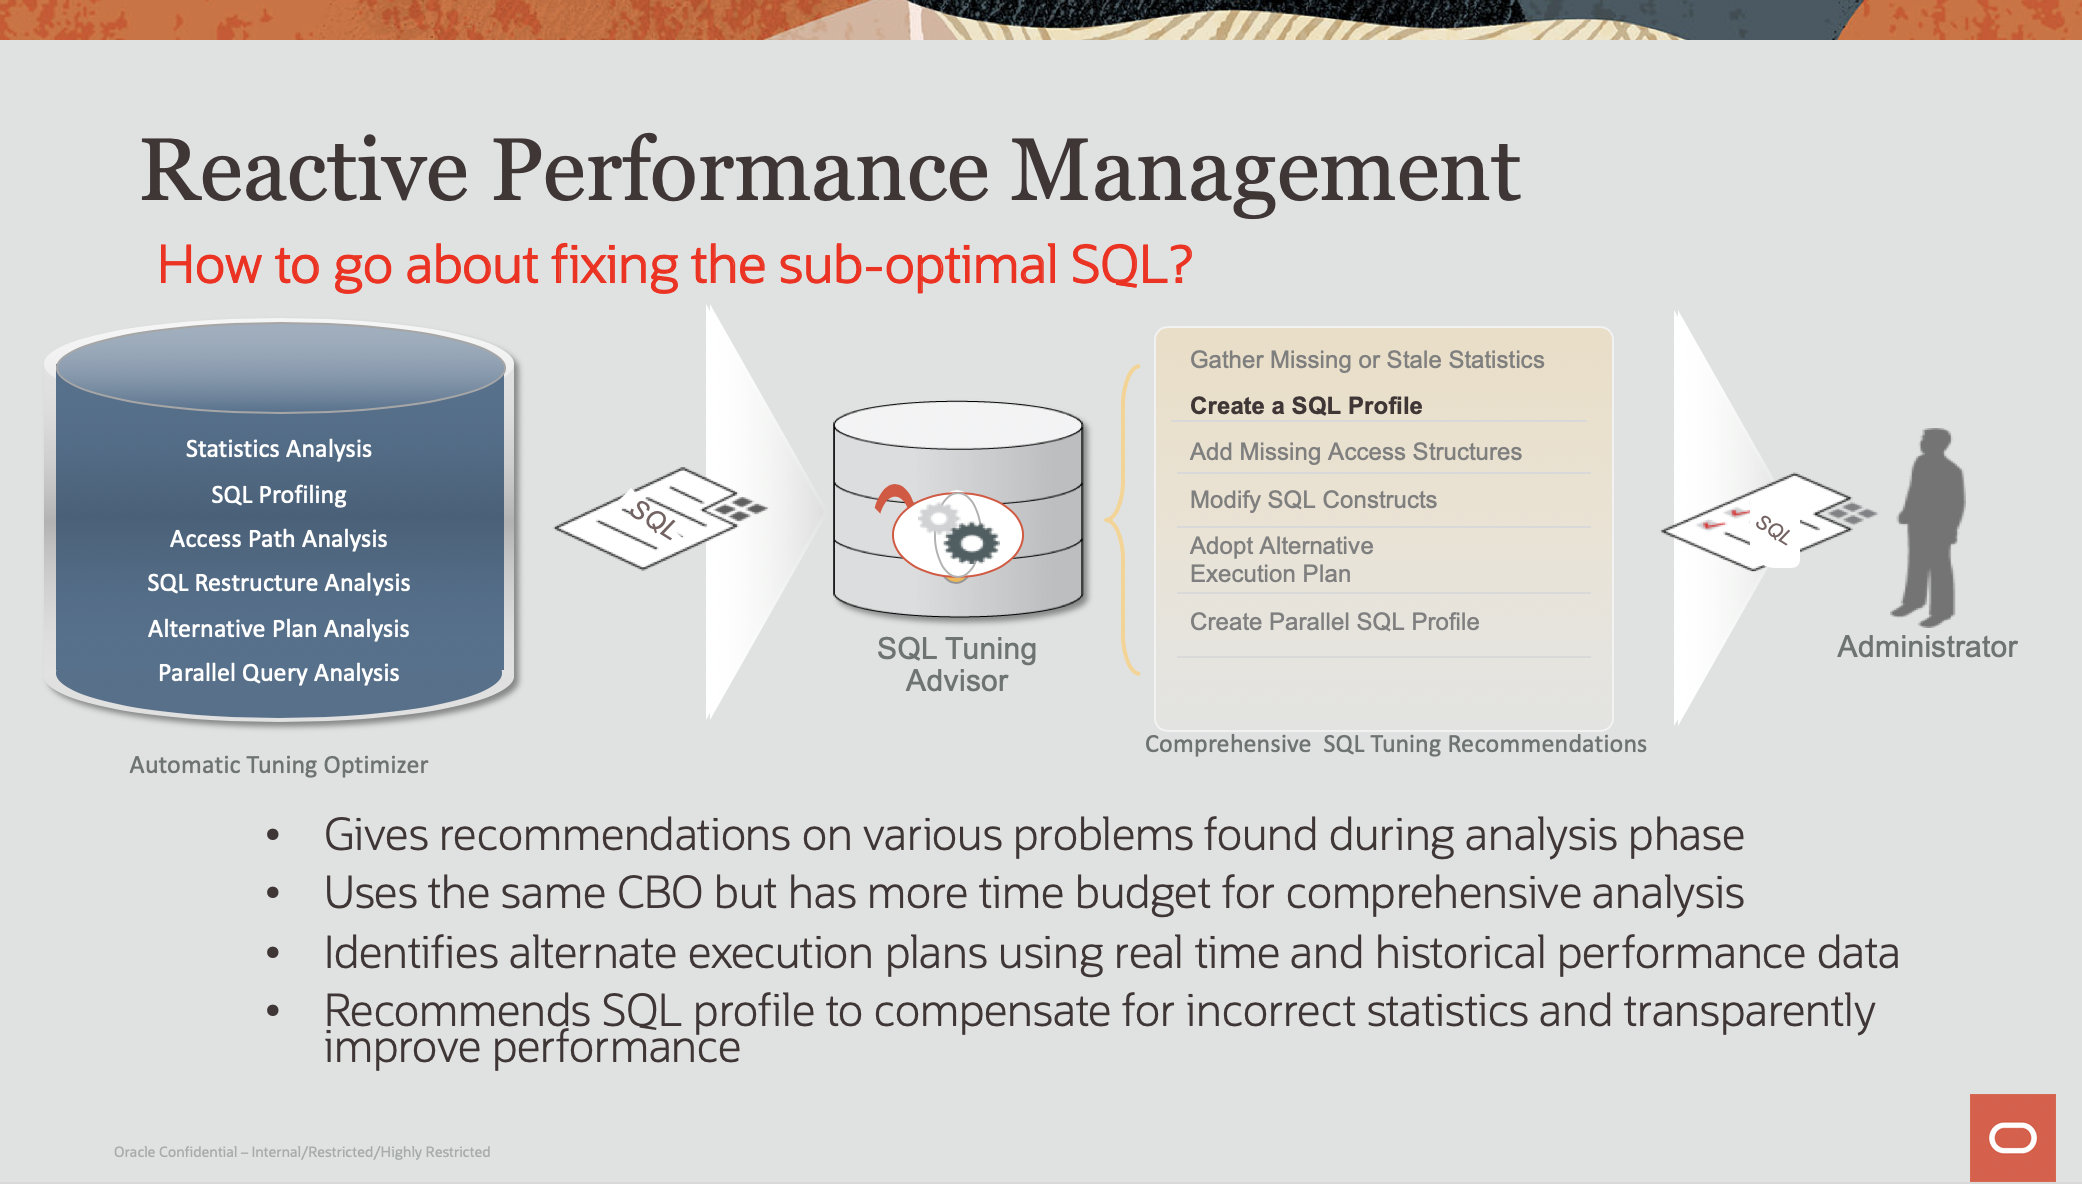
Recommendations include both SQL profile changes and indexes. Ideally, you can focus on using suggested SQL profiles since indexes may negatively impact other aspects of the workload. This is foreshadowing for the proactive section of the discussion where we’ll talk about validating performance with SQL Access Advisor.
What about Exadata? Exadata runs standard Oracle database images but has hardware and software enhancements that can automatically improve database performance.
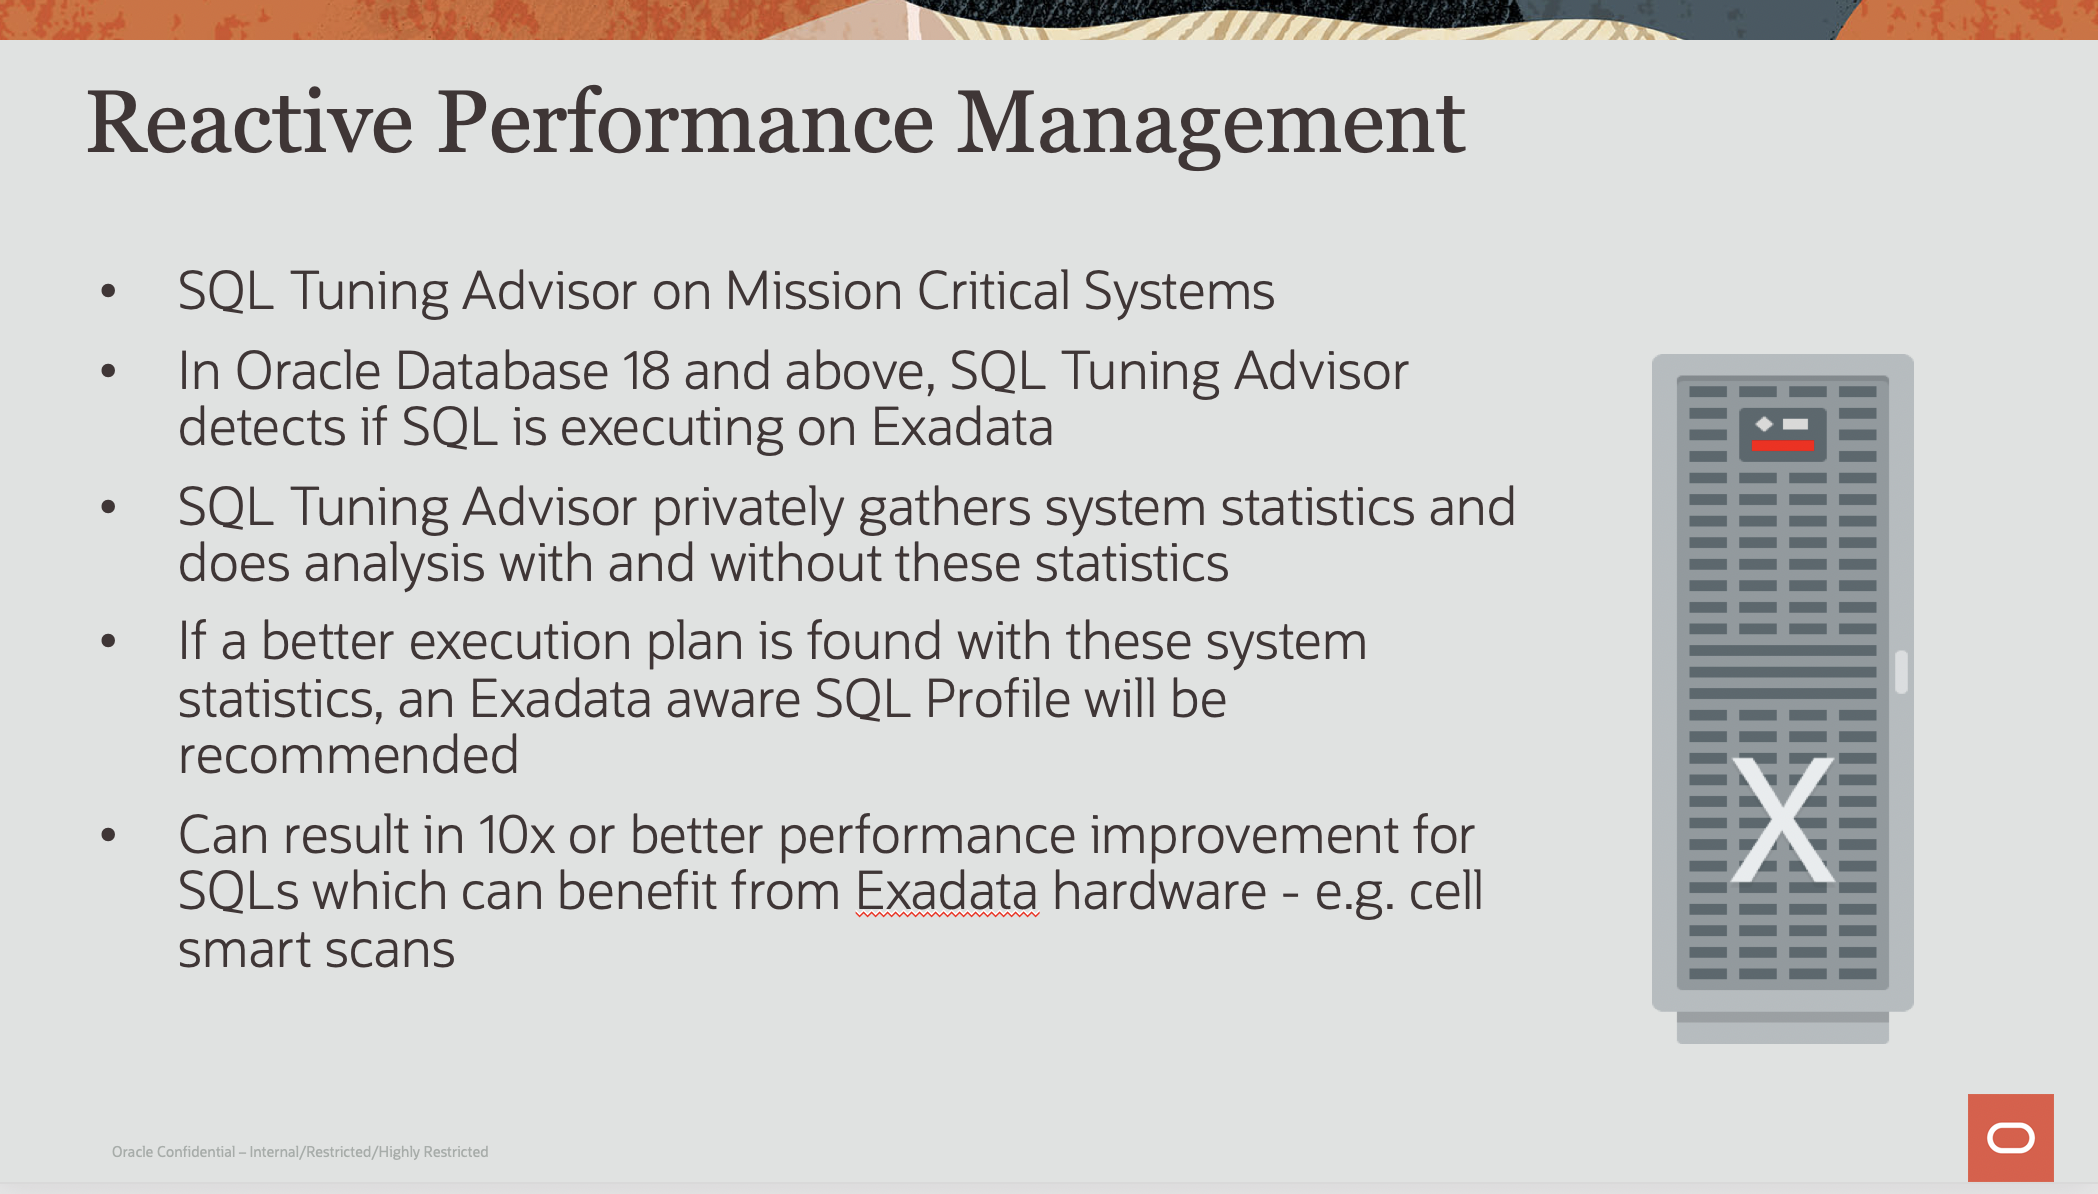
So, how do all these tools work on Exadata? Really well, especially if you are running Oracle Database 18 or higher, SQL Tuning Advisor detects and incrementally gathers Exadata-specific statistics and if a better execution plan is determined, an Exadata-aware SQL profile will be recommended. For those familiar with the capabilities of Exadata, it will automatically improve database performance dramatically, and with some additional tuning, finding an incremental 5-10X performance boost from smart scans or smart flash cache or other features isn’t surprising.
Getting Proactive
The majority of Oracle DBAs are using Diagnostics and Tuning Packs for good reason. These tools have proven themselves over many years to deliver resounding value in diagnosing and tuning problems very fast. The less known, and a potentially more valuable tool is Real Application Testing. If I may digress, in the Pique Solutions ROI analysis of using Enterprise Manager for database operations, validation testing was identified as having particularly strong returns.
If you remember from above, 78% of 1000s of DBAs surveyed identified the top challenge they face is the unexpected performance from untested changes.
You just can’t predict with certainty what will happen when changes are applied to a workload without testing it. Ideally, you could test with real-world product workloads but the cost of unpredictable results is too high. You want the predicted results, but you don’t want to impact the business negatively. A typical testing tool can realistically test about 5% of the application functionality since testers mostly code for those functions that are frequently used.
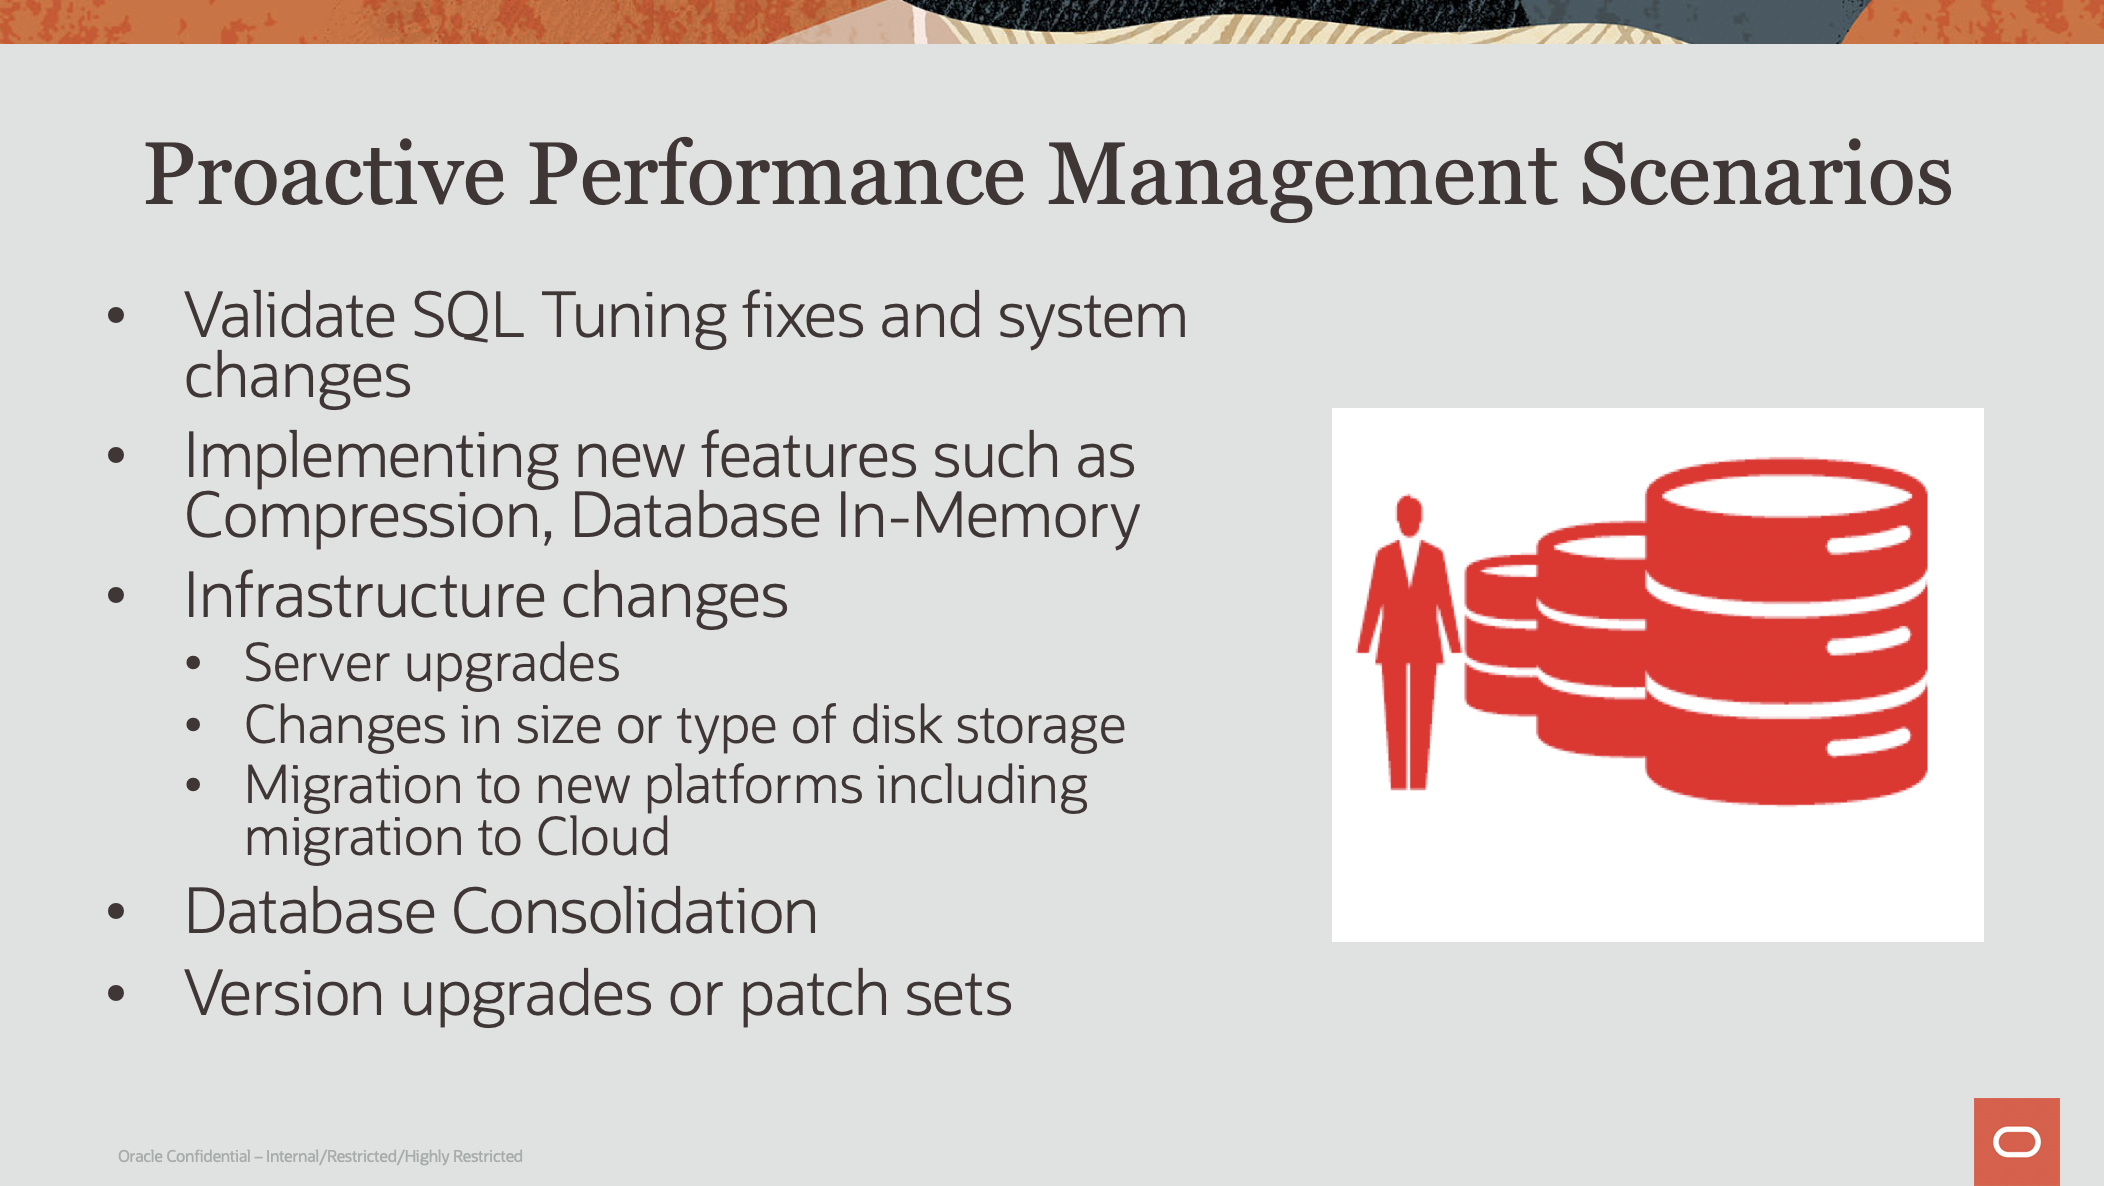
If only you could somehow simulate the complete real behavior of the changes prior to pushing to production. Think of all the many scenarios you would like to know the results before you actually do the work. How about upgrades, or adding Database options like In-memory, or Advanced Compression. Or how about new hardware? Do you want to know how much you can consolidate without pushing limits?
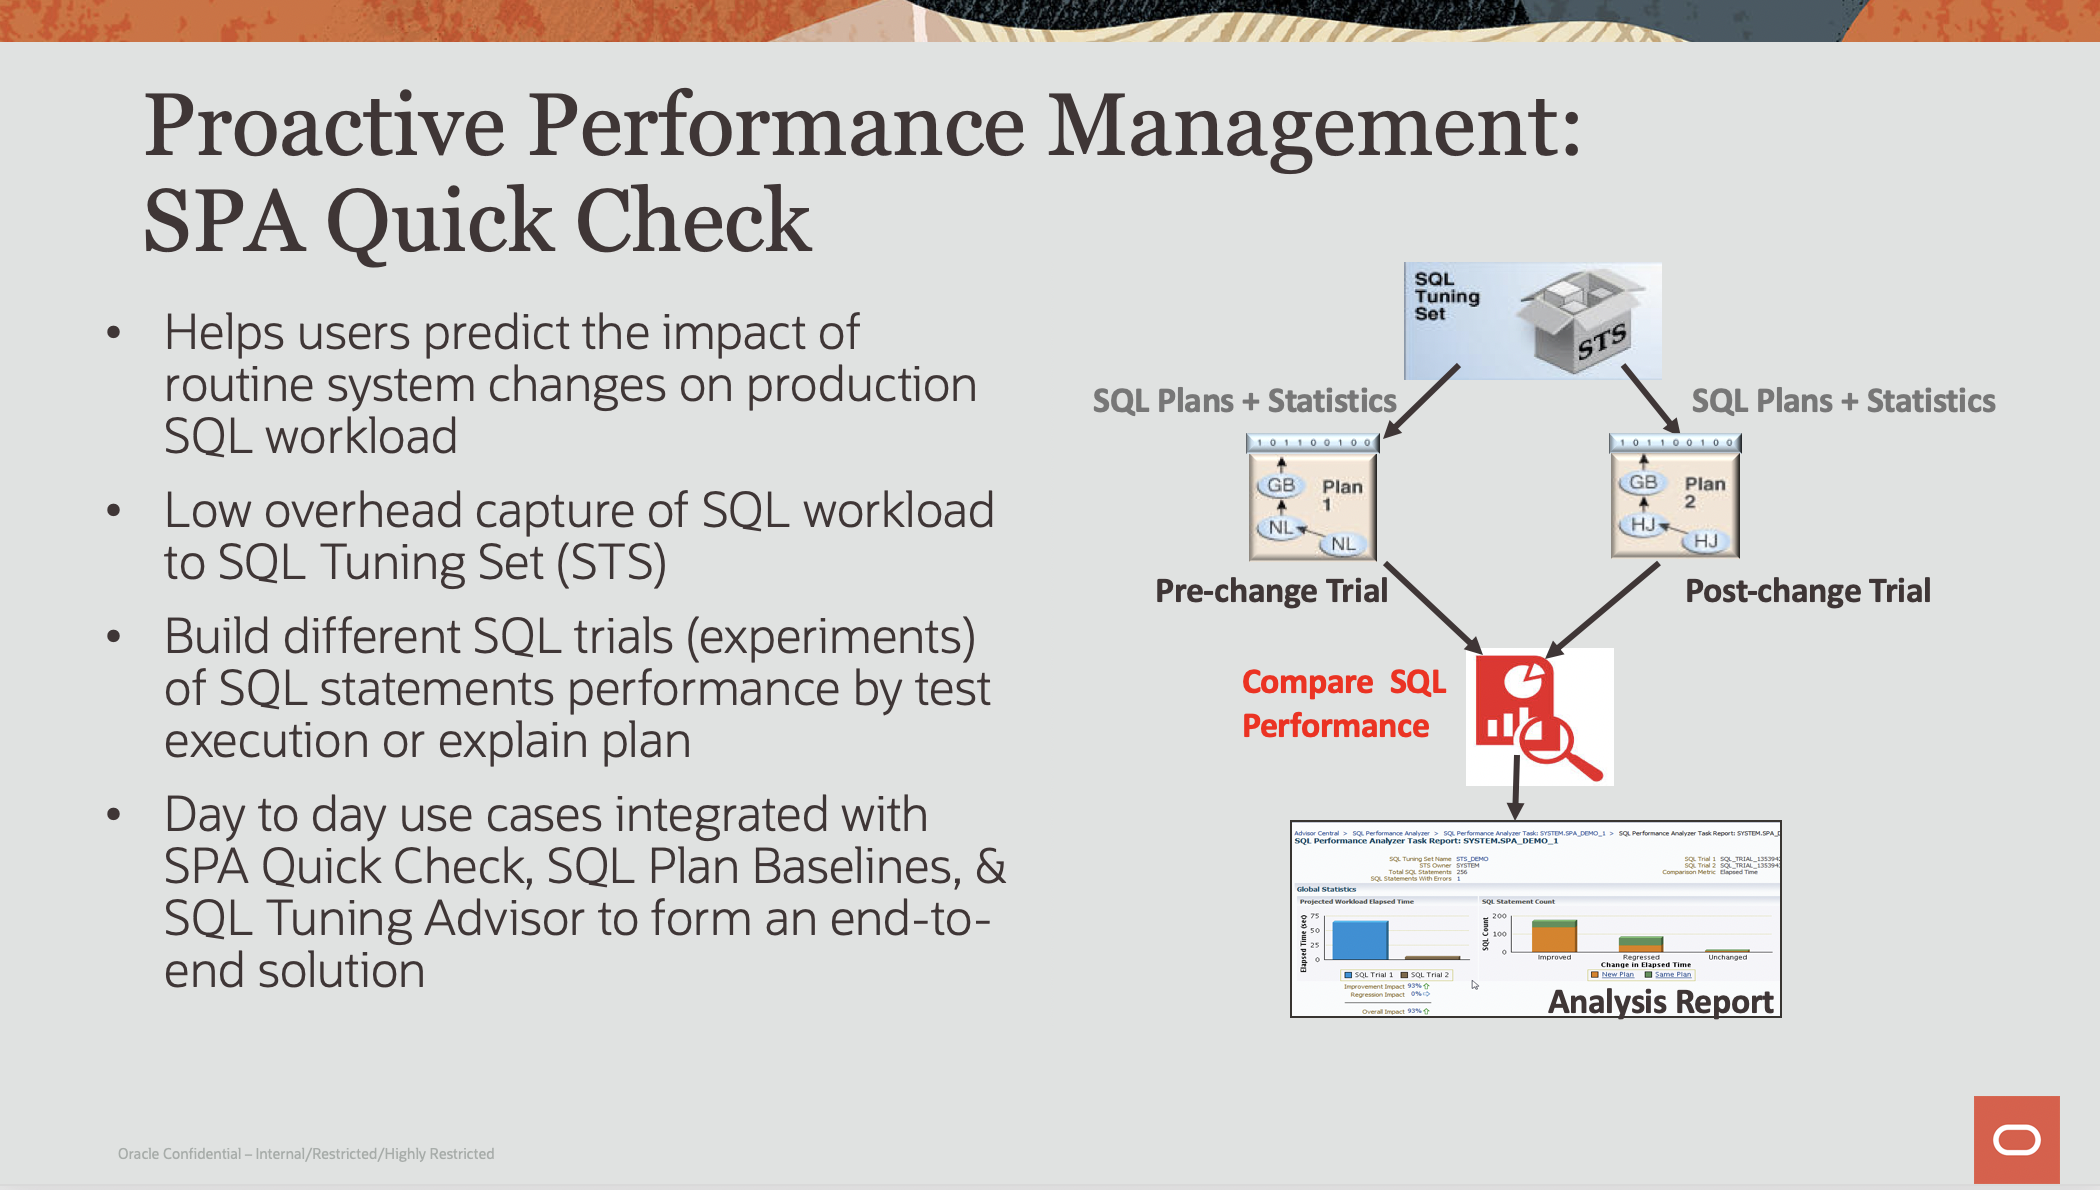
Real Application Testing and SQL Performance Watch
What SQL Performance Analyzer (SPA) does is captures real production SQL workloads to the SQL Tuning Set without impacting production performance. You build different trials with different use cases then run tests offline with and without the changes, then compare results. This pre-changes workload is typically recorded from actual production workloads by real users (there is no simulation involved).
By analyzing the impact of changes offline, improvements can be validated before implementation, avoiding unexpected changes in production. Let me say that again. Avoid unexpected changes in production.
In summary, database management is complex, but it can be simpler utilizing the correct tools. Shifting from reactive to proactive with new capabilities and tools enables DBAs to maximize their time and reduce their effort in fleet administration.
Resources:
- Oracle Cloud Observability and Management Platform
- Database Management videos, Database Management blogs, OCI Database Management documentation
- Ops Insights videos, Ops Insights blog, Ops Insights documentation
- Hands-on lab: Get Started with Oracle Cloud Infrastructure Database Management, Get Started with Oracle Cloud Infrastructure Ops Insights