You discover something has happened with your MySQL HeatWave instance, and you need to understand what events took place or you want to find the root cause of the problem. For this, you can use the MySQL error log and the HeatWave audit log.
The mysqld process has an MySQL error log which contains a record of mysqld startup and shutdown times as well as diagnostic messages such as errors, warnings, and notes that occur during server startup and shutdown, and while the server is running. For example, if mysqld notices that a table needs to be automatically checked or repaired, it writes a message to the error log.
The MySQL Heatwave service has audit service logs, which automatically record calls to all supported public application programming interface (API) endpoints throughout your tenancy as log events. The HeatWave audit log uses the Oracle Cloud Infrastructure (OCI) Audit service.
MySQL Error Log Table
With MySQL HeatWave, unlike MySQL installed on-premise or on a virtual machine, you don’t have access to an error log that is written to disk, but you can utilize the error log table in the performance schema database. Remember, the error log doesn’t just contain errors, but it contains diagnostic messages as well. Use a command-line client such as the MySQL Client or MySQL Shell to view the performance_schema.error_log table. Here are some example error log contents:
mysql> SELECT * FROM performance_schema.error_log\G
*************************** 1. row ***************************
    LOGGED: 2020-08-06 09:25:00.338624
 THREAD_ID: 0
      PRIO: System
ERROR_CODE: MY-010116
 SUBSYSTEM: Server
      DATA: mysqld (mysqld 8.4.2) starting as process 96344
*************************** 2. row ***************************
    LOGGED: 2020-08-06 09:25:00.363521
 THREAD_ID: 1
      PRIO: System
ERROR_CODE: MY-013576
 SUBSYSTEM: InnoDB
      DATA: InnoDB initialization has started.
...
*************************** 65. row ***************************
    LOGGED: 2020-08-06 09:25:02.936146
 THREAD_ID: 0
      PRIO: Warning
ERROR_CODE: MY-010068
 SUBSYSTEM: Server
      DATA: CA certificate /var/mysql/sslinfo/cacert.pem is self signed.
...
*************************** 89. row ***************************
    LOGGED: 2020-08-06 09:25:03.112801
 THREAD_ID: 0
      PRIO: System
ERROR_CODE: MY-013292
 SUBSYSTEM: Server
      DATA: Admin interface ready for connections, address: '127.0.0.1' port: 33062
The error log contains six columns:
- LOGGED – the event timestamp, with microsecond precision
- THREAD_ID – corresponds to the thread field of error events and is most similar to the PROCESSLIST_ID column of the threads table
- PRIO – the event priority. Permitted values are System, Error, Warning, Note.
- ERROR_CODE – the numeric event error code
- SUBSYSTEM – the subsystem in which the event occurred.
- DATA – the text representation of the error event.
The log_error_verbosity system variable specifies the verbosity for handling events intended for the error log. The default value for HeatWave is 3, which allows ERROR, WARNING, INFORMATION messages to be written to the log (the default value for this variable is 2, which allows for only ERROR and WARNING).
You may also filter the logs to show certain events. Here are some examples:
To filter the logs to show only errors, run the following command:
SELECT * FROM performance_schema.error_log WHERE PRIO='error';
You can select from the following subsystems: HEALTH, InnoDB, RAPID, Repl and Server. To filter the logs to only show errors from the HEALTH subsystem, run the following command:
SELECT * FROM performance_schema.error_log WHERE SUBSYSTEM IN ('HEALTH');
To filter on the HEALTH subsystem over a 2 hour time interval, run the following command:
SELECT * FROM performance_schema.error_log WHERE SUBSYSTEM = 'HEALTH' AND LOGGED > DATE_SUB(NOW(),INTERVAL 2 HOUR);
To retrieve a count of how many instances of a specific error (MY-010914) occurred in a single day, run the following command:
SELECT HOUR(LOGGED), COUNT(*) FROM error_log WHERE ERROR_CODE = 'MY-010914' AND LOGGED > DATE_SUB(NOW(),INTERVAL 1 DAY) GROUP BY HOUR(LOGGED);
To retrieve a count of how many instances of a specific error (MY-010914) occurred in a week, run the following command:
SELECT DAY(LOGGED), COUNT(*) FROM error_log WHERE ERROR_CODE = 'MY-010914' AND LOGGED > DATE_SUB(NOW(),INTERVAL 1 WEEK) GROUP BY DAY(LOGGED);
Without using any filters, you get a response similar to the following, in the descending order of LOGGED timestamp (most recent first), which displays the time the event occurred, the thread ID, priority, error code (if present), subsystem, and text describing the event:
mysql> SELECT * FROM performance_schema.error_log\G
*************************** 1. row ***************************
    LOGGED: 2021-05-10 17:09:31.132868
 THREAD_ID: 0
      PRIO: Note
ERROR_CODE: MY-010096
 SUBSYSTEM: Server
      DATA: Ignoring --secure-file-priv value as server is running with --initialize(-insecure).
*************************** 2. row ***************************
    LOGGED: 2021-05-10 17:09:31.137469
 THREAD_ID: 0
      PRIO: Note
ERROR_CODE: MY-010949
 SUBSYSTEM: Server
      DATA: Basedir set to /usr/.
*************************** 3. row ***************************
    LOGGED: 2021-05-10 17:09:31.141389
 THREAD_ID: 0
      PRIO: System
ERROR_CODE: MY-013169
 SUBSYSTEM: Server
      DATA: /usr/sbin/mysqld (mysqld 8.0.24-u1-cloud) initializing of server in progress as process 12383
*************************** 4. row ***************************
    LOGGED: 2021-05-10 17:09:31.19234
 THREAD_ID: 0
      PRIO: Note
ERROR_CODE: MY-010458
 SUBSYSTEM: Server
      DATA: --initialize specified on an existing data directory.
*************************** 5. row ***************************
..............................
HeatWave Event Types
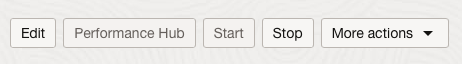
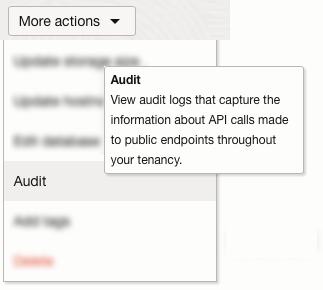
The HeatWave audit service logs provides information on DB system, backup, channel, configuration and cluster event types. You access the audit service logs by navigating to the DB system you want to review, clicking “More actions”, and then scrolling down to “Audit”:
![]()
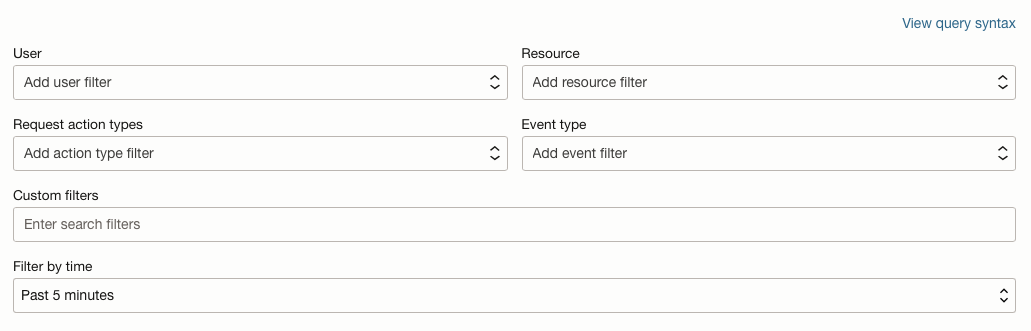
At the top of the Audit page, you have a filter section, where you can filter the audit log entries by user, resource, resource action type, event type, time/date range – and you can even create a custom filter.
The default “filter by time” is five minutes, but you have other time/date options as well as a custom range:
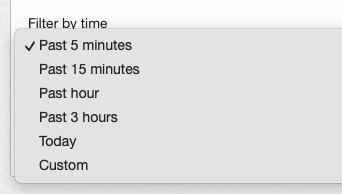
Some of the other menu options may not be available until you have specified a time/date range which will include those option values. In other words, if nothing has happened during the past five minutes, the other drop-down menu options might be blank. Select the time range first, and then you can select the other options. There are five different event types, and each one has different values for the corresponding event types:
DB System – events include: create, delete, automatic recovery, start/restart/stop, update and upgrade DB system.
Backup – events include: copy, create, delete and update backup.
Channel – events include: create, delete, reset, resume and update channel.
Configuration – events include: create, delete and update configuration.
Cluster – events include: add, delete, generate memory estimate, restart, start, stop and update cluster.
Using the audit filters is fairly intuitive and at the top of the page there is even a link to the classic audit experience:
![]()
Each log event includes a header ID, target resources, timestamp of the recorded event, request parameters, and response parameters. You can view events logged by the Audit service by using the Console, API, or the SDK for Java. Data from events can be used to perform diagnostics, track resource usage, monitor compliance, and collect security-related events. Audit logs are retained for 365 days. You can view the log retention period in the tenancy details page. For more information including permission required to access the audit logs, you may visit the Overview of Audit web page.