Overview
Modern cloud applications (like microservice or serverless apps) are distributed systems composed of many interconnected services and service instances. Without observability in place, it is often difficult to troubleshoot issues within such complex systems. The OCI Application Performance Monitoring (APM) service provides observability for end-to-end visibility and diagnosis across the entire IT environment. Using distributed transaction tracing, it connects user experiences with underlying technology to automate problem identification and diagnosis with a business-centric approach.
To add visibility into the distributed systems, telemetry traces enable users to instrument the application code all the way down to MySQL.
Building on open standards, MySQL uses the Cloud Native Compute foundation OpenTelemetry Protocol (OTLP).
This post will focus on using OCI APM and MySQL telemetry tracing for troubleshooting MySQL.
Distributed Tracing
Distributed tracing telemetry enables user to visualize full flow of any processing action as it propagates across many parts of a distributed system. The data for each action part (‘span’) includes possible error information and timing.
For example, a website user action:
- Starts by user pressing a button in an application UI (within web browser).
- Request is being propagated to the web server.
- Triggered by the request, application logic issues a number of API requests towards different services (authentication, authorization, middleware to fetch and process data from the database, etc.) before finally sending the results to be rendered on-screen.
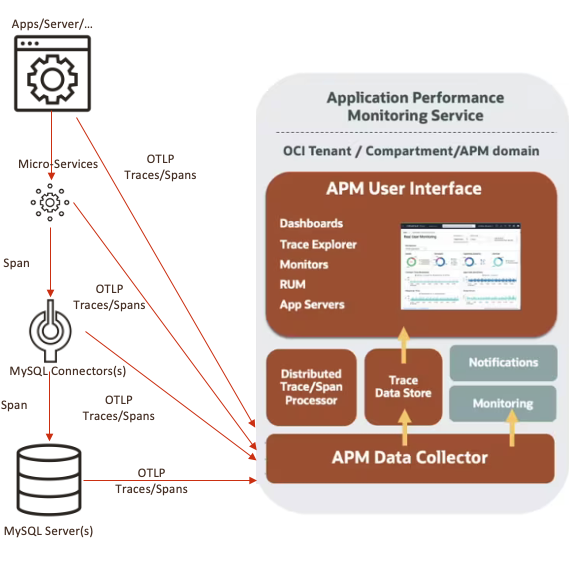
If layers within the application stack have been instrumented, they will send telemetry data directly to telemetry collector(s) independently of other parts of the system. The only cross-layer interaction here is a need to propagate telemetry context (like parent span ID) for an action as it gets processed by the layers. The final trace graph is assembled on the collector/back-end side, using telemetry context info to place each span underneath its parent span.
The image below shows the communicate between different application layers to process user actions, but each instrumented layer sends its own telemetry data (traces) independently of others (if you ignore the passing of telemetry context between layers).
MySQL Telemetry implementation
The MySQL telemetry traces feature can be used to generate traces within both the MySQL server and the client.
Traces are generated for any MySQL protocol command being executed, even for non-query commands like COM_PING, COM_STMT_CLOSE and others. Note though that only query statement traces will have an associated SQL text attribute.
Application code needs to be instrumented in two ways:
- Instrument its own code using the OTel framework to generate trace spans for its own actions (this action is independent of MySQL instrumentation)
- When executing SQL queries, pass parent span ID through a “traceparent” MySQL query attribute, so that the “child” OTel span being generated for lower level code ends up in the correct place within the graph
Traces are emitted using the OTLP HTTP protocol and can be configured to use either protobuf or JSON payload format, with or without compression. Traces capture DB sessions and SQL statements being executed on the server, as well as spans.
Telemetry tracing is implemented within
- MySQL Server Telemetry Component
- MySQL Command line tools
- MySQL Connectors
Server traces capture
- DB sessions
- SQL statements being executed on the server
To generate telemetry traces with MySQL, you enable telemetry and pass spans from the application stack, clients, connectors, and finally the mysql servers.
Demo Server Setup
This demo uses MySQL server instance deployed on OCI (Oracle Cloud Infastructure), and sends telemetry data to OCI APM (Application Performance Monitoring).
The demo show 2 options –
- OPTION 1 – simplest – direct to OCI APM and
- OPTION 2 – more customizable – using an opentelemetry-collector running on the same OCI instance that collects traces and exports them to the OCI APM backend.
We will use instrumentation in both MySQL client (telemetry client plugin loaded) and the MySQL server (telemetry component loaded), to demonstrate how the telemetry context is being propagated to make a server trace a child of the client trace.
1. Install and start MySQL server
Install MySQL Enterprise Edition Server 8.2.0 or newer (commercial edition) on OCI instance.
2. Install the MySQL Component
Connect to your MySQL server using a client and execute:
You can check default telemetry trace component settings with:
default output being:
+---------------------------------------------------------+---------------------------------+
   | Variable_name                                           | Value                           |
   +---------------------------------------------------------+---------------------------------+
   | telemetry.otel_bsp_max_export_batch_size                | 512                             |
   | telemetry.otel_bsp_max_queue_size                       | 2048                            |
   | telemetry.otel_bsp_schedule_delay                       | 5000                            |
   | telemetry.otel_exporter_otlp_traces_certificates        |                                 |
   | telemetry.otel_exporter_otlp_traces_client_certificates |                                 |
   | telemetry.otel_exporter_otlp_traces_client_key          |                                 |
   | telemetry.otel_exporter_otlp_traces_compression         | none                            |
   | telemetry.otel_exporter_otlp_traces_endpoint            | http://localhost:4318/v1/traces |
   | telemetry.otel_exporter_otlp_traces_headers             |                                 |
   | telemetry.otel_exporter_otlp_traces_protocol            | http/protobuf                   |
   | telemetry.otel_exporter_otlp_traces_timeout             | 10000                           |
   | telemetry.otel_log_level                                | info                            |
   | telemetry.otel_resource_attributes                      |                                 |
   | telemetry.query_text_enabled                            | ON                              |
   | telemetry.trace_enabled                                 | ON                              |
   +---------------------------------------------------------+---------------------------------+
   15 rows in set (0.01 sec)
3. Setup OCI APM
Login to OCI Console – Go to Observability – OCI APM – Administration
Add a Domain.
Go into the Domain and then into Data Keys. Use the Data Upload Endpoint and Private Data Key in the Otel configuration below.
4. Push data to OCI APM
Design options – Traces can either be sent
- Directly to the OCI APM endpoint
- Via an Otel collector – this allows additional customization options the Otel collector can provide. For example sending the trace information multiple trace consumers using pipelines.
Pick one of these. Ref: https://dev.mysql.com/doc/refman/8.2/en/telemetry-trace-install.html
4.1 Option 1 – To write traces directly to OCI APM
login as root/admin using the mysql command line or mysqlsh (in sql mode)
> set persist_only telemetry.otel_exporter_otlp_traces_headers=’Authorization=dataKey <private key string>’;
For example (showing with invalid data key)
> set persist_only otel-exporter-otlp-traces-headers = “Authorization=dataKey ###########################”
4.1.b
> set persist_only telemetry.otel_exporter_otlp_traces_endpoint=<APM Endpoint>
For example (showing with invalid endpoint)
> set persist_only telemetry.otel_exporter_otlp_traces_endpoint=’https://################.apm–agt.us-ashburn-1.oci.oraclecloud.com/20200101/opentelemetry/private/v1/traces’;
4.2 Option 2 – Write traces to Otel Collector and the collector pipe to OCI APM
4.2.a Find and download the otelcol package for your environment and install
For example for Linux –
yum localinstall otelcol_0.63.0_linux_amd64.rpm
4.2.b Configure a local otel collector (optional)
Leave the settings as-is within the server – thus pointing to this Otel collector running locally (for this example)
Once the open telemetry collector is installed locally on a linux operating system (Oracle Linux for example)
$ vi /etc/otelcol/config.yaml
Note – YAML formatting is very specific – for example do not use any tab characters etc. Note BOLD items below in this example
otlp:
protocols:
http:
logging:
verbosity: detailed
otlphttp:
endpoint: “https://################.apm-agt.us-ashburn-1.oci.oraclecloud.com/20200101/opentelemetry/private/v1/traces”
headers: {“Authorization=dataKey ###########################”}
batch:
health_check:
pprof:
endpoint: :1888
zpages:
endpoint: :55679
extensions: [pprof, zpages, health_check]
pipelines:
traces:
receivers: [otlp]
processors: [batch]
exporters: [otlphttp]
metrics:
receivers: []
processors: []
exporters: []
4.2.c Start the Otel collector
Use the MySQL command – set persist to modify the settings, if needed.
Steps
- Get the private data key string for your APM domain
- Get the endpoint path for your APM domain
- Change telemetry configuration to use those values:
- Restart the MySQL server.
4. Execute query using mysql with telemetry client plugin loaded
Start mysql client again, this time with client telemetry plugin loaded (adjust plugin directory path to your installation, if needed):
Enter password:
In new mysql client session, execute some test SQLs
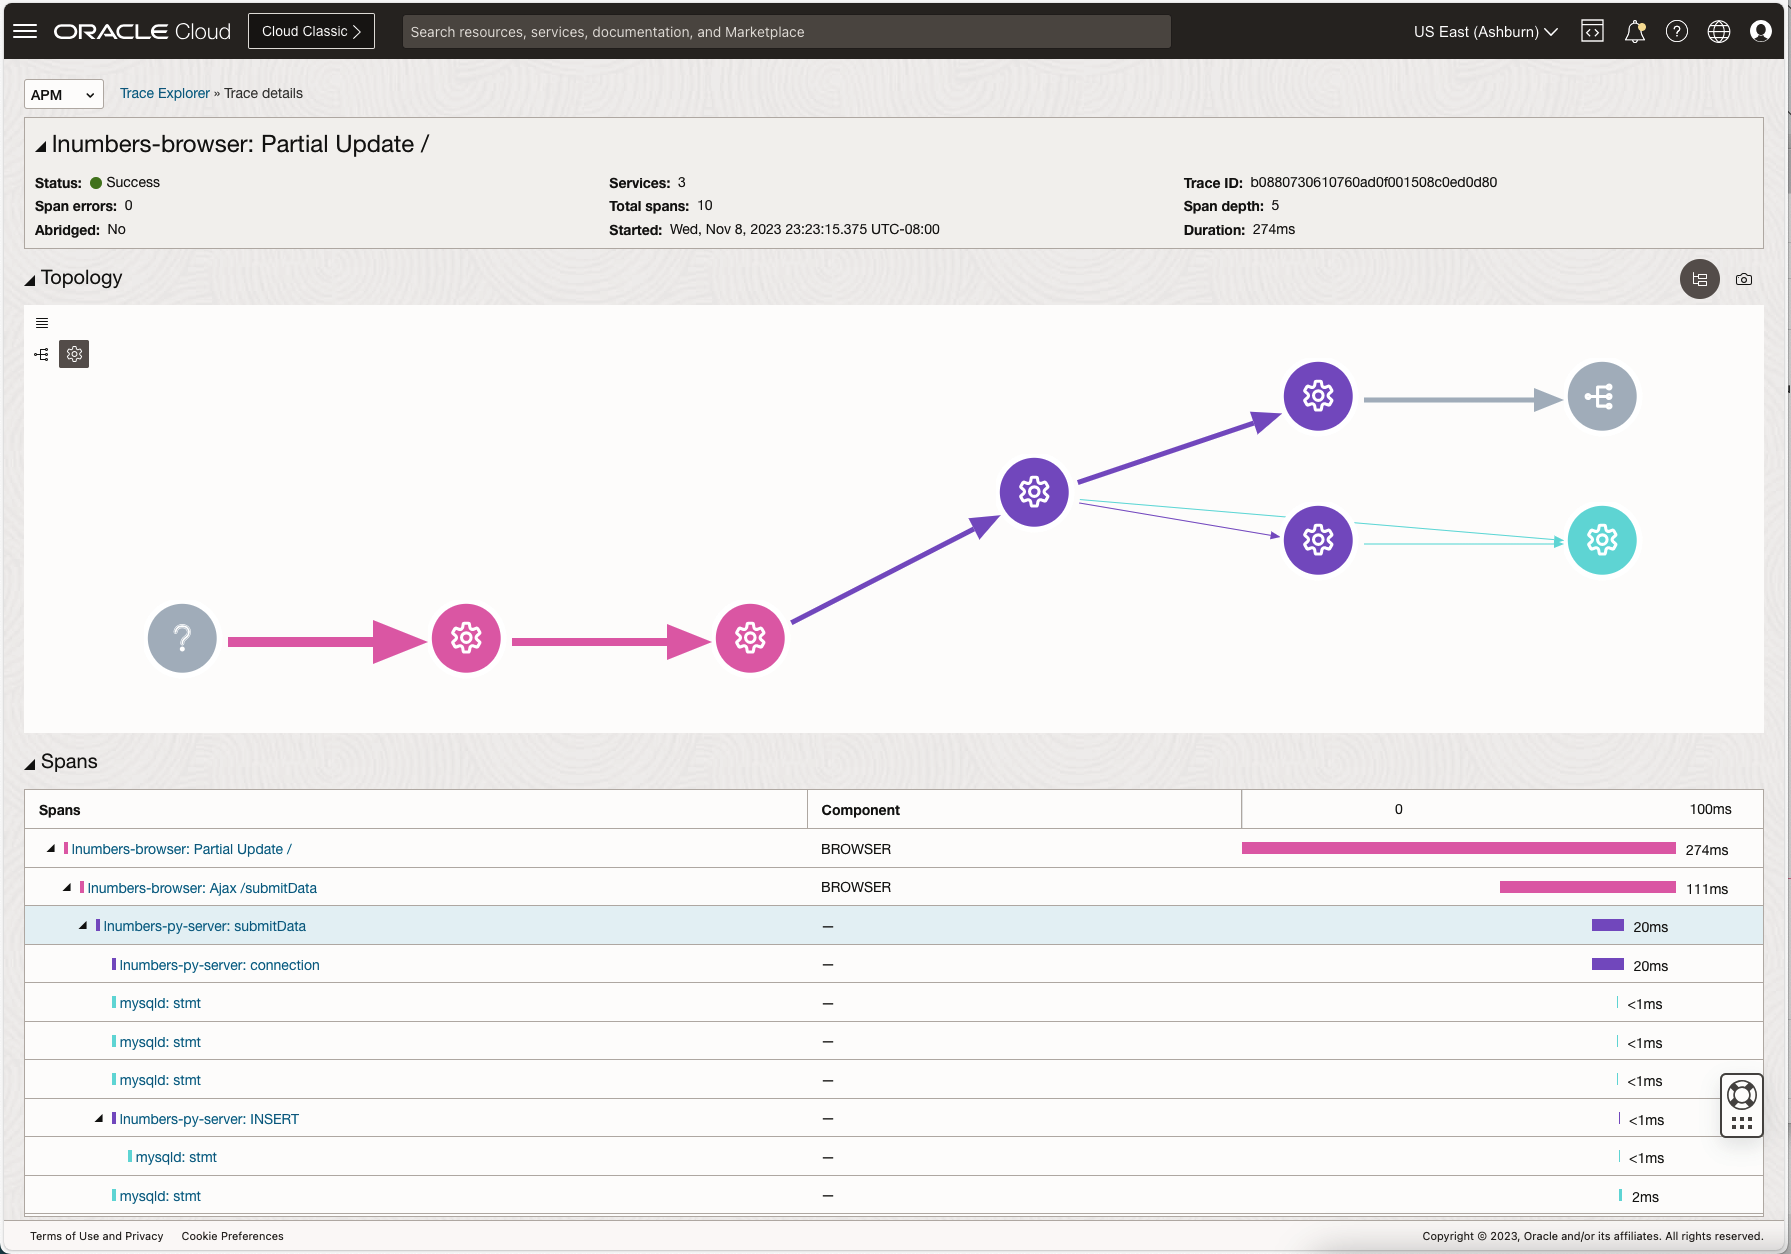
5. Observe traces in OCI APM console
Go to the OCI APM console and select your domain to review traces sent by your applications, MySQL connectors/clients, and MySQL server
6. Enable / Disable
Running Telemetry Traces is often something you enable to improve your ability to observe interactions. As with any addition there can be additional overhead.
There are various methods using the Otel collector to set sampling levels etc.
MySQL client
Can be enabled with a command line switch, –telemetry_client or from a configuration option, telemetry-client=ON |OFF
MySQL Server
You can toggle telemetry to be on or off.
- set persist telemetry.trace_enabled=’OFF’;
- set persist telemetry.trace_enabled=’ON’;
Connectors
Each connector can be enabled/disabled via their Otel language specific library.
7. Uninstall
To uninstall the telemetry component within the mysql server:
Analyze
Now you can use the OCI APM Console to troubleshoot your application stack all the way from the application to the mysql database.
Summary
Observability is a key to successfully running a complex distributed system. Using OCI APM and MySQL telemetry tracing allows you to integrate your MySQL database instances providing a high level of observability across your application stacks.
Additional Resources
As always, thank you for using MySQL.