Overview
OpenTelemetry Metrics provided by MySQL Telemetry provides insight into the performance, behavior, and health of your MySQL database. By exposing up to 400 unique MySQL internal metrics users can better –
- Assess resource utilization
- Identify bottlenecks
- Monitoring
- Detect and troubleshoot issues
- Track performance indicators
- Capacity planning
- Alerting
- And other insights
This is especially true at scale when 10s to 1000s of MySQL Databases are deployed across many data centers. And from a security standpoint, no special privileged account is required to connect and poll and send information, the Otel model is instead a secure push model. Building on open standards, MySQL uses the Cloud Native Compute foundation OpenTelemetry Protocol (OTLP).
Once configured within the MySQL Server, metrics are streamed using OpenTelemetry OTLP protocol to export metrics data into products designed to collect, process, alert and visualize these metrics. These raw measurements are captured inside MySQL efficiently and in real-time. Using OpenTelemetry also allows metrics and traces to be correlated. Many tools and applications natively support OpenTelemetry.
Metrics
MySQL Telemetry metrics include meters, counters, and gauges all updating within the MySQL server. Here we will focus on demonstrating how to forward MySQL EE Telemetry data to the OCI Metrics Explorer using the OpenTelemetry OTLP protocol. The Metrics Explorer is part of the OCI Observability and Monitoring suite of products and integrated with various O&M products.
Now that I have provided a brief introduction, lets go through the steps to export data into OCI Metrics Explorer
How To
Step 1 – Define a Domain in O&M
An APM “Telemetry” domain defines a group of systems being monitored. In the case of MySQL both OpenTelemetry Traces and Metrics would typically be sent to the same domain for a given group of servers or services.
Creating a Domain is simple
To create an APM domain in the Oracle Cloud Infrastructure console
- Sign in to the Oracle Cloud Infrastructure console.
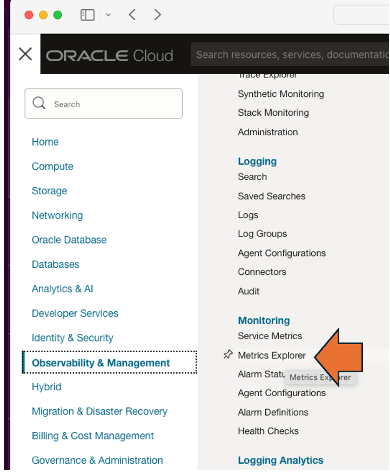
- Open the navigation menu, click Observability & Management. Under Application Performance Monitoring, click Administration.
- On the Administration page, in the left pane, select the compartment in which you want to create the APM domain.
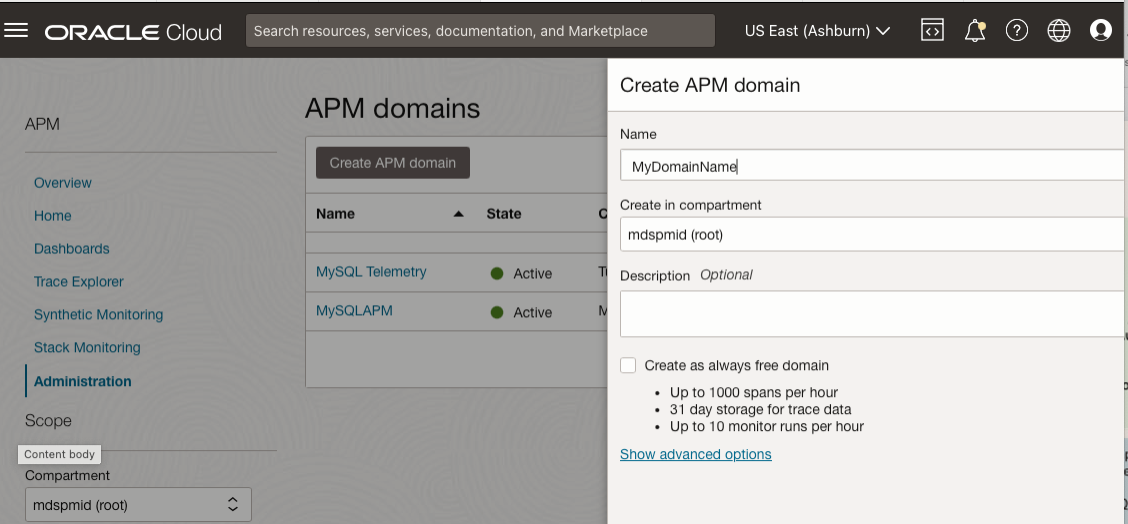
- On the APM Domains page, click Create APM Domain.
- Enter the required details in the Create APM Domain dialog box:
- Enter a name for the APM domain in the Name field.
- Select the compartment in the Create in Compartment field.
- Enter a description for the APM domain in the Description field.
- Optionally, check the Create as Free Tier Domain check box to create a free domain. If box is left unchecked, the domain will be created as a paid domain.
- Click on the Show Advanced Options if you want to specify tags
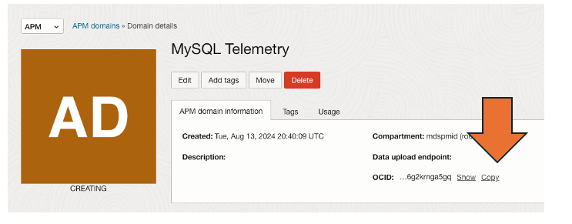
Next you will need 2 setting from the domain
- The Endpoint
- The Private Key for that endpoint
You will need these 2 values to configure MySQL Telemetry to push data to this domain.
First copy the Data upload endpoint
Next copy the Private Key to that endpoint
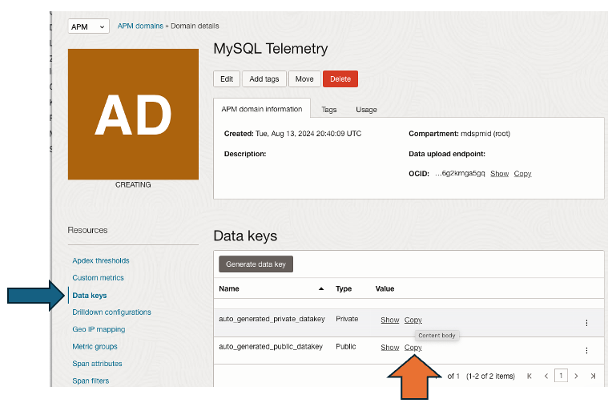
That’s all you need to do for now. Super simple.
Step 2 – MySQL Telemetry Component Installation and Configuration
You’ll need to be running one of the following versions
MySQL Enterprise Edition versions 8.4 LTS or 9 Innovation.
Connect to your MySQL Server using the classic protocol. Below I demonstrate using MySQL Shell.
% mysqlsh
MySQL Shell 8.4.1-commercial
Copyright (c) 2016, 2024, Oracle and/or its affiliates.
Oracle is a registered trademark of Oracle Corporation and/or its affiliates.
Other names may be trademarks of their respective owners.

Type '\help' or '\?' for help; '\quit' to exit.
> \c --mc root@localhost
Creating a Classic session to 'root@localhost'
> select @@version;
># Is the version correct?
> select * from mysql.component;
># Did you install the telemetry component already
># if not install the telemetry component
> install component 'file://component_telemetry';
> # Now lets look at the variables for telemetry
>  show variables like '%telemetry%';
+----------------------------------------------------------+----------------------------------+
| Variable_name                                            | Value                            |
+----------------------------------------------------------+----------------------------------+
| telemetry.metrics_enabled                                | ON                               |
| telemetry.metrics_reader_frequency_1                     | 10                               |
| telemetry.metrics_reader_frequency_2                     | 60                               |
| telemetry.metrics_reader_frequency_3                     | 0                                |
| telemetry.otel_bsp_max_export_batch_size                 | 512                              |
| telemetry.otel_bsp_max_queue_size                        | 2048                             |
| telemetry.otel_bsp_schedule_delay                        | 5000                             |
| telemetry.otel_exporter_otlp_metrics_certificates        |                                  |
| telemetry.otel_exporter_otlp_metrics_cipher              |                                  |
| telemetry.otel_exporter_otlp_metrics_cipher_suite        |                                  |
| telemetry.otel_exporter_otlp_metrics_client_certificates |                                  |
| telemetry.otel_exporter_otlp_metrics_client_key          |                                  |
| telemetry.otel_exporter_otlp_metrics_compression         | none                             |
# telemetry.otel_exporter_otlp_metrics_endpoint            | http://localhost:4318/v1/metrics |
# telemetry.otel_exporter_otlp_metrics_headers             |                                  |
| telemetry.otel_exporter_otlp_metrics_max_tls             |                                  |
| telemetry.otel_exporter_otlp_metrics_min_tls             |                                  |
| telemetry.otel_exporter_otlp_metrics_protocol            | http/protobuf                    |
| telemetry.otel_exporter_otlp_metrics_timeout             | 10000                            |
| telemetry.otel_exporter_otlp_traces_certificates         |                                  |
| telemetry.otel_exporter_otlp_traces_cipher               |                                  |
| telemetry.otel_exporter_otlp_traces_cipher_suite         |                                  |
| telemetry.otel_exporter_otlp_traces_client_certificates  |                                  |
| telemetry.otel_exporter_otlp_traces_client_key           |                                  |
| telemetry.otel_exporter_otlp_traces_compression          | none                             |
| telemetry.otel_exporter_otlp_traces_endpoint             | http://localhost:4318/v1/traces  |
| telemetry.otel_exporter_otlp_traces_headers              |                                  |
| telemetry.otel_exporter_otlp_traces_max_tls              |                                  |
| telemetry.otel_exporter_otlp_traces_min_tls              |                                  |
| telemetry.otel_exporter_otlp_traces_protocol             | http/protobuf                    |
| telemetry.otel_exporter_otlp_traces_timeout              | 10000                            |
| telemetry.otel_log_level                                 | info                             |
| telemetry.otel_resource_attributes                       |                                  |
| telemetry.query_text_enabled                             | ON                               |
| telemetry.trace_enabled                                  | ON                               |
+----------------------------------------------------------+----------------------------------+
35 rows in set (0.0051 sec)
The first two values (marked with # above) will get reset to values for the Telemetry Domain we defined in our first step. By default at install time these point to a local collector. In our case we will change to point directly to our Data domain upload endpoint and use the associated private key.
telemetry.otel_exporter_otlp_metrics_endpoint            | http://localhost:4318/v1/metrics |
telemetry.otel_exporter_otlp_metrics_headers
We change this by calling the set persist command and replacing
with the value of our endpoint as well as the format string
# It will look something like this
> set persist_only telemetry.otel_exporter_otlp_metrics_endpoint="https://aaaade#######adj7e.apm-agt.us-ashburn-1.oci.oraclecloud.com /20200101/opentelemetry/v1/metrics"
#next we set the private key
> set persist_only telemetry.otel_exporter_otlp_metrics_headers=”EAFD2HXSK6ENKJJBUTCHBFNRGFFCZSMF”
# If you show variables again you will see you have set them up
show variables like '%telemetry%metrics%';
> quit
Now you need to restart the server for these persist_only variables to become enabled.
Check out the error log on restart to see if there are any issues when the telemetry component connects to the upload endpoint.
If you do have errors – consider the following
- You did something wrong in the configuration
- Its being blocked by selinux
- Its being blocked by a firewall
- Other networking issues
For linux’s running selinux you may need to add the port for our endpoint – in this case 443. In other cases it might be a different port – for example 4318 is common
#shows ports allowed
semanage port -l | grep mysql
# add port(s)
sudo semanage port -a -t mysqld_port_t -p tcp 443
For linux’s running AppArmor – similar requirements apply – the port needs to be allowed.
Step 3 – Use the Metrics Explorer to view your MySQL Metrics
By now you have installed, configured, and taken care of network settings. Your mysqld error log should not show any telemetry component errors on startup at this point.
We can now have a look at the metrics data that’s been collected.
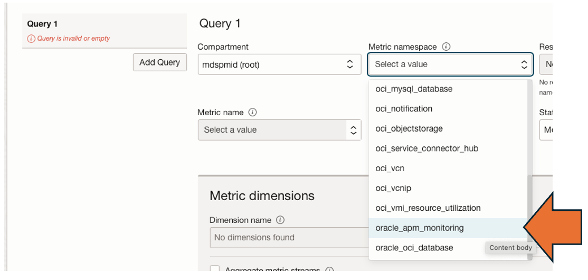
Scroll down and for Metric namespace – select the oci_apm_monitoring
From there select a Metric name to query, below looks at the create_table counter, then define the Statistic function, followed by clicking on Update Chart
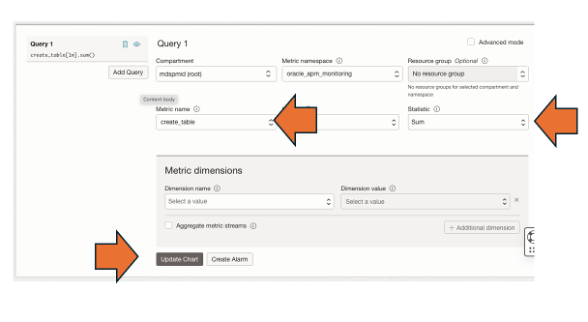
Update generates your graph
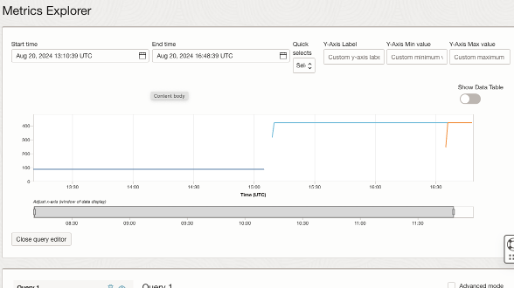
Mission accomplished.
Next Steps to consider are the following
Configure meter groups – which groups are enabled or disabled and set the frequency for the specific groups
- https://dev.mysql.com/doc/refman/8.4/en/telemetry-metrics-meters.html
And defining the frequency for metrics export via OTLP
- https://dev.mysql.com/doc/refman/9.0/en/telemetry-metrics-configuration.html
For example, set how frequently to emit metrics via OTLP using
- telemetry.metrics_reader_frequency_1
- telemetry.metrics_reader_frequency_2
- telemetry.metrics_reader_frequency_3
Finally
- Create reports, alerts and dashboards within OCI Observability and Monitoring
- You can even enable machine learning-based anomaly detection on custom Metrics Groups.
OCI Monitoring makes it easy to export metrics
- https://blogs.oracle.com/cloud-infrastructure/post/oci-monitoring-makes-it-easy-to-export-metrics
There are many capabilities in OCI Application Performance Monitoring
- https://blogs.oracle.com/observability/post/new-capabilities-apm-jan-feb-2022
For more blogs on Oracle APM, visit the Observability and Management – Application Performance Monitoring blog space.
As always, thank you for using MySQL!