As organizations modernize their data platforms, MySQL HeatWave has emerged as a powerful solution for running online transactional processing (OLTP) and real-time online analytics processing (OLAP) together without ETL complexity. However, achieving optimal performance and cost efficiency requires thoughtful capacity planning.
This blog explains how to monitor and estimate MySQL HeatWave capacity using SQL queries, workload analysis, and operational best practices.
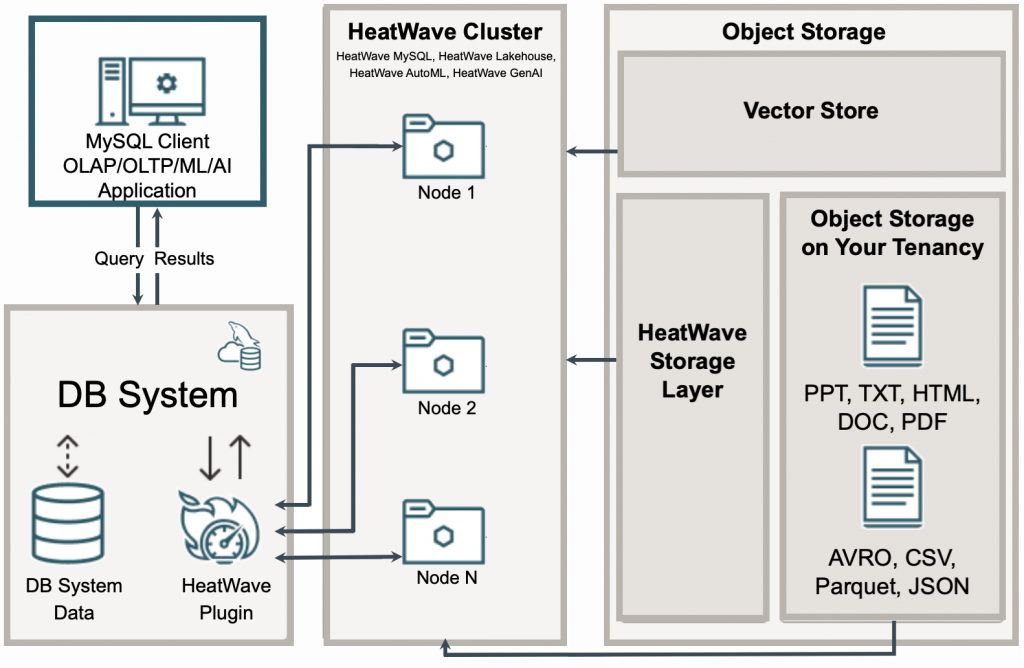
MySQL HeatWave Architecture
Why is capacity planning important?
MySQL HeatWave is designed for high-performance mixed OLTP & OLAP workloads, but its effectiveness depends heavily on having the right amount of resources allocated to the workload, such as CPU, memory, database storage, storage I/O, network bandwidth, Redo logs, buffer pool and HeatWave Cluster nodes.
Capacity planning is one of the most critical activities when deploying and operating database systems. Without proper planning, organizations can face performance bottlenecks, excessive infrastructure costs, unstable workloads, and poor user experience.
Some common risks associated with poor capacity planning include:
- Under-size causes performance degradation
- Over-size causes excessive cloud costs
- No growth forecasting results in emergency scaling
- Poor workload analysis leads to inefficient resource use
- Ignoring concurrency results in system instability
Key capacity planning dimensions for OLTP workloads
Capacity planning for MySQL HeatWave OLTP environments is very different from analytics-only sizing.
OLTP systems normally prioritize the following dimensions:
- Low latency
- High concurrency
- Fast commits
- Predictable response times
- Transaction consistency
1. Understand the data growth rate
Data growth planning is essential to ensure the stability of a database system. It affects directly on increasing demands for storage, memory, backup size, recovery times, and replication overhead.
To continuously monitor MySQL HeatWave database growth, you can schedule periodic queries using:
- MySQL event scheduler
- OCI monitoring integrations
- External schedulers
A common and practical approach is to store periodic database size snapshots into a monitoring table.
-- create a capacity monitoring database
CREATE DATABASE IF NOT EXISTS capacity_monitoring;

-- create a table for historical growth tracking
CREATE TABLE capacity_monitoring.database_growth_history (
    id BIGINT AUTO_INCREMENT PRIMARY KEY,
    snapshot_time TIMESTAMP DEFAULT CURRENT_TIMESTAMP,
    database_name VARCHAR(128),
    total_size_gb DECIMAL(10,2),
    data_size_gb DECIMAL(10,2),
    index_size_gb DECIMAL(10,2)
);

-- use the query to capture the current size of all databases
INSERT INTO capacity_monitoring.database_growth_history (
    database_name,
    total_size_gb,
    data_size_gb,
    index_size_gb
)
SELECT table_schema AS database_name,
    ROUND(SUM(data_length + index_length)/1024/1024/1024,2) AS total_size_gb,
    ROUND(SUM(data_length)/1024/1024/1024,2) AS data_size_gb,
    ROUND(SUM(index_length)/1024/1024/1024,2) AS index_size_gb
FROM information_schema.tables
GROUP BY table_schema;

-- enable MySQL event scheduler if not set to "ON" already
SHOW VARIABLES LIKE 'event_scheduler';
SET GLOBAL event_scheduler = ON;

-- schedule automatic collection every hour
CREATE EVENT monitor_database_growth
ON SCHEDULE EVERY 1 HOUR
DO
INSERT INTO capacity_monitoring.database_growth_history (
    database_name,
    total_size_gb,
    data_size_gb,
    index_size_gb
)
SELECT table_schema,
    ROUND(SUM(data_length + index_length)/1024/1024/1024,2),
    ROUND(SUM(data_length)/1024/1024/1024,2),
    ROUND(SUM(index_length)/1024/1024/1024,2)
FROM information_schema.tables
GROUP BY table_schema;

-- query historical growth trends
SELECT DATE(snapshot_time) AS snapshot_date,
    database_name,
    MAX(total_size_gb) AS size_gb
FROM capacity_monitoring.database_growth_history
GROUP BY DATE(snapshot_time), database_name
ORDER BY snapshot_date DESC;

-- calculate monthly growth rate
SELECT database_name,
    MIN(total_size_gb) AS initial_size_gb,
    MAX(total_size_gb) AS latest_size_gb,
    ROUND(
        ((MAX(total_size_gb) - MIN(total_size_gb))
        / MIN(total_size_gb)) * 100,2
    ) AS growth_percent
FROM capacity_monitoring.database_growth_history
WHERE snapshot_time >= NOW() - INTERVAL 30 DAY
GROUP BY database_name;

-- identify fastest growing databases
SELECT database_name,
    ROUND(MAX(total_size_gb) - MIN(total_size_gb),2) AS growth_gb
FROM capacity_monitoring.database_growth_history
WHERE snapshot_time >= NOW() - INTERVAL 7 DAY
GROUP BY database_name
ORDER BY growth_gb DESC;
For large production environments, it is also important to monitor the growth and utilization of large tables individually:
-- schedule table growth collection
CREATE TABLE capacity_monitoring.table_growth_history (
    snapshot_time TIMESTAMP DEFAULT CURRENT_TIMESTAMP,
    table_schema VARCHAR(128),
    table_name VARCHAR(128),
    total_size_gb DECIMAL(10,2)
);

INSERT INTO capacity_monitoring.table_growth_history (
    table_schema,
    table_name,
    total_size_gb
)
SELECT table_schema,
    table_name,
    ROUND((data_length + index_length)/1024/1024/1024,2)
FROM information_schema.tables;
2. Understand the CPU utilization
MySQL OLTP workloads are often CPU-sensitive due to query parsing, transaction processing, lock management, connection handling, etc.
-- find out cpu-heave queries
SELECT DIGEST_TEXT,
    COUNT_STAR,
    ROUND(SUM_TIMER_WAIT/1000000000000,2) AS total_exec_sec
FROM performance_schema.events_statements_summary_by_digest
ORDER BY SUM_TIMER_WAIT DESC
LIMIT 15;
Here are some of the possible causes for common symptoms:
- High CPU is possibly caused by too many concurrent queries
- CPU spikes is related to poor indexing
- Uneven CPU is likely caused by hot partitions
3. Understand storage IOPS and throughput
MySQL OLTP workloads continuously generate I/O activities through transaction commits, redo log writes, random reads, index updates, replication logging, temporary table creation, backup operations, etc.
Properly sizing storage is crucial, especially in high-throughput production environments, since storage bottlenecks can cause:
- Increased transaction commit latency
- Reduced transactions per second (TPS)
- Increased disk I/O wait time and deadlocks
- Buffer pool miss penalites
- Replication lag
- Slow temporary table operations
-- I/O waiting monitoring
SELECT EVENT_NAME,
    COUNT_STAR,
    SUM_TIMER_WAIT
FROM performance_schema.file_summary_by_event_name
ORDER BY SUM_TIMER_WAIT DESC;

-- buffer pool efficiency monitoring
SHOW GLOBAL STATUS LIKE 'Innodb_buffer_pool_read%';

-- lock wait monitoring
SELECT * FROM performance_schema.data_lock_waits;
Key capacity planning dimensions for OLAP workloads
1. Monitor HeatWave cluster status
Operational monitoring is essential after deploying a MySQL HeatWave cluster because it helps identify hot nodes, workload imbalance, CPU saturation, and potential memory exhaustion before they impact query performance.
Uneven node utilization often indicates poor partitioning strategies, uneven data distribution, or skewed joins that can slow distributed query execution and reduce cluster efficiency.
-- monitor HeatWave cluster utilization
SELECT * FROM performance_schema.rpd_nodes;
Monitoring HeatWave table load status is equally important. If tables fail to load completely into HeatWave memory, it may indicate insufficient memory allocation, undersized cluster configuration, or inaccurate compression ratio assumptions during capacity planning.
-- monitor HeatWave table load status
SELECT ID, LOAD_STATUS, LOAD_PROGRESS FROM performance_schema.rpd_tables;
Memory is the most critical resource for OLAP workloads in HeatWave, proper memory sizing directly impacts query acceleration, scalability, and overall analytical performance.
-- monitor HeatWave memory utilization
SHOW STATUS LIKE 'rapid%';
2. Identify large analytical tables
Most analytical workloads focus on a few large tables. The ideal HeatWave candidates participate in massive aggregations, require full scans, and support reporting dashboards.
-- query to identify large tables
SELECT table_schema,
    table_name,
    engine,
    table_rows,
    ROUND(data_length/1024/1024/1024,2) AS data_gb,
    ROUND(index_length/1024/1024/1024,2) AS index_gb,
    ROUND((data_length+index_length)/1024/1024/1024,2) AS total_gb
FROM information_schema.tables
ORDER BY total_gb DESC
LIMIT 25;

-- detect full tables scans
SELECT object_schema,
    object_name,
    count_read,
    count_write
FROM performance_schema.table_io_waits_summary_by_table
ORDER BY count_read DESC
LIMIT 20;

-- identify top CPU-consuming queries
SELECT DIGEST_TEXT,
    COUNT_STAR,
    ROUND(SUM_TIMER_WAIT/1000000000000,2) AS total_exec_sec,
    ROUND(AVG_TIMER_WAIT/1000000,2) AS avg_exec_ms,
    SUM_ROWS_EXAMINED,
    SUM_ROWS_SENT
FROM performance_schema.events_statements_summary_by_digest
ORDER BY SUM_TIMER_WAIT DESC
LIMIT 15 \G
3. Identify slow queries
HeatWave cluster should target your most expensive queries. With HeatWave query accelerator, it enables in-memory parallel aggregation, vectorized execution and massive accleration.
SELECT start_time,
    query_time,
    rows_examined,
    rows_sent,
    sql_text
FROM mysql.slow_log
ORDER BY query_time DESC
LIMIT 20;
Summary
Effective capacity planning is critical for MySQL HeatWave environments supporting both OLTP and OLAP workloads. OLTP capacity planning focuses on transaction throughput, concurrency, storage IOPS, low-latency commits, and operational stability, while OLAP capacity planning focuses on HeatWave cluster memory sizing, distributed query execution, scan performance, and balanced node utilization.
Continuous monitoring of CPU usage, memory consumption, storage performance, query patterns, data growth, and HeatWave cluster utilization helps identify bottlenecks early, prevent resource saturation, optimize workload distribution, and ensure predictable performance and scalability as workloads grow.