Announcing MySQL HeatWave Telemetry data publishing into OCI Log Analytics — the easiest way to view , analyze the MYSQL Heatwave Logs
New build-in feature to publish the MySQL Logs to OCI Log Analytics
Telemetry Data: The Following data will be published based on the user selection
1. Error log: Contains a record of mysqld startup and shutdown times. It also contains diagnostic messages such as errors, warnings, and notes that occur during server startup and shutdown, and while the server is running
2. Slow query log: Consists of SQL statements that take more than long_query_time seconds to execute and require at least min_examined_row_limit rows to be examined. The slow query log can be used to find queries that take a long time to execute and are therefore candidates for optimization.
3. Audit log: Contains client connection and disconnect details, and what actions they perform while connected, such as which databases and tables they access.
4. General log: A general record of what mysqld is doing. The server writes information to this log when clients connect or disconnect and logs each SQL statement received from clients.
Purpose
- To Provide a Centralized MySQL Heatwave Telemetry data including error log, slow query log, general lot and Audit Log with OCI Log Analytics
- Collect, parse, and analyze MySQL logs to accelerate troubleshooting and improve operational visibility
- Log Analytics as the primary, next-generation observability experience (logs + advanced analysis)
- Prebuilt dashboards (including dashboards aligned to MySQL HeatWave log types) to speed onboarding and day-1 visibility
Audience:
DBAs, SRE/Ops, Cloud administrators running MySQL HeatWave Databases
Use Cases
• Faster root-cause analysis
• Slow query investigations
• Error trend tracking
• Security/audit visibility
• Monitor General DB activities
Solution
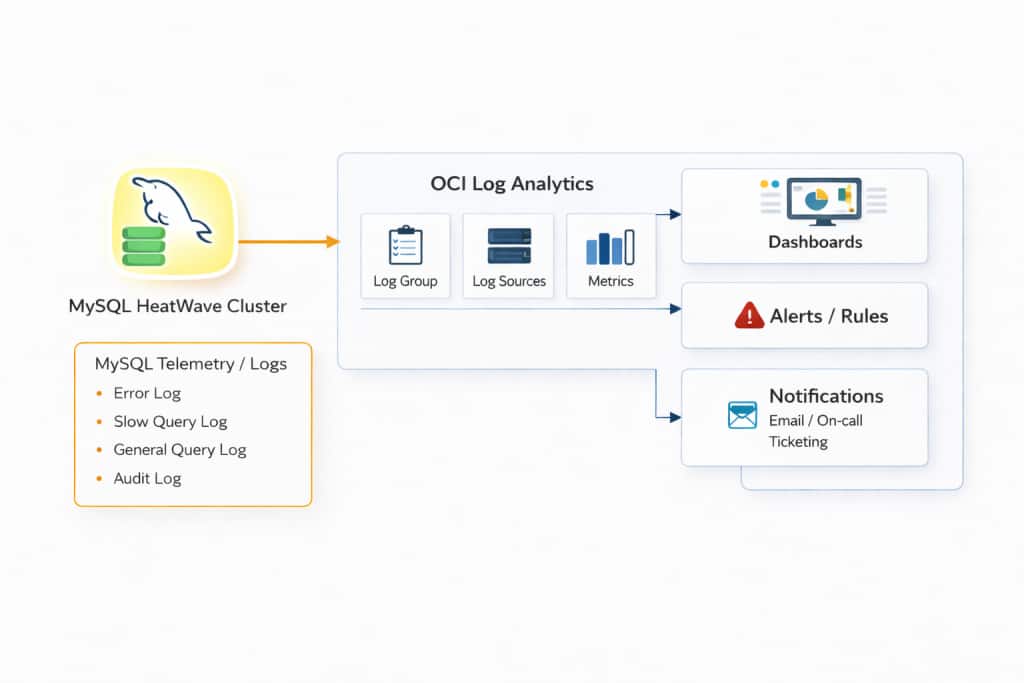
This solution establishes an end-to-end observability pipeline that continuously collects MySQL Logs generated by MySQL Heatwave such as error and performance-related logs as well as Audit logs —then ingests it into OCI Log Analytics for centralized analysis. Once the data lands in Log Analytics, it is organized using log groups, parsed and enriched via log sources, and associated to the right entities (for example, the specific MySQL HeatWave DB system and environment) so teams can filter and correlate events quickly. With this foundation in place, DBAs and operations teams can run fast searches during incidents, build dashboards to track trends like error spikes or slow-query patterns, and configure alerts to notify the right responders when behavior deviates from normal. Also enables easy way for MySQL Audit logs data for compliance requirements.
Architecture Overview
Next Steps : Stay tuned for an upcoming deep-dive blog on “How to setup MySQL Telemetry/Logs on MySQL Heatwave Service and exploring data on OCI Log Analytics.”
Helpful links
- OCI MySQL Heatwave Documentation: https://docs.oracle.com/en-us/iaas/mysql-database/doc/mysql-telemetry-and-oci-log-analytics.html
- Reference Blogs : https://blogs.oracle.com/mysql/mysql-heatwave-observability-updates-in-oci