
Approvals are where automation meets accountability. When a purchase order is held for sign-off, an expense is rejected, or an AI agent pauses to ask a person before it acts, somebody will eventually ask: who approved this, when, and why? Sometimes that question comes a week later. Sometimes it comes from an auditor eighteen months later.
With 26.10, Human in the Loop (HITL) in Oracle Integration can now publish its activity stream to OCI Log Analytics. Every workflow and task state change becomes a structured log record that you can retain for as long as your compliance policy requires, query with the full Log Analytics query language, and monitor through a pre-built Oracle Integration: HITL dashboard.
This post is a deep dive into that feature: why it matters, how to set it up, how to search the logs, and what the dashboards give you out of the box. If you want the full picture of everything in 26.10, start with Niall’s What’s New in Oracle Integration 26.10.
Why you should care
1. Durable retention for audit and compliance
HITL runtime data lives inside Oracle Integration and follows the instance’s data retention setting. By default that is 32 days for Standard and Enterprise edition instances (184 days for Healthcare edition), and only Enterprise edition can raise it — to a maximum of six months. The clock starts when a workflow reaches a terminal state: active workflows are never purged, but once an instance is Completed, Faulted, Expired or Terminated, it and all of its task history are deleted after the retention period elapses.
For day-to-day operations that is plenty. For audit trails it usually is not. Financial approvals, HR decisions, and regulated processes routinely need to be reconstructible years after the fact, long after the workflow itself has been purged.
Log Analytics closes that gap. Once publishing is enabled, each HITL event is pushed to a log group that you own, in your tenancy, with the retention period you configure. The data outlives the workflow instance, and it lives alongside the rest of your OCI observability data rather than in a silo.
2. Understand how your approval operations actually run
Retention is the compliance story. The more interesting story is operational. Because every state change is logged with a rich set of fields — workflow, task, assignee, approver, outcome, duration, due date, priority — you can finally answer questions like:
- How many tasks are open right now, and who are they sitting with?
- Which workflows generate the most approval demand?
- What’s the average time from task creation to completion, per workflow?
- How often do approvers reject versus approve, and what comments do they leave?
- Which instances faulted or expired, and where?
These are the questions that operations teams and business process owners ask, and 26.10 ships a dashboard that answers most of them without writing a single query.
What gets logged
An activity stream record is generated for each state change of a workflow and its components:
| Component | State changes logged |
|---|---|
| Workflow | Created, Completed, Faulted, Expired |
| Start Event | Created, Completed |
| Task | Created, Unassigned, Assigned, Withdrawn, Completed |
| End Event | Created, Completed |
| If Else | Created, Completed |
Each record is published as JSON and parsed by a predefined Log Analytics parser into named fields. So a single purchase order approval that is created, assigned to a group, claimed by an approver, and completed with an “Approve” outcome produces a clean, timestamped sequence of records — a complete narrative of that approval, retained for as long as you want.
Setting it up
Publishing HITL logs is enabled per Oracle Integration instance from the OCI Console. It builds on the existing option to publish Oracle Integration activity stream logs to Log Analytics — that has to be enabled first — but HITL gets its own toggle and its own log group. The full procedure is documented in Publish Human in the Loop Logs to Oracle Log Analytics in Provisioning and Administering Oracle Integration 3 but here is the shape of it:
Step 1 — Create a log group in Log Analytics
In the OCI Console, go to Observability & Management → Log Analytics → Administration → Log Groups and click Create Log Group. Pick the compartment where you want HITL logs to land, give the group a name and a description, and click Create. Use a separate log group from the one you use for Oracle Integration activity stream logs: the HITL records have a different format and their own parser, and keeping them apart makes both sets of logs easier to query.
Once it’s created, open the log group and copy its OCID; you’ll need it in Step 3.
Step 2 — Grant Oracle Integration permission to upload logs
Oracle Integration authenticates to Log Analytics as a resource principal, so you need a dynamic group that identifies your instance and a policy that lets that dynamic group upload logs.
Find the Human in the Loop OCID. In the OCI Console, go to Developer Services → Application Integration → Integration and open your Oracle Integration instance. On the instance details page, scroll to the Human in the Loop section and copy the OCID. (You’ll also see an Identity application value there — that’s not the one you need for this step.)
Create (or edit) a dynamic group. Go to Identity & Security → Domains, open the identity domain your Oracle Integration instance belongs to, select the Dynamic groups tab and click Create dynamic group. Give it a name and description, and add a matching rule on the HITL OCID:
ALL {resource.id = '<HITL_OCID>'}If you’re new to dynamic groups, Managing Dynamic Groups in the OCI documentation covers the full procedure and rule syntax.
Create a policy that allows the dynamic group to upload to your log group. Go to Identity & Security → Policies, click Create Policy, give it a name and description, choose the compartment, and switch to the manual editor to add these three statements, where <dynamic_group> is the dynamic group you just created and <log_group_compartment> is the compartment holding the log group from Step 1. If your dynamic group lives in a non-default identity domain, reference it as '<domain>'/'<dynamic_group>'.
allow dynamic-group <dynamic_group> to {LOG_ANALYTICS_LOG_GROUP_UPLOAD_LOGS} in compartment <log_group_compartment>
allow dynamic-group <dynamic_group> to {LOG_ANALYTICS_SOURCE_READ} in tenancy
allow dynamic-group <dynamic_group> to use loganalytics-ondemand-upload in tenancy
The scopes differ on purpose. The first statement is scoped to the compartment because that’s where your log group lives, and it’s the only grant that needs to be that specific. The other two are tenancy-level because the resources they cover are tenancy-level: the pre-built HITL log source isn’t in any compartment, and the on-demand upload endpoint is a service-wide resource.
For the general procedure, see Managing Policies in the OCI documentation.
Step 3 — Enable publishing on your Oracle Integration instance
Open your Oracle Integration instance in the OCI Console (Developer Services → Application Integration → Integration → your instance) and scroll to the Settings panel.
There’s one prerequisite here: HITL publishing can only be enabled once Oracle Integration itself is publishing to Log Analytics. If the OCI Log Analytics row in Settings still says Not enabled, click Enable and provide a log group for the integration activity stream logs first.
With that in place, scroll to the OCI Log Analytics section, click Enable on the Human in the Loop row, and paste the HITL log group OCID from Step 1. When you’re done, the panel shows both publishers enabled, each with its own log group:
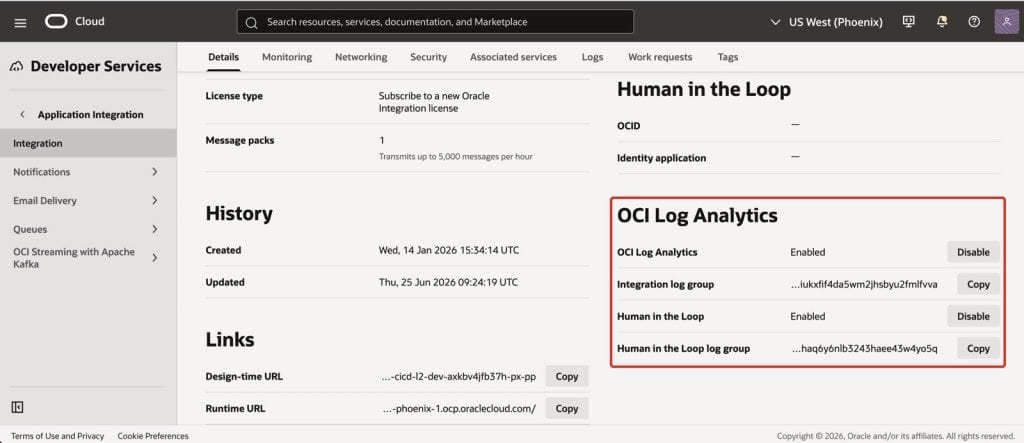
The instance details page with both publishers enabled — the OCI Log Analytics section is where all of this lives.
That’s it. From this point, every HITL state change in that instance flows to your log group. Note that if you later disable publishing and then re-enable it, you’ll be asked for the log group OCID again.
Exploring the logs in Log Explorer
Once records start arriving, head to Observability & Management → Log Analytics → Log Explorer. The default query groups records by log source, so if you’re also publishing integration activity stream logs you’ll see two entries side by side. The one you’re looking for is OCI Integration – HITL Activity Stream Logs.
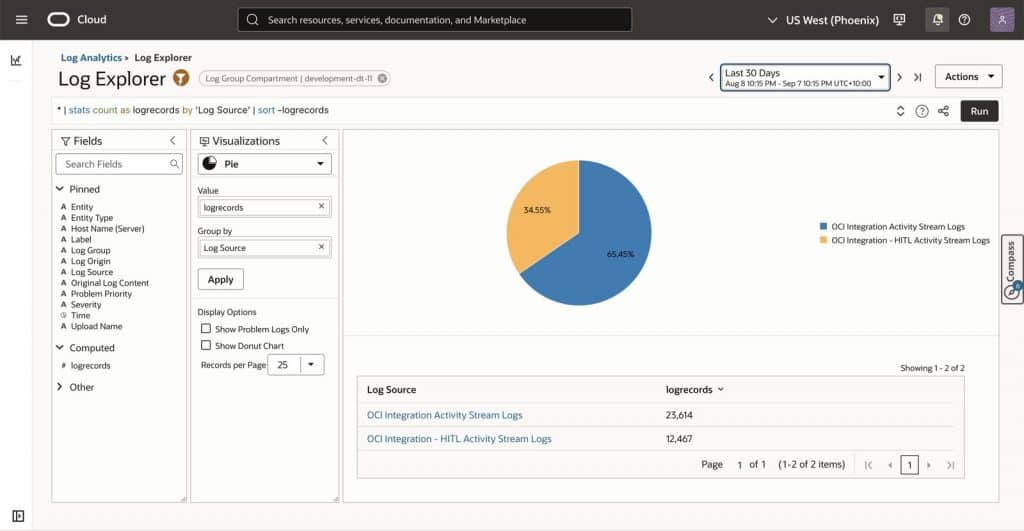
Integration and HITL logs show up as separate log sources in Log Explorer.
Right-click the log source and choose Drill down to see the individual records, with a histogram of volume over time above them. Each record is displayed in its original JSON.
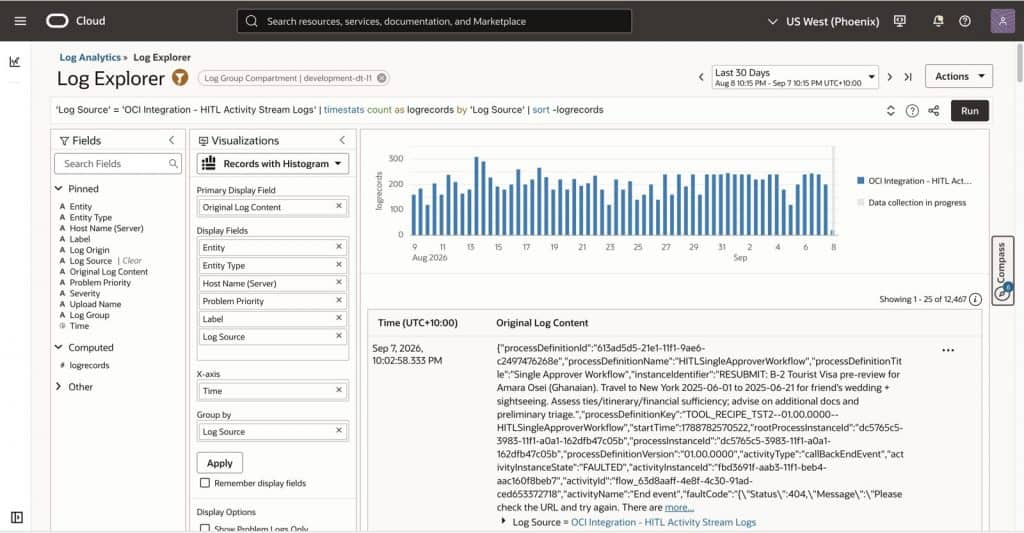
Drilled down into the HITL log source: one JSON record per state change.
Click more… on any record to open the full JSON in a dialog. Here’s a user task that was claimed and then completed with a REJECT outcome — the kind of record you’d want to be able to find a year from now:
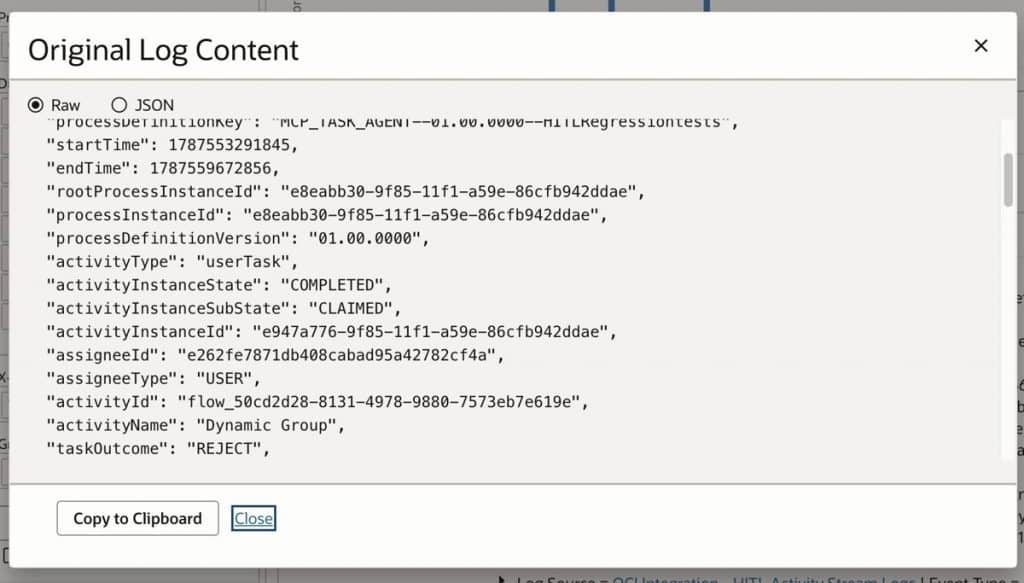
A completed user task record: state, sub-state, assignee and outcome are all right there.
Expand Log Source beneath a record to see how those JSON attributes have been parsed into Log Analytics fields.
Nothing to configure: the source and parser are Oracle-defined
If you’ve onboarded other logs into Log Analytics, you’ll know that the usual first job is teaching the service how to read them — defining a source that tells Log Analytics what the logs are and where they come from, and a parser that breaks each record into fields. For HITL you skip that step entirely. 26.10 ships an Oracle-defined source, OCI Integration – HITL Activity Stream Logs, and an Oracle-defined JSON parser, OCI Integration – HITL Activity Stream Log Format, that maps every attribute in the log record to a named Log Analytics field. Both appear under Log Analytics → Administration the moment you enable publishing.
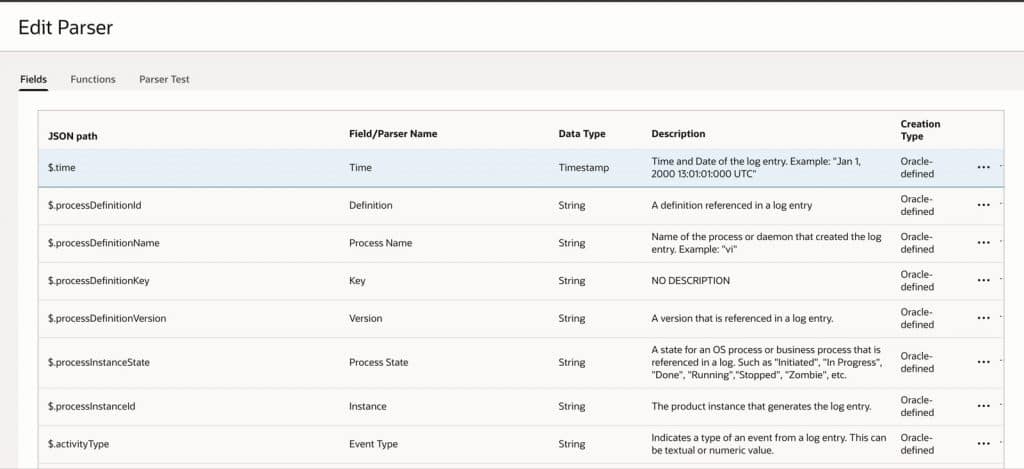
The Oracle-defined HITL parser: JSON path on the left, the Log Analytics field it becomes on the right.
You can inspect both, and if you need extra fields or enrichment you can duplicate and customize them, but out of the box the mapping is already done. For background on how sources and parsers work, see Log Analytics Terms and Concepts.
The fields you’ll actually use
The parser maps around 35 JSON attributes to Log Analytics fields. The full mapping is in the documentation; these are the ones most queries will lean on:
| Field | What it holds |
|---|---|
| Process Name / Version | Workflow name and version |
| Process State | Workflow instance state |
| Instance | Workflow instance GUID |
| Event Type / Event | Activity type (Task, StartEvent, …) and its name |
| Event State | Created, Assigned, Completed, and so on |
| Assignee / Assignee Type | Who currently holds the task, and whether that’s a user or group |
| Approver | Who actually acted on the task |
| Result | Task outcome: Approve, Reject, Submit |
| Comment | The approver’s comment |
| Duration / Event Duration | Time taken by the instance / the activity |
| Due Date / Task Priority | Task SLA and priority |
| Error ID | Fault code, if the activity faulted |
| Project ID | The Oracle Integration project that owns the workflow |
A few queries to get started
Values in the parsed fields follow the casing of the underlying JSON — activity types like userTask and startEvent, states like ASSIGNED and COMPLETED. If you’re unsure what’s in your data, this query lists every type/state combination you have:
'Log Source' = 'OCI Integration - HITL Activity Stream Logs'
| stats count by 'Event Type', 'Event State'
Open tasks by assignee — the “who is everything sitting with?”:
'Log Source' = 'OCI Integration - HITL Activity Stream Logs' and 'Event Type' = 'userTask' and 'Event State' = 'ASSIGNED'
| stats count by Assignee
| sort -Count
Every rejected task in the last 30 days, with the approver’s comment:
'Log Source' = 'OCI Integration - HITL Activity Stream Logs' and Result = 'REJECT'
| fields Time, 'Process Name', Event, Approver, Comment
Switch the visualization from Records with Histogram to Table and you get just those five columns representing a ready-made rejection report.
Average task completion time per workflow:
'Log Source' = 'OCI Integration - HITL Activity Stream Logs' and 'Event Type' = 'userTask' and 'Event State' = 'COMPLETED'
| stats avg('Event Duration') by 'Process Name'
Every faulted activity:
'Log Source' = 'OCI Integration - HITL Activity Stream Logs' and 'Error ID' != null
| fields Time, 'Process Name', Instance, Event, 'Error ID'
Here’s the assignee query with the visualization switched to a Pie chart — the same data, but now it’s obvious where the backlog is sitting:
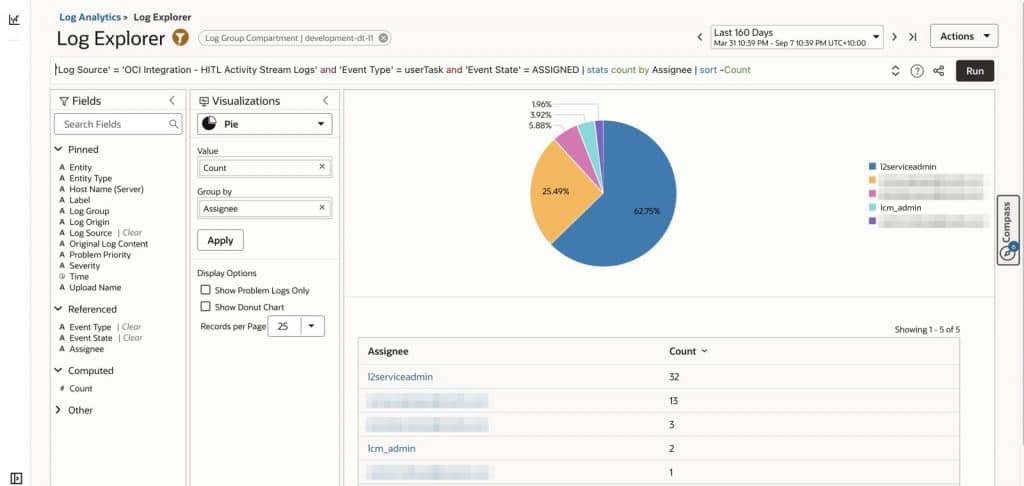
Open tasks by assignee. One approver holds nearly two-thirds of the queue.
From here you can save queries, pin fields, set alerts, and pull HITL records into the same dashboards you already use for the rest of your OCI estate. The Log Analytics query language reference covers the full command set.
The Oracle Integration HITL dashboard
A quick word on what that means, for anyone who hasn’t used Log Analytics dashboards before. A dashboard is a saved, shareable page of widgets, and each widget is a saved search: a Log Analytics query paired with a visualization — a pie, a bar chart, a time series, a table. That has a few consequences that matter here. The whole dashboard shares one time selector, so you look at the last 24 hours or the last 12 months by flipping one control. Every widget is live, so clicking on a slice or a bar opens Log Explorer with exactly that query, and you can keep drilling from there. And because widgets are just saved searches, you can reuse them: drop a HITL widget into a dashboard you already run, duplicate the whole dashboard and tailor it, or attach a scheduled task to a widget’s query to raise an alert when a threshold is crossed. Log Analytics already ships Oracle-defined dashboards for a range of services, including several for Oracle Integration itself; the Create Dashboards documentation covers the mechanics, and Niall has a good walkthrough of building OIC-specific ones in OCI Logging Analytics Dashboards for Oracle Integration.
To view the dashboard go to Observability & Management → Log Analytics → Dashboards and open it. You will notice that it has two tabs.
Workflow Instances tab
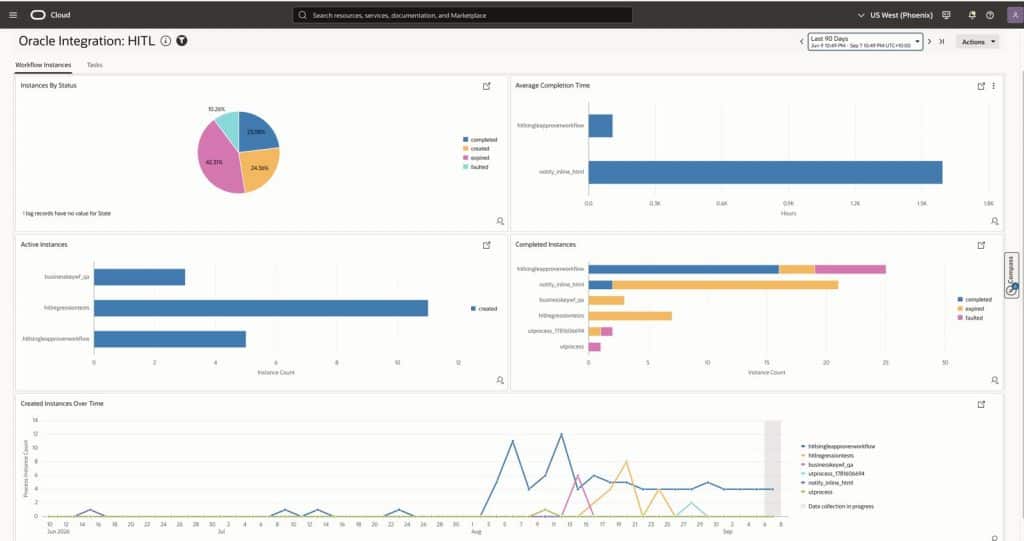
| Widget | What it shows |
|---|---|
| Instances By Status | Pie chart of workflow instances by runtime status: completed, created, expired, faulted |
| Average Completion Time | Average hours to completion, one bar per workflow |
| Active Instances | Count of instances currently in the created state, per workflow |
| Completed Instances | Completed instances per workflow, split into completed / expired / faulted |
| Created Instances Over Time | Time series of instances created by date and workflow |
This is the health view. A rising share of expired instances in the pie chart, or a workflow whose average completion time is drifting upward, is usually the first sign that approvals are backing up somewhere.
Tasks tab
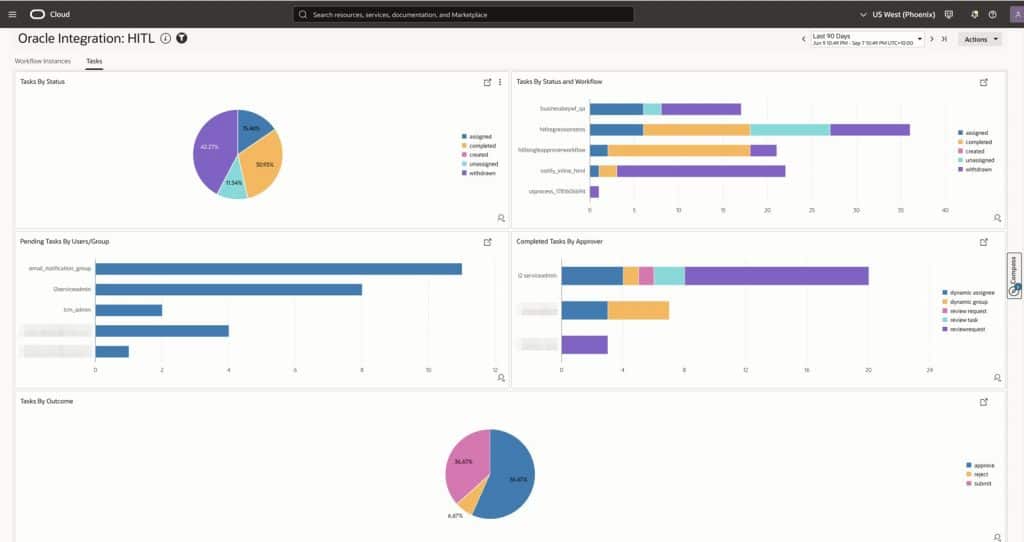
| Widget | What it shows |
|---|---|
| Tasks By Status | Pie chart of tasks by status: assigned, completed, created, unassigned, withdrawn |
| Tasks By Status and Workflow | Stacked bar per workflow showing the status mix |
| Pending Tasks By Users/Group | Pending workload per user or group |
| Completed Tasks By Approver | Completed tasks per approver, broken down by task type |
| Tasks By Outcome | Pie chart of approve / reject / submit outcomes |
This is the people view. Pending Tasks By Users/Group tells you who is the bottleneck; Completed Tasks By Approver tells you who is carrying the load; Tasks By Outcome tells you whether a workflow is a genuine decision point or a rubber stamp.
Click through to the records
Every widget is a live query. Click a slice or a bar — say, the assigned slice in Tasks By Status — and Log Explorer opens with exactly those records, ready to filter further.
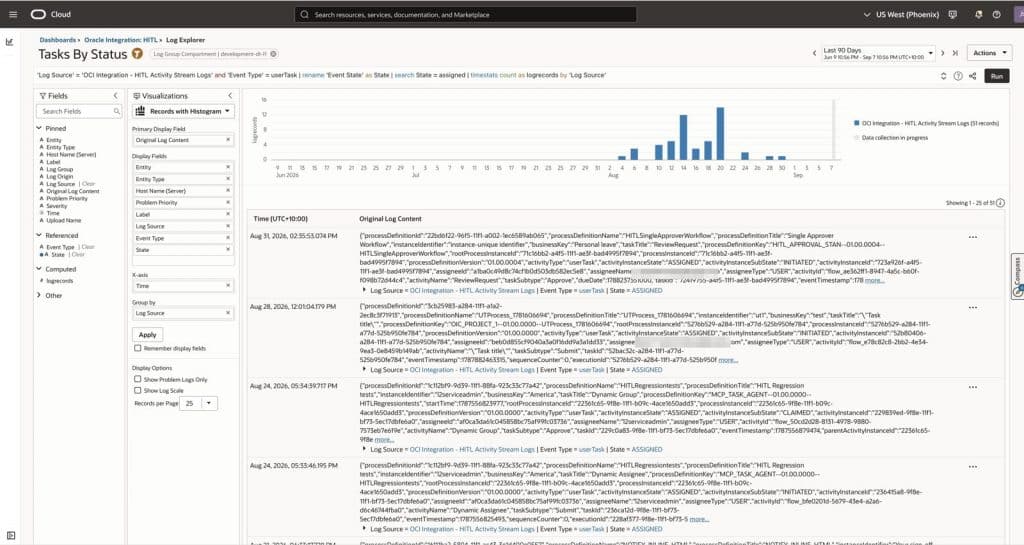
Clicking the “assigned” slice lands you in Log Explorer with the widget’s query already applied — note the breadcrumb.
Treat the widgets as a starting point rather than a ceiling: the queries behind them are yours to duplicate, adjust and alert on.
Recap
- HITL activity stream logs can now be published to OCI Log Analytics, giving you retention beyond the six-month platform limit for audit and compliance.
- Every workflow and task state change is captured as a structured, parsed record with ~35 fields covering the workflow, the task, the people involved, and the outcome.
- Setup is three steps: a log group, an IAM dynamic group and policy, and a toggle on your Oracle Integration instance.
- Log Explorer gives you full query access to the records
- The pre-built Oracle Integration: HITL dashboard gives operations and business owners instance health and task workload at a glance, with click-through to the underlying logs.
Long-term auditability and day-to-day operational visibility from the same data, with nothing to build. If you’re running approvals through Oracle Integration — or letting AI agents pause for a human decision — this is worth switching on.