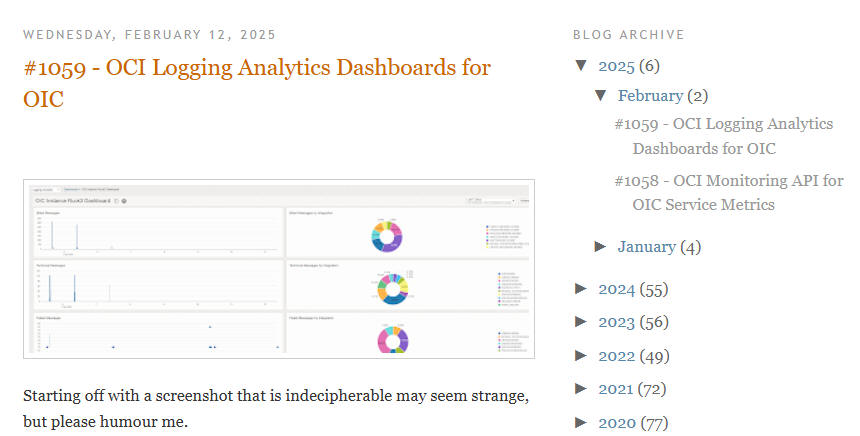
OCI Logging Analytics Dashboards for OIC
Introduction
OIC includes comprehensive observability functionality, which is sufficient for most customers. However, there are other OCI services that give us access to OIC service metrics and activity streams. Tools such as OCI Metrics Explorer, OCI Logging, and OCI Dashboards provide great added value in this space. This post covers OCI Logging Analytics and how you can easily create a compelling dashboard based on OIC service metrics, a dashboard your OIC admins will love!
This post is more high level, showing you the value added with OCI Logging Analytics Dashboards for OIC. The dashboard I have created is one I feel could be very useful for OIC admins. You can, of course, create your own, depending on your specific requirements.
There is an accompanying “low level” post, for those interested in the “How?” part. A link to this more technical post can be found in the Summary section.
OCI Logging Analytics
According to the public page, “Logging Analytics is a cloud solution in Oracle Cloud Infrastructure that lets you index, enrich, aggregate, explore, search, analyze, correlate, visualize, and monitor all log data from your applications and system infrastructure.”
So, let’s apply this to OIC. There are essentially two sets of “log” data: OCI Service Metrics for OIC and the OIC activity stream. This post will focus on creating a dashboard based on the former.
OCI Service Metrics for OIC
There are many metrics currently rendered on the OIC instance page in OCI:
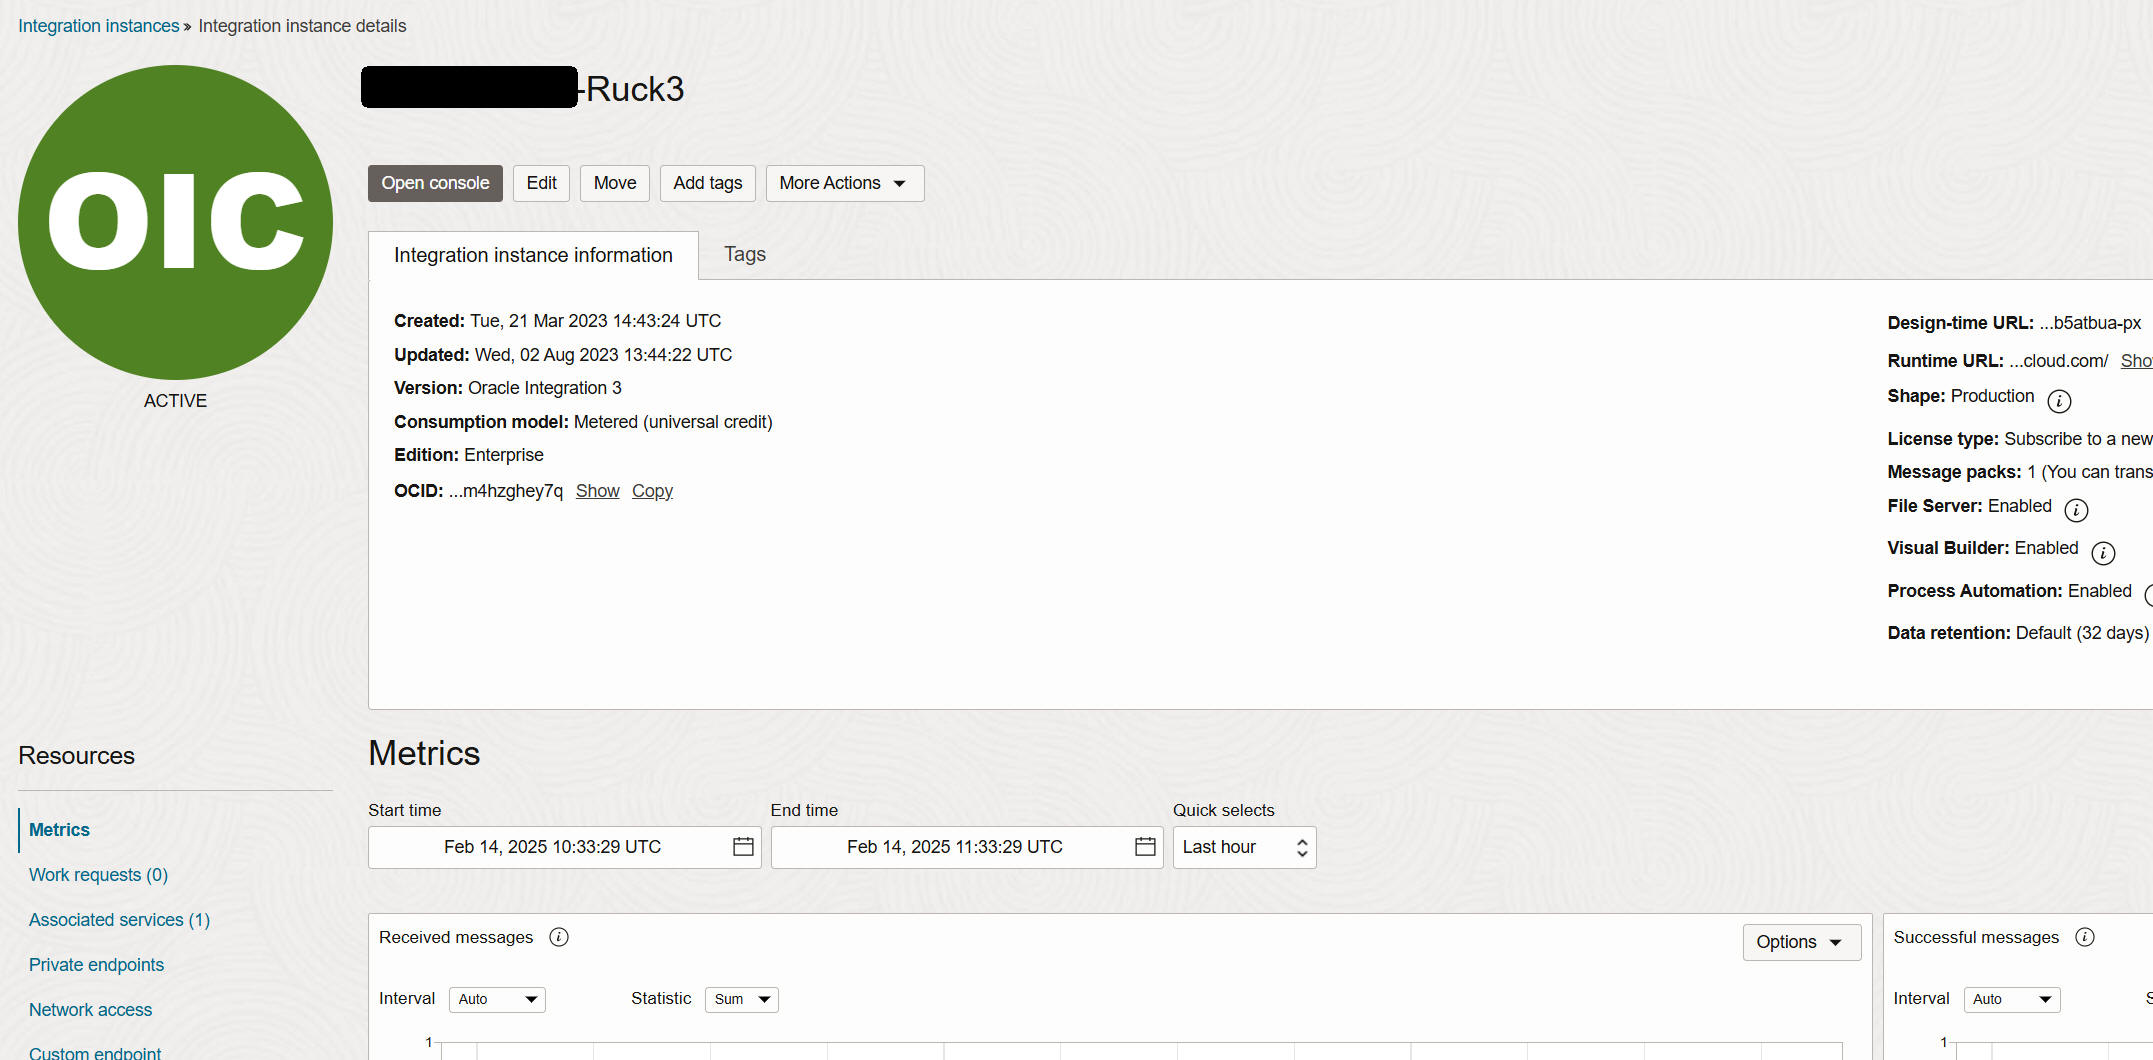
The metrics I will be using in my OCI Logging Analytics dashboard are the following:
- Received messages – Shows the message requests that the instance received.
- Failed messages – Shows the message requests that did not complete successfully for the instance.
- Outbound requests – Shows the number of adapter outbound requests for the instance.
- Consumed messages – Shows the billable messages the instance has incurred.
Creating a Dashboard in OCI Logging Analytics
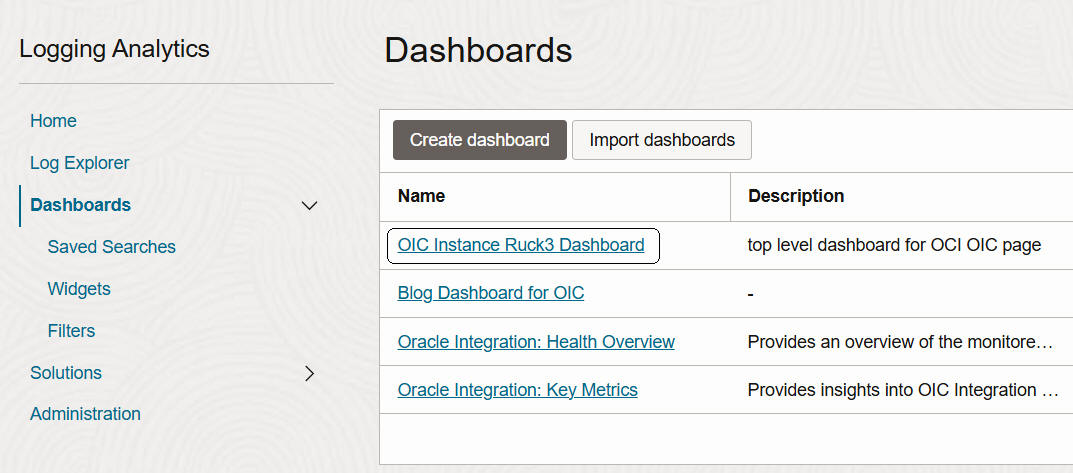
OCI Logging Analytics comes with a set of OOTB dashboards for OIC. These dashboards are very useful and can also be used as a template for your own, more specific, dashboards.
You can, of course, create your own by simply clicking Create dashboard.
Dashboards are made up of widgets. Here are my first two:
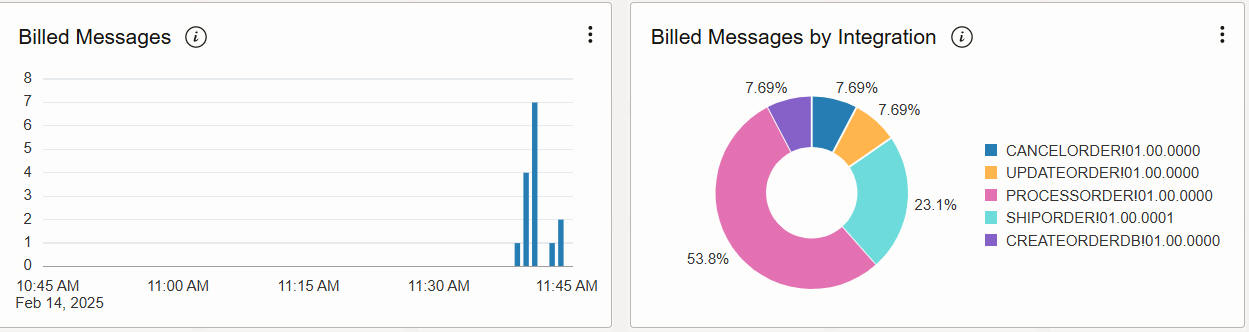
These are based on the metrics from my demo instance, hence the low numbers. However, this makes it easier for us to reconcile them.
Just a note about these two widgets: the Billed Messages widget is simply based on the Billed Messages OCI Service Metric for OIC. The second widget – Billed Messages by Integration – is based on the same metric, but is a query-based widget.
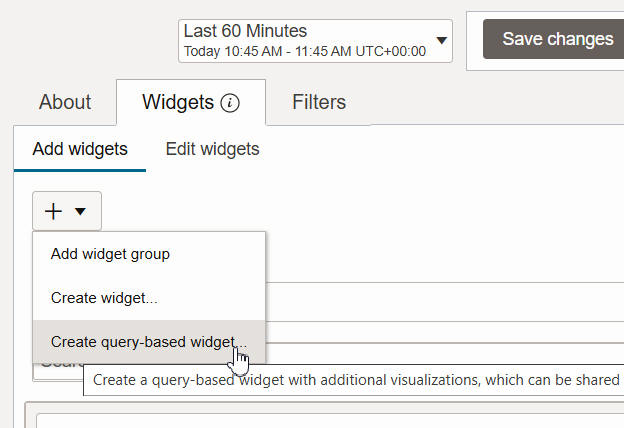
To create a query-based widget (in my case, a query that groups billed messages by integration), you need to have a basic knowledge of OCI Service Metrics MQL (Metrics Query Language). However, as already mentioned, there is a separate post that goes into great detail on how to create the dashboard under discussion.
The next two widgets in my dashboard are:
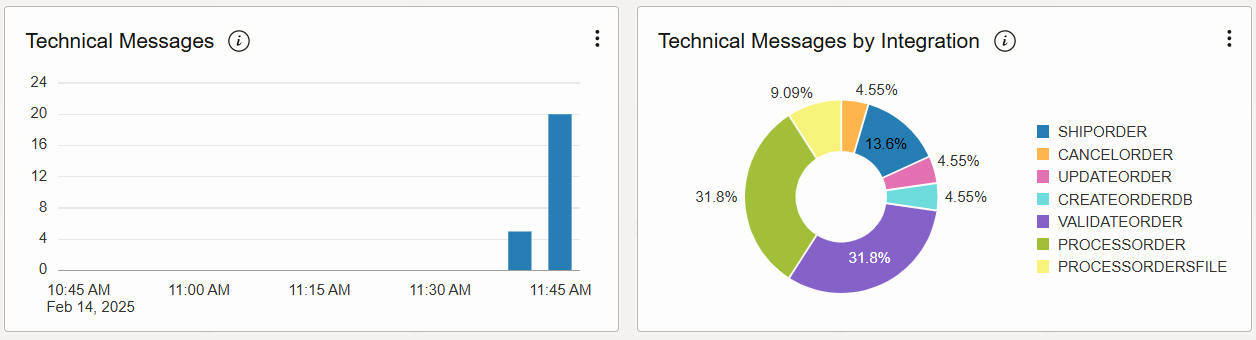
You can note the subtle difference between the data in Technical Messages by Integration and Billed Messages by Integration. ValidateOrder, for example, is an integration invoked by ProcessOrder. It returns a payload < 50 kb, so it is not chargeable. ProcessOrdersFile is a scheduled integration that currently only lists files in an FTP directory. Therefore, it is also not chargeable.
Net, net – with these two sets of widgets, I see which integrations are costing me the most from a commercial and technical perspective.
On to the next pair:
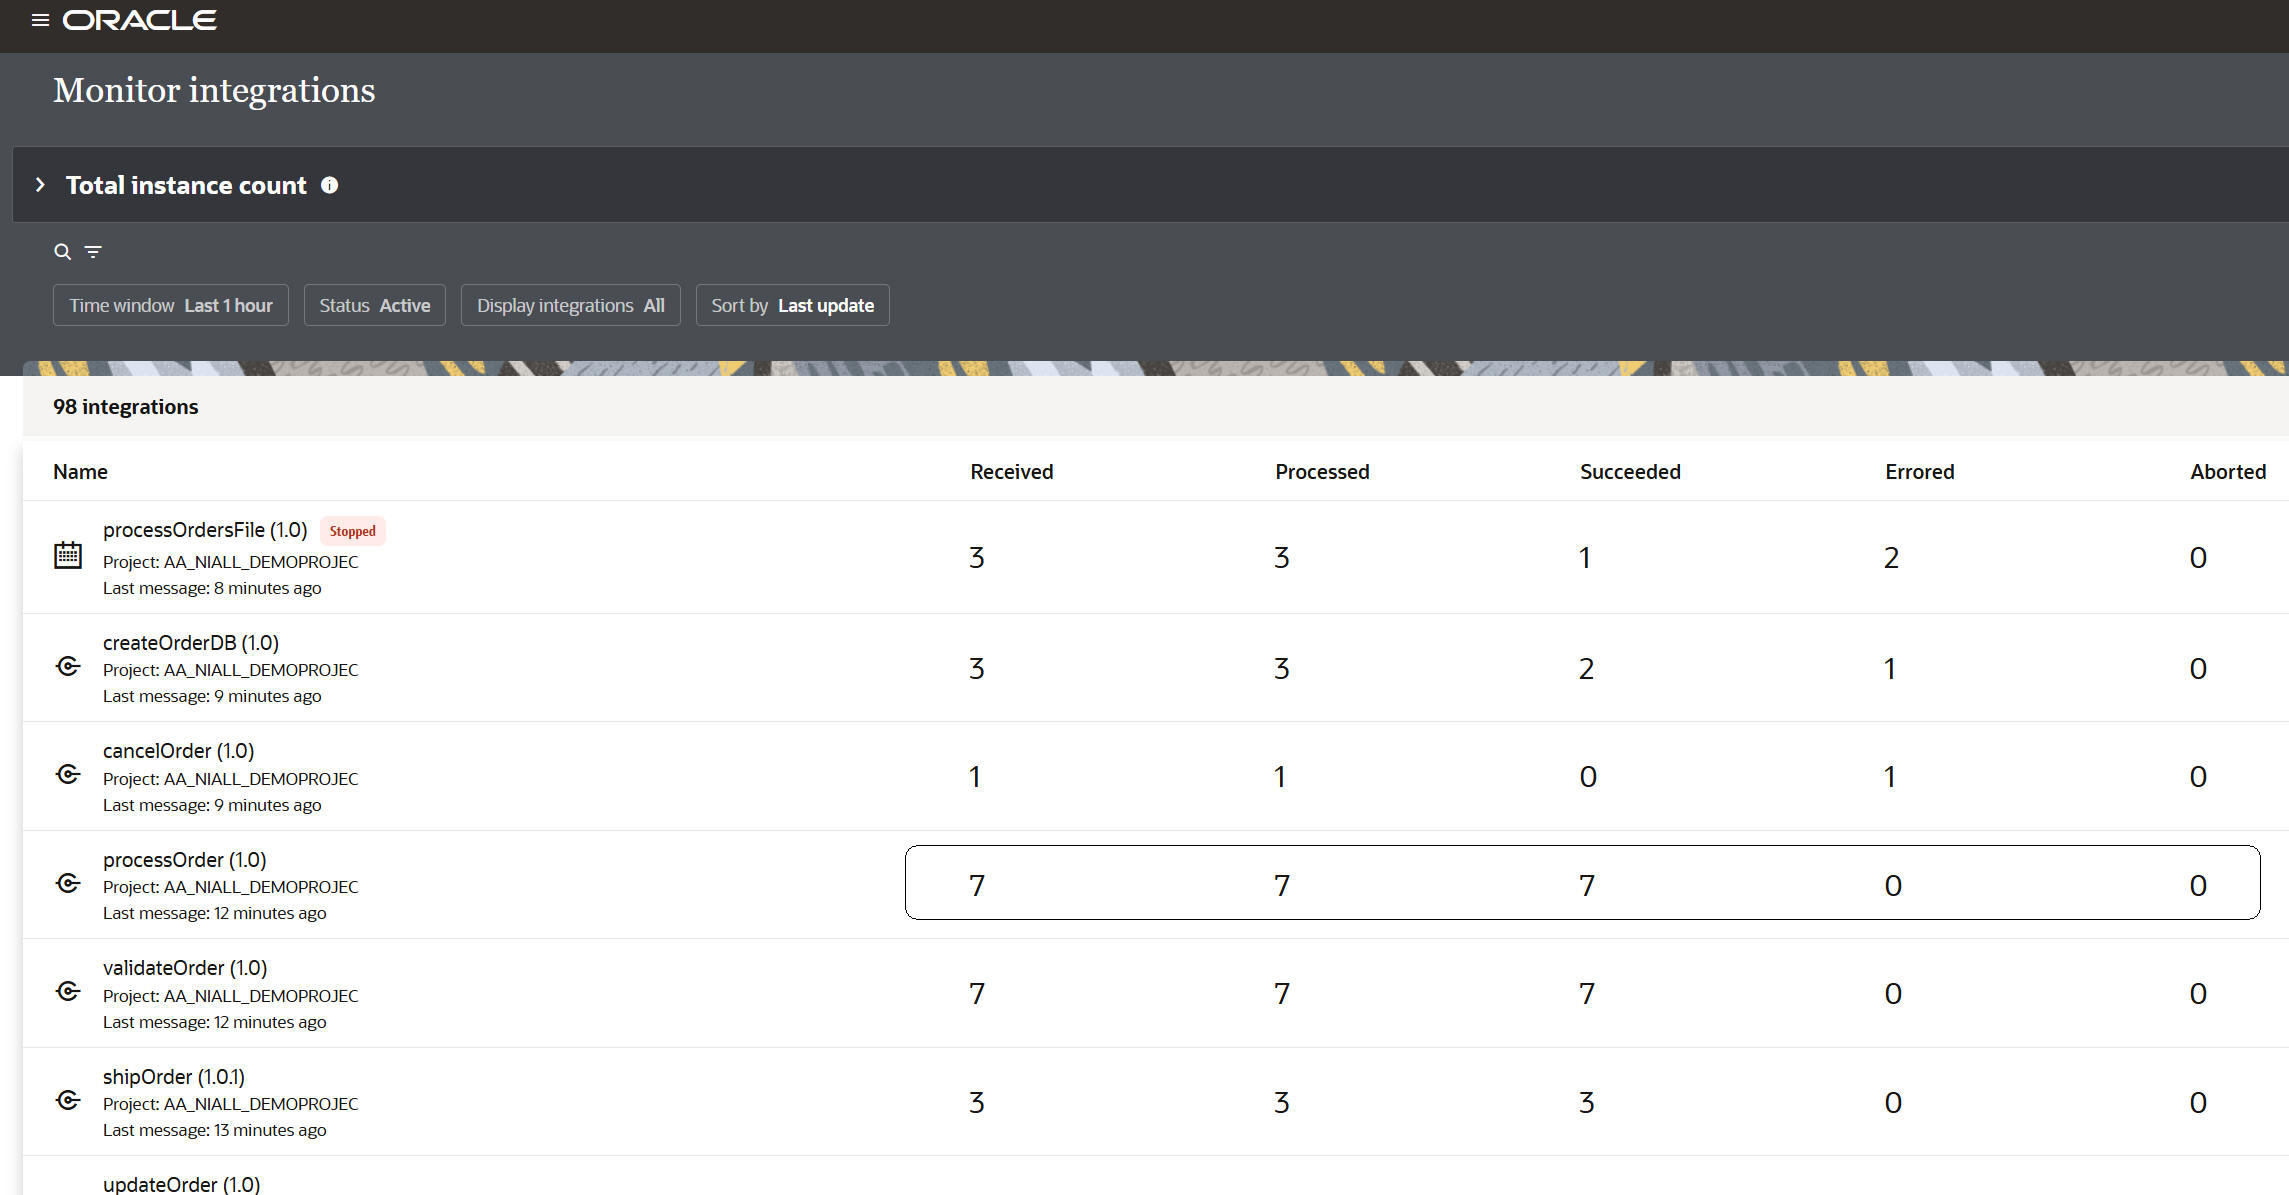
The same modus operandi here. I can also validate against OIC Observability:
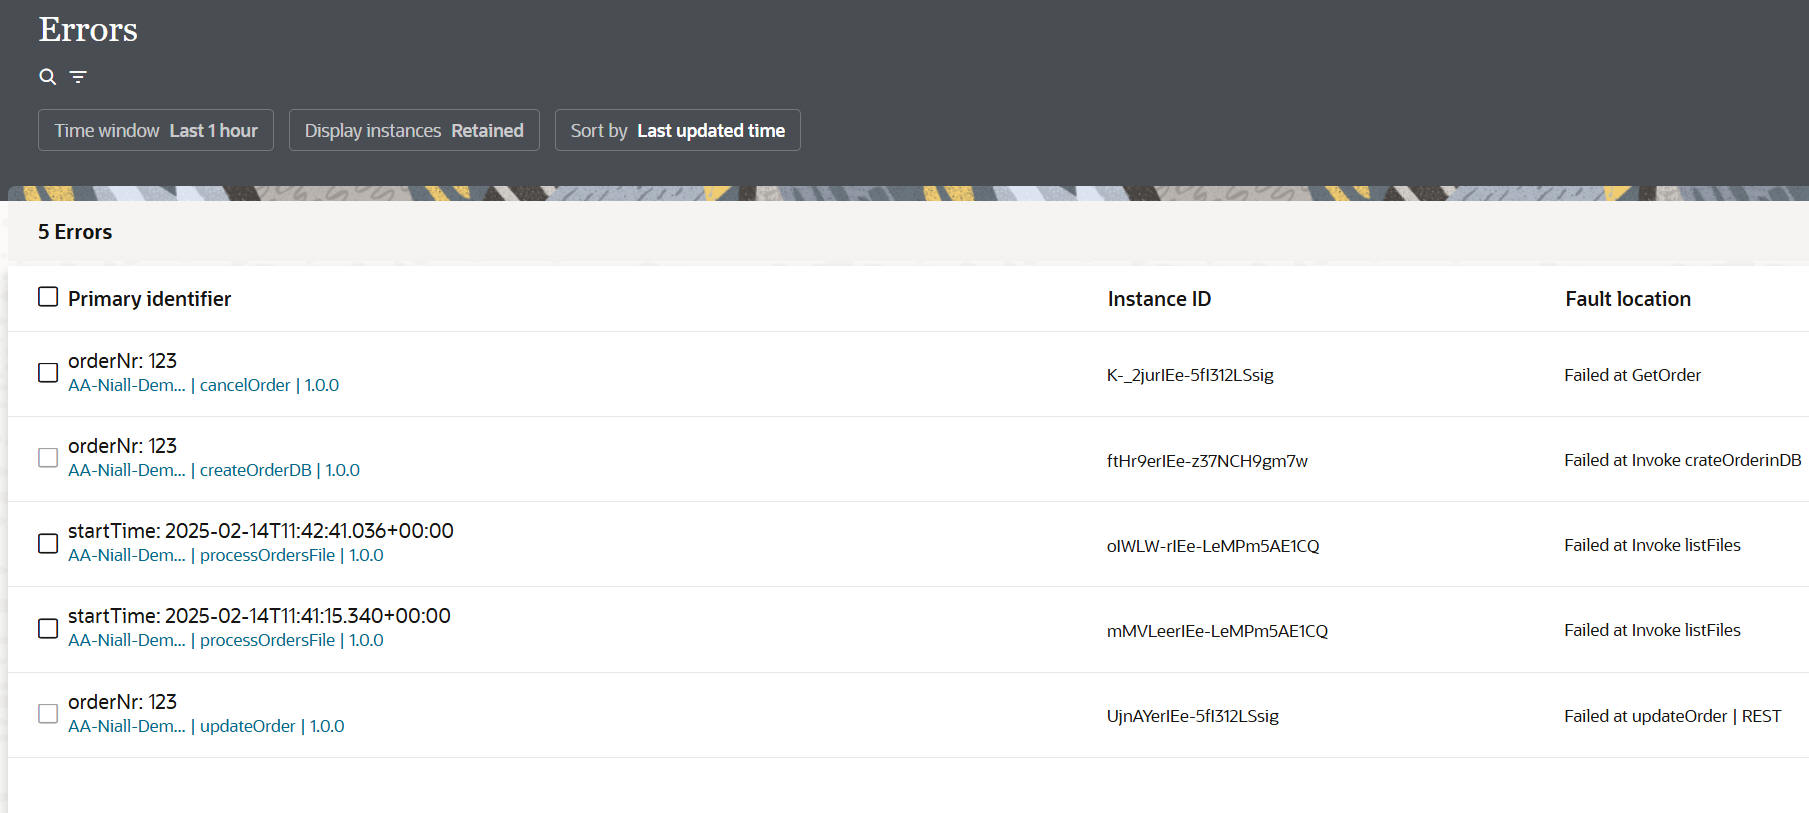
Note, I have two errors for processOrderFile listed in my OIC Observability – Errors page. I see this also in my widget:
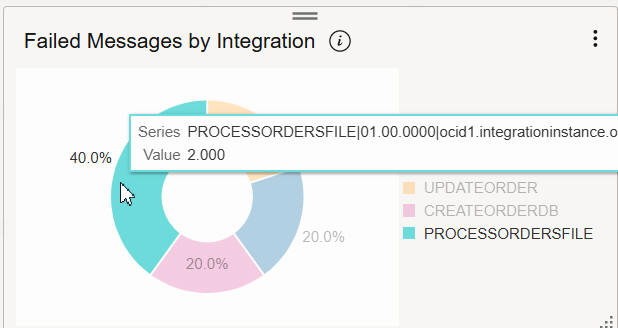
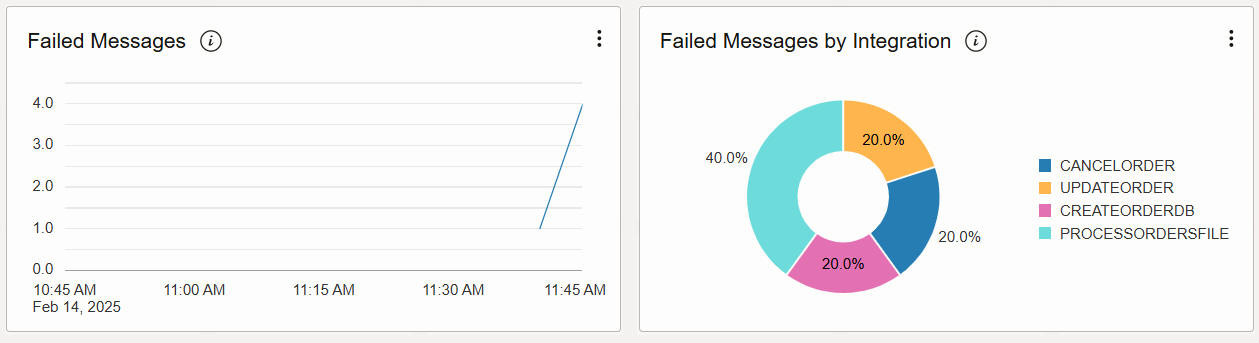
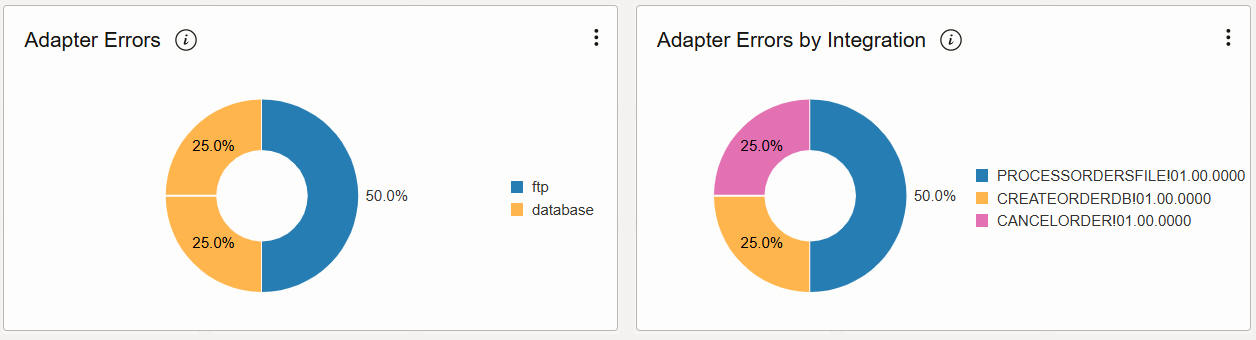
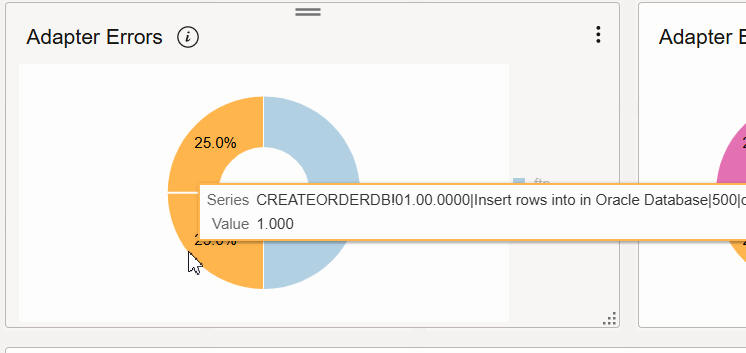
But what about more intel for these errors? The next pair of widgets give me insight on adapter errors:
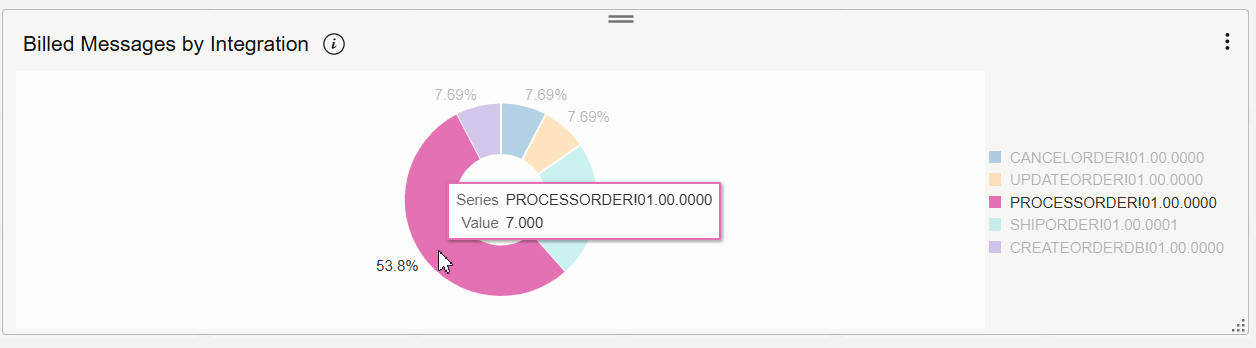
Note that I see the actual error when I hover over a segment:
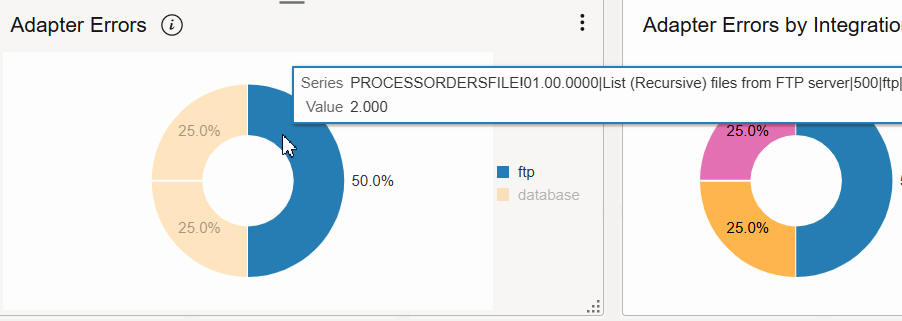
The error was thrown when I attempted to list files in an FTP directory. This integration is running against an FTP server installed on my laptop, so I just stopped the server to induce the error.
One of the database errors was on an INSERT operation:
My final pair of widgets are the following:

Pie charts are great for smaller volumes, but imagine a situation where I have 100s of integrations running in production. So, maybe I just want to see my top five or top ten consuming integrations.
These query-based widgets include a “top” instruction. For example, for the technical top five, the query is as follows:
MessagesReceivedCount[1m].grouping(flowCode).sum().top_n(5).
Summa Summarum
OCI Logging Analytics dashboards are a great added value to OIC monitoring. The how-to post is available here.
Also, remember the out-of-the-box dashboards we deliver with OCI Logging Analytics:
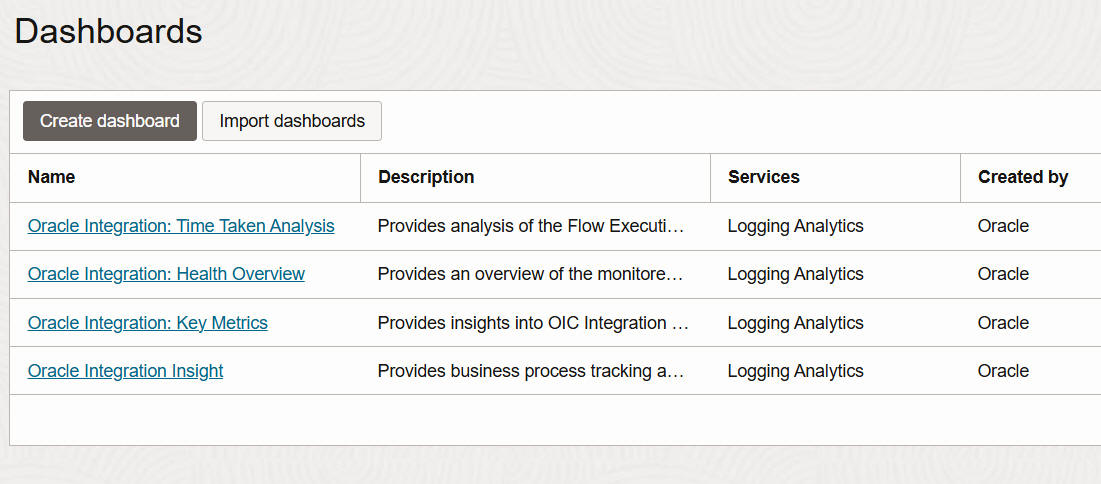
These are also very useful, and as previously mentioned, can be used as templates. The above dashboards cannot be edited directly, but you can duplicate them and edit the copy. So, all that’s left for me to do is wish you Happy Dashboarding!