SQL Monitoring – also known as Real-Time Monitoring – has become one of the most important tools in the field of database monitoring and tuning. Quickly and without effort you get an up-to-date and fast overview of certain – mostly long-running – operations. In contrast to AWR or STATSPACK reports, SQL Monitor also displays statements that are currently active or in a queue. Even statements that are not necessarily “long-running” are automatically listed if they fulfill certain properties. Especially with new applications, new techniques or features, SQL monitoring is an important step in the testing process.
I was recently asked to explain and illustrate Real-Time SQL Monitoring again, so I am using this as an opportunity to summarize the most important aspects using the FAQ format and uploaded some of my SQL scripts to Github for general usage.
Note: If you have more questions which may be listed here, please let me know.
Questions:
- What is Real-Time SQL Monitoring?
- What is the difference between V$SESSION_LONGOPS and SQL Monitoring?
- What are the requirements and prerequisites using SQL Monitoring?
- I cannot use hints to make a special statement for monitoring available? What else can I do?
- How can I use SQL Monitoring in command-line?
- What is a SQL Monitor ACTIVE HTML report?
- Where can I find SQL Monitoring in Oracle SQL Developer?
- Where can I find SQL Monitoring in Autonomous AI Database?
- Is it possible to monitor historical statements which are no longer available in V$SQL_MONITOR?
- How can developers use SQL Monitoring? Do they need special privileges?
- How can I generate a consolidated SQL Monitoring report with more than one statement?
- Can I monitor “Runaway” Queries with Real-Time SQL Monitoring?
- Where can I find more information such as documentation etc?
- What is new in 26ai?
What is Real-Time SQL Monitoring?
Real-Time SQL Monitoring provides automatic monitoring of SQL statements, PL/SQL blocks, or even composite database operations that are considered expensive. Whereby a simple database operation is a single SQL statement or PL/SQL procedure/function. A composite database operation is an activity between two defined points in time in a database session (see the question later). Real-Time SQL Monitoring provides several advantages over traditional “explain plan” techniques. The biggest one is the ability to visualize where time was spent during the execution of the SQL statement. The feature provides also detailed reports, the SQL Monitoring reports, with monitoring information for different kind of operations.
As usual Oracle Database itself provides its own framework to allow accurate monitoring without the use of external tools and/or without additional installations. It includes special data dictionary views, V$ views, PL/SQL packages for various advisory tasks and a special workload repository. With Oracle Database 11g real-time SQL monitoring was introduced and since then enhanced in each database release.
Here is the list of the most important packages and views that make up this technology:
- V$SQL_MONITOR
- DBMS_SQL_MONITOR
- DBMS_SQLTUNE
Making it easy and intuitive to use, it’s implemented in all of our graphical Oracle Database monitoring tools such as Enterprise Manager Cloud Control, SQL Developer and also in the Cloud Console Performance Hub .

Image 1: Real-Time SQL Monitoring in Cloud Control
What is the difference between V$SESSION_LONGOPS and SQL Monitoring?
V$SESSION_LONGOPS, available in each database release, displays the status of various operations – in general that take longer than 6 seconds – including backup & recovery, statistics gathering and query executions. Oracle decides on the operations that will be monitored, you cannot influence which operations will be monitored. The following example lists long running statements and shows the progress status and the remaining time (script download)
SELECT opname, username, sql_fulltext, to_char(start_time,'DD-MON-YYYY HH24:MI:SS'),
(sofar/totalwork)*100 "%_complete", time_remaining, s. con_id
FROM v$session_longops s INNER JOIN v$sql sl USING (sql_id)
WHERE time_remaining > 0;
What are the requirements and prerequisites using SQL Monitoring?
Statements that are not necessarily “long-running” are automatically listed if they fulfill the following properties. For a single statement execution, at least one of the following conditions must be met:
• parallel execution
• a resource consumption of at least 5 seconds I/O or CPU time
• use of the special statement hint MONITOR ( e.g. select /*+ MONITOR */ … from …)
In addition Diagnostics and Tuning Packs are required and need to be enabled (i.e. CONTROL_MANAGEMENT_PACK_ACCESS = DIAGNOSTIC+TUNING and STATISTICS_LEVEL = TYPICAL).
I cannot use hints to make a special statement for monitoring available? What else can I do?
You may set the following event including the SQL_ID(s) you want to get monitored:
ALTER SYSTEM SET EVENTS 'sql_monitor [sql:my sql_id] force=true';
How can I use SQL Monitoring in command-line?
The following 2 steps are required:
1) Find the SQL_ID using v$SQL and V$SQL_MONITOR (script download).
SELECT distinct s.sql_text, m.sql_id, m.cpu_time
FROM v$sql_monitor m INNER JOIN v$sql s ON s.sql_id=m.sql_id
ORDER BY m.cpu_time;

SQL_TEXT
--------------------------------------------------------------------------
SQL_ID        CPU_TIME
------------- ----------
select count(quantity), product_name from soe.order_items o, soe.products p
where p.product_id=o.Product_id group by product_name
7xc7jn2v40p35 27116361
Note: As an alternative you may use the automatic SQL_ID listing in SQL*Plus with the SQL*Plus command SET FEEDBACK ON SQL_ID.
2) Generate reports with DBMS_SQL_MONITOR.REPORT_SQL_MONITOR in different formats dependent on the argument TYPE such as HTML, TEXT, XML and ACTIVE.
For a complete description please read the documentation of DBMS_SQL_MONITOR.
The below SQL*Plus format settings will generate a correct HTML SQL Monitoring report. Otherwise you may need to clean up the generated output by removing redundant statement text.
Make sure that the LONG and LONGCHUNKSIZE format settings are big enough.
(script download)
set trimspool on
set trim on
set pagesize 0
set linesize 32767
set long 5000000
set longchunksize 5000000

spool sqlmon_active.html

SELECT dbms_sql_monitor.report_sql_monitor(sql_id => '7xc7jn2v40p35', type => 'HTML', report_level => 'ALL')
FROM dual;

spool off
The following screenshot shows the resulting report.
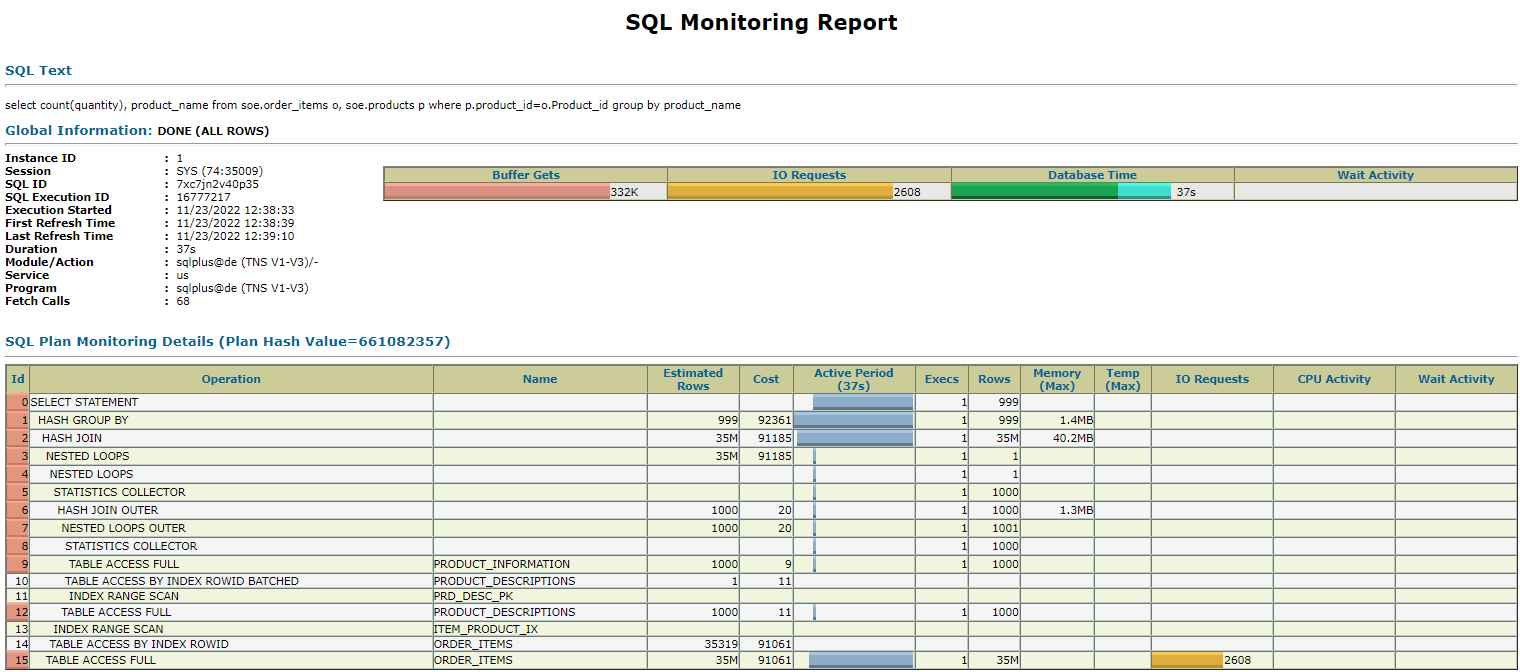
Image 2: SQL Monitoring report in (static) HTML format
What is a SQL Monitor ACTIVE report?
When choosing report type ACTIVE, you will receive an (inter)active SQL monitoring report. In addition you will be able to hover over the bar graphs, as well as other parts of the report, which highlight what the usage corresponds to. Some information such as explain plan, metrics and plan histograms is only shown when this type is selected. In Oracle Database 19c the format of SQL Monitor active reports has changed to Java JET technology and no longer uses Flash.
The following example shows an active report. Keep in mind that the report is active with clickable pages and that you can send it over to colleagues and experts who can investigate further.
The script to generate an ACTIVE report can be found here.
Image 3: SQL Monitoring report in active HTML format
Where can I find SQL Monitoring in Oracle SQL Developer?
In SQL Developer, use the menu item “Tools =>Real Time SQL Monitor” to receive the list of monitored statements. Then click on the statement you want to analyze. You will get a detail page with plan statistics, plan, metrics etc. Using Plan Statistics, you can also find information on oracle database resource usage such as I/O Requests, temp usage etc.
On the left side (see Image 4) you can save the report e.g. as HTML or as ACTIVE report.
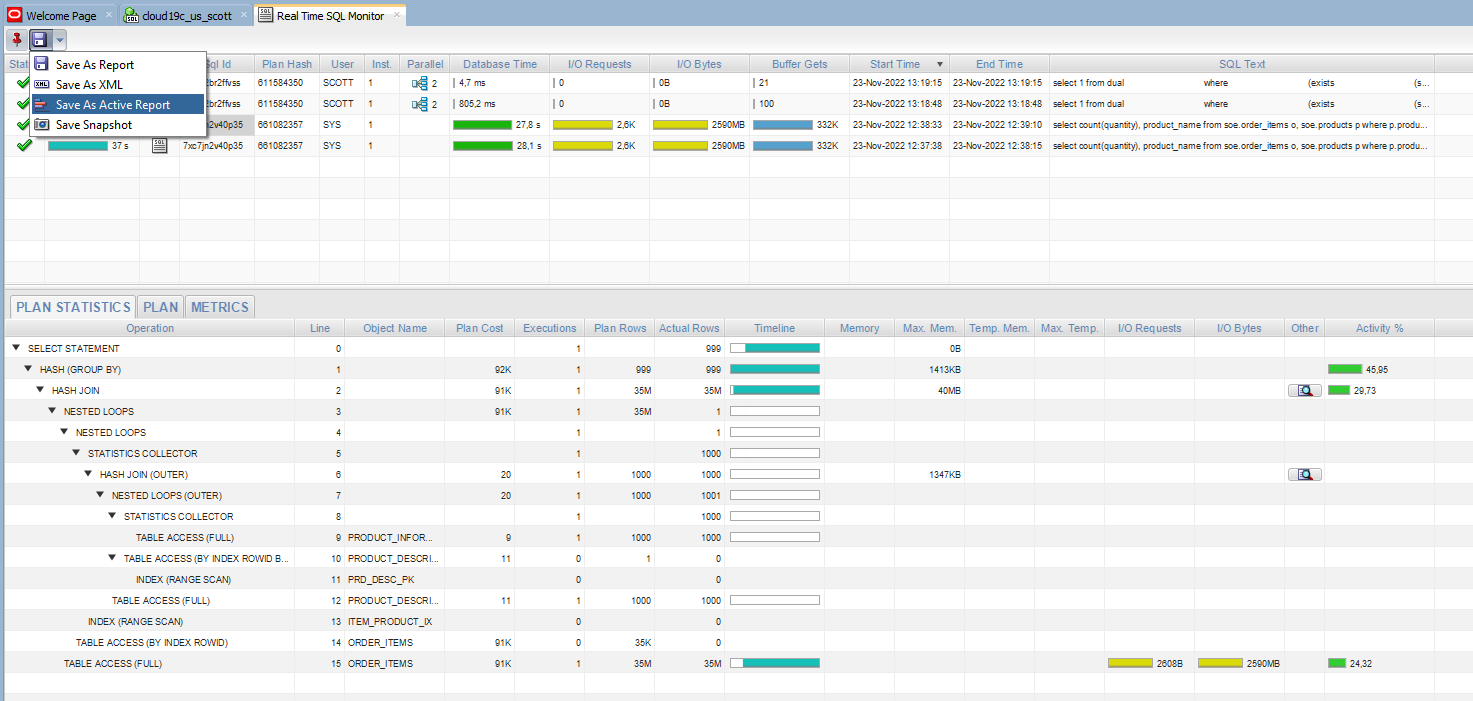
Image 4: Real-Time SQL Monitor in SQL Developer
Where can I find SQL Monitoring in Autonomous AI Database?
In Autonomous AI Database, it’s available via Performance Hub. To view Performance Hub, click on Performance Hub on the Autonomous AI Database details page.
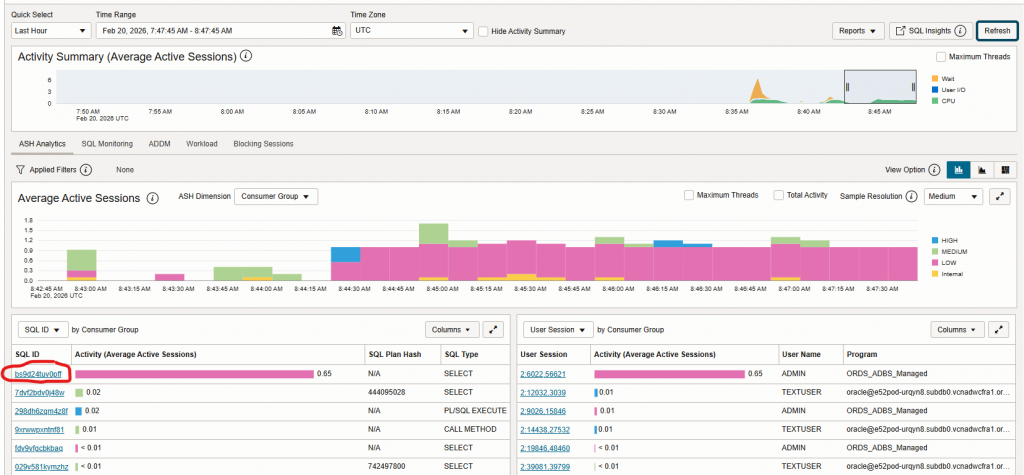
Then click on the SQL ID you want to investigate. Please keep in mind: SQL statements are only monitored if they’ve been running for at least five seconds or if they’re run in parallel or you used the hint MONITOR (see also the section on What are the requirements and prerequisites using SQL Monitoring?).
The table will display monitored SQL statement executions by dimensions including CPU Time, and Database Time. The table displays currently running SQL statements and SQL statements that completed, failed, or were terminated. The columns in the table provide information for monitored SQL statements including Status, Duration, and SQL ID.
Is it possible to monitor historical statements which are no longer available in V$SQL_MONITOR?
Yes. Historical SQL monitoring reports based on captured AWR snapshots can be generated using performance hub reports (e.g. in Enterprise Manager Cloud Control or Cloud Console) or using command-line.
The following steps demonstrate the command-line usage:
1. Get the REPORT_ID using the DBA_HIST_REPORTS view.
SELECT report_id, snap_id FROM dba_hist_reports
WHERE dbid = 2234328383 AND component_name = 'sqlmonitor' AND key1 = '7xc7jn2v40p35'AND
period_start_time > to_date('15/11/2022 13:00:00','DD/MM/YYYY HH24:MI:SS') AND
period_start_time < to_date('16/11/2022 14:00:00','DD/MM/YYYY HH24:MI:SS');
2. Execute DBMS_AUTO_REPORT.REPORT_REPOSITORY_DETAIL using the report_id (here RID) to get the historical SQL Monitoring report
set linesize 32767
set trimspool on
set trim on
set long 1000000
set longchunksize 1000000
set pagesize 0
spool sql_mon_hist_2556.html

SELECT dbms_auto_report.report_repository_detail(RID => 27556, TYPE => 'html') FROM dual;

spool off
Note: AWR snapshot default interval is 60 minutes and its retention is 8 days. f you need to change this settings please execute dbms_workload_repository.modify_snapshot_settings.
You will find more information in My Oracle Support document “How To Get Historical SQL Monitor Report For SQL Statements KB96390“.
How can developers use SQL Monitoring? Do they need special privileges?
Starting with 19c, Database users can generate and view SQL monitoring reports of SQL statements issued by themself, without any additional privileges. In this case SQL monitoring reports can be generated by DBMS_SQLTUNE.REPORT_SQL_MONITOR_LIST and DBMS_SQLTUNE.REPORT_SQL_MONITOR or Enterprise Manager Cloud Control.
If users have been granted the SELECT_CATALOG_ROLE, they can also see SQL monitor report of SQL executed by other users.
The following example generates an HTML SQL Monitoring report (script download). Please use the format information shown to obtain the report.
set trimspool on
set trim on
set pagesize 0
set linesize 32767
set long 1000000
set longchunksize 1000000

SELECT dbms_sqltune.report_sql_monitor(type => 'html') FROM dual;
How can I generate a consolidated SQL Monitoring report with more than one statement?
You only need to tag the operations which should be included in the report so called composite database operation. A composite database operation is activity between two defined points in time in a database session. Use DBMS_SQL_MONITOR.BEGIN_OPERATION to start and END_OPERATION to end a composite database operation in the current session.
execute id: = dbms_sql_monitor.begin_operation(dbop_name => 'sales_job');
... operations ...
execute dbms_sql_monitor.end_operation(dbop_name => 'sales_job', dbop_eid => id);
Then use the value of DBOP_NAME in DBMS_SQL_MONITOR to receive the SQL Monitoring report.
SELECT dbms_sql_monitor.report_sql_monitor(dbop_name =>'sales_job') FROM dual;
Can I monitor “Runaway” Queries with Real-Time SQL Monitoring?
Oracle Database Resource Manager can take action when a session or call consumes more than a specified amount of CPU, physical I/O, logical I/O, or elapsed time. Resource Manager can either switch the session or call to a consumer group that is allocated a smaller amount of CPU or terminate the session or call. In this case V$SQL_MONITOR logs the recent action, that was taken on this SQL operation by Resource Manager. Its value is one of the following CANCEL_SQL, KILL_SESSION, LOG_ONLY and SWITCH TO Consumer GROUP. Query the required columns with prefix RM such as RM_LAST_ACTION, RM_LAST_ACTION_REASON and RM_LAST_ACTION_TIME and RM_CONSUMER_GROUP to get the required information.
SELECT username, elapsed_time, plsql_exec_time, sql_text, cpu_time,
rm_last_action, rm_last_action_reason, rm_last_action_time, rm_consumer_group
FROM v$sql_monitor WHERE username is not null;

USERNAME                       ELAPSED_TIME PLSQL_EXEC_TIME
------------------------------ ------------ ---------------
SQL_TEXT
--------------------------------------------------------------------------------
CPU_TIME   RM_LAST_ACTION
---------- ------------------------------------------------
RM_LAST_ACTION_REASON          RM_LAST_A RM_CONSUMER_GROUP
------------------------------ --------- ------------------------------
SH                             378358        0
select /*+ use_nl(c) parallel ordered*/ count(*) from sh.sales s,sh.customers c
where c.cust_id=s.cust_id and cust_first_name='Dina'
10998     SWITCH TO OTHER_GROUPS
SWITCH_CPU_TIME                19-FEB-22 OTHER_GROUPS
What’s new in 26ai?
To help DBAs and developers to avoid and identify some mistakes when building queries a new sectio is added to the SQL execution plan. It’s called the SQL Analysis Report and appears in a new section at the end of a SQL execution plan. It’s available with DBMS_XPLAN and also in SQL active reports.
The following code snippet demonstrates the capability in a SQL active report.
set trimspool on
set trim on
set pagesize 0
set linesize 32767
set long 5000000
set longchunksize 5000000

spool sql_analysis.html
select dbms_sql_monitor.report_sql_monitor(sql_id =>'b0t2n7mp41s85', report_level =>'ALL', type =>'ACTIVE') from dual;
spool off
And this is the generated active report.
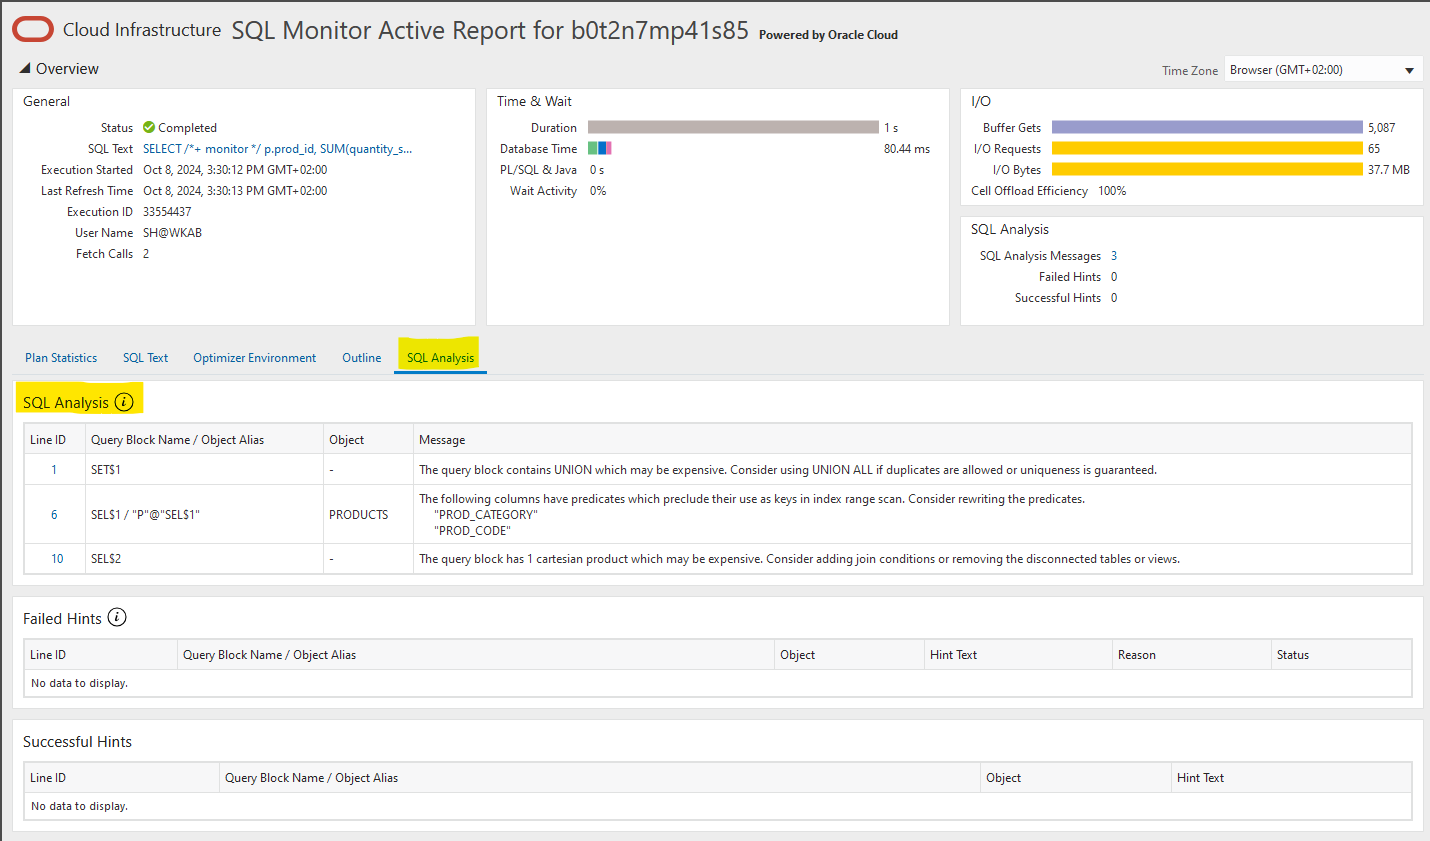
Please note, additional information on failed and successful hint usage is automatically added ( since Oracle database 19c).
More information and further reading
- Monitoring, Analyzing and Diagnosing SQL Statements in 23ai (YouTube)
- Diagnose SQL performance with DBMS_SQLDIAG (posting)
- All script files of this posting: github.com/oracle-devrel/technology-engineering/tree/main/data-platform/core-converged-db/db-performance/sql-performance/sql-monitoring/files
- Real-Time SQL Monitoring and Oracle Database In-Memory (technical brief)
- PL/SQL Package and Data Dictionary View documentation
- Getting the most out of Oracle SQL Monitor (Blog)
- How To Get Historical SQL Monitor Report For SQL Statements KB96390
- Monitoring SQL Statements with Real-Time SQL Monitoring KB135307